In this paper, we propose a method for effectively evaluating the quality of business English teaching in colleges and universities. The approach is based on a multimodal neural network model integrated with grey correlation analysis. By employing the optimal data clustering criterion, we identify teaching quality evaluation indices. Subsequently, we establish a teaching quality evaluation index system using a genetic algorithm (GA) optimized Radial Basis Function (RBF) neural network. Grey correlation analysis is then applied to assess the quality of business English teaching by considering the relationship between the correlation degree and the evaluation level. The results indicate a correlation degree exceeding 0.90, signifying excellent teaching quality. The reliability of the selected evaluation indicators, assessed through retesting, surpasses 0.700, validating the evaluation results.
As the reform of teaching materials, teaching modes, and teaching methods based on the Internet and multimedia has intensified, there are various teaching materials and methods for English at the university. Research results related to them are abundant, but their disadvantages should not be underestimated [1]. Currently, most schools still adopt traditional methods of section and term examinations to evaluate students’ academic performance. However, due to differences in teaching materials, schedules, student populations, and teacher standards, term examination papers are bound to have great variability, with some being irregular, leading to low reliability and validity of the papers’ quality. Moreover, the proportion of process evaluation methods is unreasonable, and the content and methods of assessment are irregular, resulting in subjective evaluations by teachers with obvious partiality and unfair grading [2]. The lack of an effective teacher teaching quality evaluation system to monitor and guide teachers in terms of content, quality, methods, and assessment further complicates ensuring consistent English teaching quality across geographical, professional, and student population differences [3].
Significant differences exist between high school and university English in terms of teaching aims, requirements, modes, methods, and assessment methods [4]. Despite these differences, there is a prevalence of repeated teaching content, such as the repetition of vocabulary and grammar teaching, which can lead to a loss of student interest and motivation to progress. Freshmen often approach learning with a passive mindset [5]. It is crucial to familiarize them with the university English course requirements, actively adjust their learning strategies, and help them make a smooth transition from high school English. Additionally, listening and speaking skills are generally uneven among university freshmen in ordinary colleges and universities [6]. This issue is primarily influenced by the rate of advancement in secondary and higher education examinations. Many regional secondary schools lack systematic training classes on listening and speaking. A considerable number of students report difficulties understanding college English classes, struggling to follow them, and feeling reluctant to speak. Implementing the course requirements for listening and leading classroom teaching in college English becomes challenging [7]. Furthermore, the English language teaching is not consistently implemented, leading many students to view English study at the university as solely for passing Level 4 and 6 exams. Once these exams are passed, they lose motivation to progress [8]. Presently, university students generally lack clear English learning goals, a positive attitude, and independent learning ability. The phenomenon where university students not only fail to use English fluently after four years of study but also regress in English during university requires sufficient attention [9].
There are various methods for evaluating teaching quality, including qualitative, quantitative, and integrated methods that combine both [10]. Each method has its unique advantages and scope of application. In the detailed application process, it is essential to choose a suitable method based on the assessment objectives and actual assessment needs [11]. The grey correlation analysis method is a qualitative and quantitative evaluation method that targets grey systems with incomplete and clear information. This method has a less complex structure, lower computational requirements, and is not strictly constrained by the number of evaluation samples, making it more applicable [12]. In this context, a study [8] constructed a distance learning quality evaluation model and implemented teaching quality evaluation based on support vector machines, achieving improved evaluation results. Another work [31] proposed an intelligent algorithm-based teaching quality evaluation method, using a genetic algorithm to enhance the BP neural network for teaching quality evaluation, resulting in faster convergence speed and improved evaluation accuracy.
This paper addresses the issue of evaluating the quality of English teaching in universities and proposes a method based on a genetic algorithm to enhance the RBF neural network for teaching quality evaluation. The method utilizes a genetic algorithm to optimize the initial weights and radial basis parameters of the RBF neural network, and the evaluation indexes are selected through principal component analysis.
The prerequisite for optimal data clustering is that the differences
between the indicators of business English teaching quality evaluation
in higher education are small [14]. The standard interval for setting the
clustering type of the college business English teaching quality
evaluation indicators is
The mean of the
The mean value of the distance between the
The clustering needs to take into account the inter-class closeness
and the inter-class distribution [16]. Setting the weights to
The process of constructing a quality assessment system for business English teaching and learning in higher education is illustrated in Figure 1.
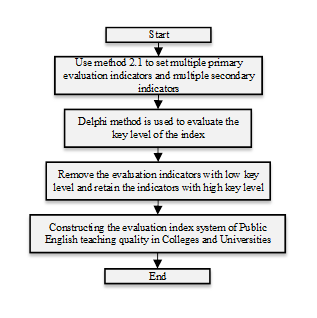
According to Figure 1, the process of constructing the evaluation
index system involves several key steps. Firstly, for the evaluation
index system of the quality of business English teaching in colleges and
universities, the application of the evaluation index screening method
based on the optimal data clustering criterion is crucial to obtain the
relevant indices. Secondly, a set of primary and secondary evaluation
indicators is defined to comprehensively assess the teaching quality.
Finally, employing the Telfer method is essential to evaluate the
critical level of indicators. This leads to the removal of non-critical
indicators based on their critical level, ensuring the retention of
indicators with a high critical level (
RBF neural networks, rooted in function approximation theory, represent feed-forward neural networks renowned for their robust global optimization capability. Widely applied in signal processing, image processing, and pattern recognition, they have proven effectiveness [17].
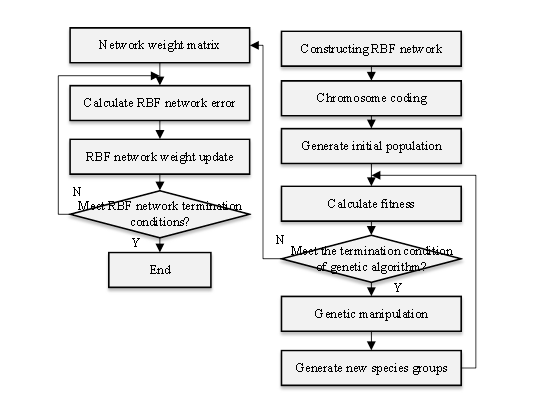
To determine the optimal initial parameters of the RBF neural network before training, a genetic algorithm was employed. This algorithm ascertains the optimization direction by randomly generating multiple starting points and executing adaptive fast parameter search through selection, crossover, and variation operations [18].
The RBF neural network involves a continuous parameter optimization process, and to enhance parameter optimization accuracy, floating-point coding is employed. This coding method avoids subsequent encoding and decoding in selection, crossover, and mutation processes, improving convergence efficiency. It also overcomes the limitations of traditional binary encoding word length, ensuring high parameter optimization accuracy [19].
For the optimization problem of RBF neural network parameters, the
fitness function for the evolutionary operation of the genetic algorithm
utilizes the inverse of the mean square error between the desired output
and the actual output of all individuals in the population.
Mathematically, it is expressed as follows:
The classical proportional selection method, known as the roulette
wheel method, is employed to compute the individual fitness function of
each chromosome and rank them based on their fitness function values.
This method establishes that the higher the fitness function value, the
greater the probability of selecting the corresponding chromosome. For a
chromosome
Crossover is a process where the codes of two chromosomes are
exchanged according to certain rules to enhance population diversity,
resulting in the evolution of two new chromosomes. In genetic
algorithms, most new chromosomes arise from crossover operations, which
are crucial for genetic merit search [20]. In the early stages of genetic evolution, where
the fitness function of individual chromosomes is small,
high-probability crossover operations are needed to enhance the global
merit search ability of the genetic algorithm. In the late stages, as
crossover operations lead to larger fitness functions for chromosome
individuals, operations should be performed with smaller probability to
improve the local merit search ability. The crossover probability in
genetic evolution is set as follows:
The mutation operation involves disturbing and mutating certain gene
loci of chromosomes to produce new chromosome individuals in the process
of biological evolution. In the evolution of the genetic algorithm,
mutation is a crucial step to update chromosome individuals and increase
the optimization ability. The adaptive setting of mutation probability
is carried out with reference to the crossover probability setting
method. The mutation probability setting method is:
The genetic algorithm can optimize the dynamic weight of the RBF neural network, including the center and width of the radial basis function. The structure of the RBF neural network optimized based on the genetic algorithm for evaluating English teaching quality is illustrated in Figure 2.
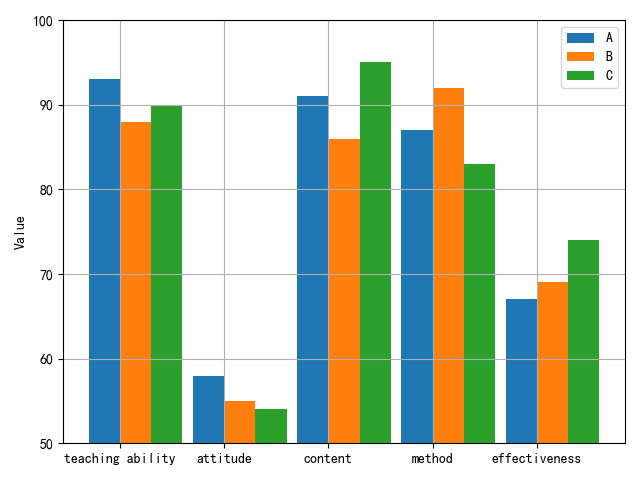
The evaluation index system serves as the foundation for English teaching quality evaluation, and a scientifically sound index system is a crucial factor in ensuring the effectiveness of teaching quality evaluation. Currently, various principles govern the construction of index systems for evaluating teaching quality, such as those based on teaching content and students’ achievements. In the context of evaluating English teaching quality, this paper establishes a specific evaluation index system, depicted in Figure 3.
The English teaching quality evaluation process proposed in this paper unfolds as follows:
Using three teachers A, B, and C from a university as examples, this paper’s methodology was applied to evaluate the teaching quality of these three business English teachers in a specific university. The evaluation index system established by this method is illustrated in Figure 2. The evaluation indices for the three business English teachers are presented in Figure 4.
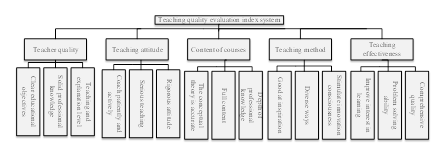
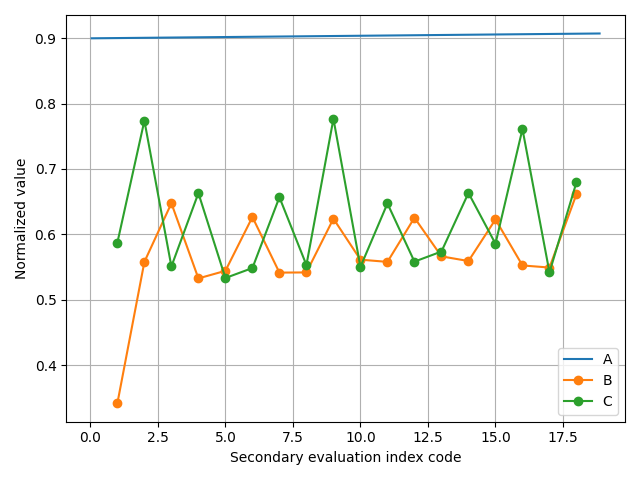
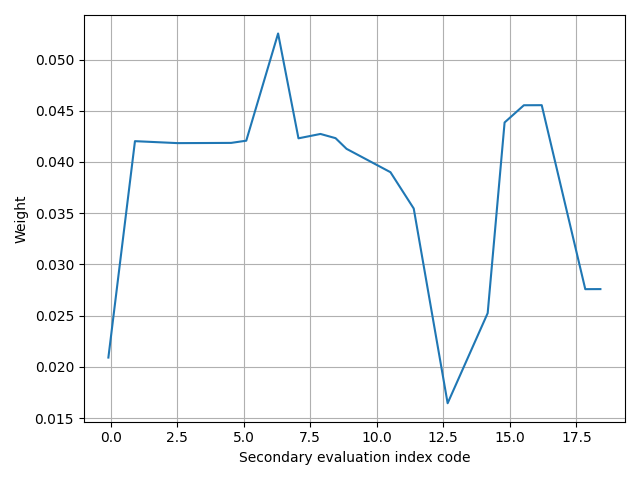
Due to differences in dimension, order of magnitude, and performance mode among the evaluation indices in the teaching quality evaluation index system, a direct comparison is not feasible. Consequently, the experiment uses the secondary index of College Business English teaching quality evaluation, as depicted in Figure 2, as an example for normalization. The normalization results are illustrated in Figure 5. The weights of the 19 secondary indicators are presented in Figure 6.
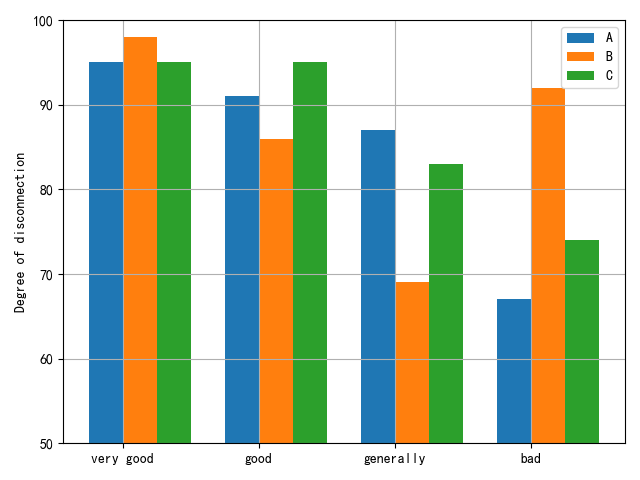
The results of the correlation analysis for the teaching quality of the three business English teachers in the university are depicted in Figure 7. The highest correlation is 0.95, and the corresponding evaluation level for this maximum correlation is deemed “very good.” Consequently, the evaluation result for the teacher’s teaching quality is considered very good. For Teacher B, the correlations for teaching quality are 0.98, 0.88, 0.65, and 0.45, with the maximum correlation being 0.98. The corresponding evaluation level for this maximum correlation is “very good,” indicating an overall very good evaluation for Teacher B’s teaching quality. Similarly, for Teacher C, the correlations are 0.98, 0.88, 0.65, and 0.45, with the maximum correlation being 0.98, and the corresponding rating level is “very good.” Thus, the teaching quality for Teacher C is also evaluated as very good. Overall, the evaluation results for the quality of business English teaching in all three universities are very good.
Principal component analysis was employed to analyze the English teaching quality evaluation indicators in Figure 4. The indicators contributing the most to the evaluation of teaching quality were selected. The results of the principal component analysis are illustrated in Figure 8.
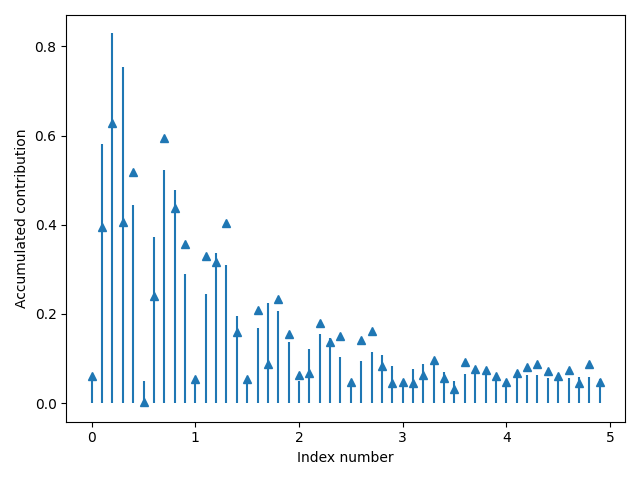
Figure 8 illustrates that the cumulative contribution of the first 8 principal component indicators to the evaluation of the quality of English language teaching has reached 94.3%, surpassing the predetermined threshold for cumulative contribution. This suggests that the first 8 indicators can effectively represent the crucial information contained in all the indicators, serving as a reliable basis for future evaluations of English teaching quality.
The genetic algorithm was applied to optimize the RBF neural network model for evaluating the quality of English teaching. As shown in Figure 9, the original RBF neural network converged in approximately 45 iterations. After optimization using the genetic algorithm, convergence occurred in about 30 iterations, indicating that the genetic algorithm significantly enhances the convergence speed of the RBF neural network and reduces the model’s training time. Additionally, the mean squared error of the RBF neural network optimized by the genetic algorithm consistently remains lower than that of the original RBF neural network, implying that the genetic algorithm contributes to improving the prediction accuracy of the model.
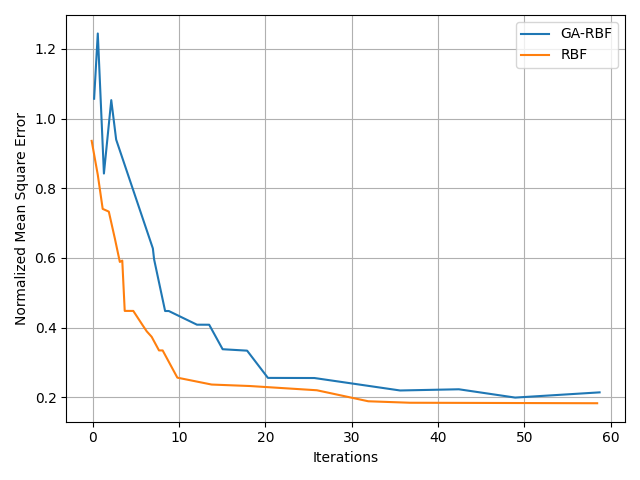
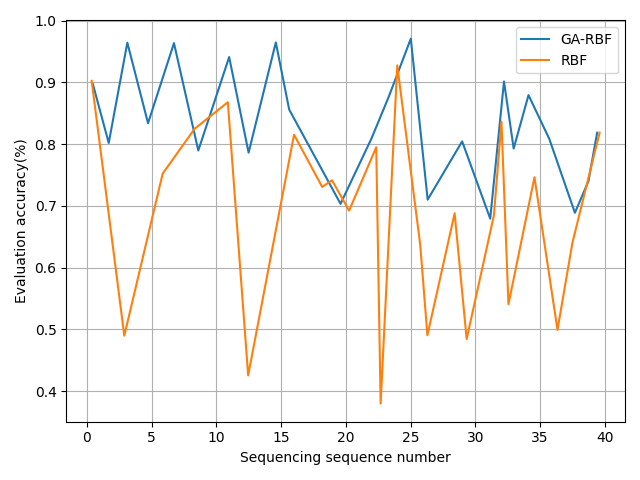
Figure 10 demonstrates that the accuracy of the original RBF neural network exceeds 81%, but the genetic algorithm-optimized RBF neural network exhibits superior accuracy. Statistical results indicate that the accuracy of the genetically optimized RBF neural network model surpasses 90% for 36 out of 40 test samples, with 30 of them exceeding 93
This paper presents an English teaching quality evaluation model based on a genetic algorithm-optimized RBF neural network. The model employs principal component analysis to refine evaluation indexes and utilizes a genetic algorithm to optimize the weight parameters of the RBF network, achieving high accuracy in English teaching quality evaluation. The research introduces a novel method for assessing teaching quality in universities. The method, tested for evaluating the quality of business English teaching in three universities, demonstrates significant stability and consistency in evaluation results over time.
1970-2025 CP (Manitoba, Canada) unless otherwise stated.