
The substation, a crucial node for power transmission and distribution in the rapidly evolving modern power grid system, is closely correlated with the stability and dependability of the power grid due to its design and construction quality [6]. These days, a substation’s construction drawing design—particularly the part involving logical wiring—is typically characterized by a high volume of drawings, a high level of equipment involvement, intricate wiring, a high number of virtual circuits, and a high volume of data. Traditional methods of transferring paper and electronic drawings have drawbacks that make them difficult to access, easy to lose, difficult to check data, etc. These issues make it difficult for substation construction personnel to operate, and they also don’t meet the requirements of digital substation operation and maintenance management [21]. Because of this, digital design software and three-dimensional design software are gradually being applied to substation design to aid in the design process. Digital handover is crucial as a link and bridge for the deployment of digital technologies [8].
By building digital mirrors of physical entities, digital twin technology offers a platform for merging logical and physical models and enables fine management of a substation’s entire life cycle. This technology has a wide range of potential applications because it can not only increase productivity during the design and building stages but also offer more precise decision support throughout the operation and maintenance phase [7,16]. Studying the whole-process 3D design of substation engineering infrastructure based on digital twin technology and investigating the new method of digital handover and management is therefore very valuable from a practical and application standpoint.
In the current power system, digital twin technology has gradually become an important tool for substation operation and management. Digital twins improve the operational efficiency and reliability of substations by constructing virtual models of physical devices, monitoring and predicting the operational status of the devices in real-time. However, in practical applications, the implementation of digital twin technology in substations still faces some challenges.
Firstly, the equipment and systems in substations are usually complex and diverse, making accurate construction and real-time updates of digital twin models a major challenge. Secondly, due to the particularity of the substation environment, the accuracy and completeness of data collection are also subject to many limitations. In addition, the high computational cost and complex data processing requirements of digital twin systems further increase the difficulty of their promotion.
Many researchers and engineers have proposed different solutions to address these issues. For example, improving the quality of data collection by optimizing the layout of sensor networks; Or enhance the predictive ability of digital twin models by introducing machine learning and artificial intelligence algorithms. These methods have to some extent solved some of the problems in the application of digital twins in substations. However, these solutions still have some shortcomings.
Firstly, these methods have a strong dependence on data, and insufficient or biased data may lead to a decrease in the accuracy of the model. Secondly, some solutions may require large-scale modifications to existing systems during implementation, which increases costs and implementation difficulties. Finally, these methods still face challenges in response speed and decision accuracy when dealing with complex environments and emergencies in substations.
While the use of digital twin technology in substation design and construction shows great promise, there are still several obstacles in the way of its widespread promotion and implementation. First off, the majority of applications are still in the physical model stage of the present substation digital design model, which primarily consists of physical and logical models. The creation and handover of logical models have not yet taken shape [15]. Because of the immaturity of the digital design market as a whole, it is difficult to fully utilize professional data because existing design software and systems are frequently limited to a specific field and can only complete a portion of the design function. Additionally, a variety of digital design data are independent of one another. Moreover, two-dimensional and three-dimensional design data have not yet established a useful correlation, which prevents the realization of the full potential of three-dimensional design and display. As a result, three-dimensional design is currently restricted to the screen cabinet layout and basic cable laying [17,18].
Second, there are numerous issues with the conventional method of transferring substation construction drawings, including hard to find drawings, data loss, etc. This makes it difficult for construction workers to operate, and it also cannot keep up with the demands of digital substation operation and maintenance management. One of the main issues in current research and application is how to achieve the digital transfer of design data and create a uniform digital management platform [11,20].
With the use of 3D design and display, digital twin technology can enhance design efficiency and construction quality in addition to creating a digital mirror that is synchronized with the physical world and managing the entire substation design, construction, operation, and maintenance process. The following are the key ways that digital twin technology is advantageous: it can combine data from several specializations into a single platform, facilitate data exchange and collaboration, and increase design and construction efficiency. The substation’s wiring and layout may be represented using three-dimensional design and display, which makes it simpler for construction workers to comprehend and manage and lowers the risk of building errors. With the use of digital twin technology, substation construction and operation status can be tracked in real time, precise decision support can be given, and operation and maintenance effectiveness and safety may be increased [10].
The use of digital twin technology in substation engineering is not without its drawbacks, though, including high implementation costs, high technical costs, and stringent requirements for data quality and system integration, all of which must be gradually overcome in real-world applications. There are currently less regulations for the construction of substation logical models, the relevant software can frequently only complete some of the design functions for one area, and there aren’t many mechanisms for sharing digital design data, even though the State Grid Corporation and provincial companies already have the physical model modeling and digital handover capabilities [19]. Additionally, the two-dimensional design data and three-dimensional design data have not yet formed an effective correlation between the two-dimensional design data, making it impossible to fully utilize the professional data and restricting the application of three-dimensional design and depth of effect. The existing three-dimensional design is also restricted to screen cabinet layout and basic cable laying.
This article advocates the use of digital design outcomes in all facets of engineering construction by building a comprehensive set of modeling, digital handover, and display platforms for the substation logic model based on digital twin technology. By using digital twin technology, the entire substation design, construction, operation, and maintenance process can be managed digitally, increasing management effectiveness and refinement level. It enhances the synergistic efficiency of design, building, operation, and maintenance, and it creates a single platform for managing data across specializations. Three-dimensional design and display enhances construction accuracy and intuitiveness, lowers construction errors, and raises project quality.
Power plants, substations, transmission networks, distribution systems, and customers make up an archetypal electric power network (EPN) [9]. Power plants are not included in the proposed digital twin (DT) model since they are not frequently impacted by hurricanes. The suggested DT integrates information on the location, characteristics, and connectivity of all important parts to create a high-fidelity EPN model. Usually owned by the utility company, access to this data may be restricted for privacy reasons. In order to get over these data limitations and progress research on community resilience, the testbed offers a setting where scientists may obtain pertinent data and refine and validate their techniques [3].
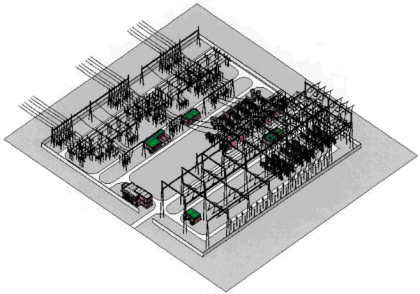
After cleaning and processing, these data can be directly used in Bayesian networks (BNs) to create a network directed graph from substations to users (users receiving services). In addition, the model combines polynomial trees or single path networks that connect any two nodes, as this enables the application of precise BN inference techniques, whose computation time is linearly proportional to the input [13,5]. Realizing a loop-free network is usually easy because the vast majority of the U.S. electricity grid is radial, or at least functions in a radial fashion [2]. On the other hand, it is suggested to use the shortest path between the beginning and last nodes in the loop to break any loops that may exist in the system [14]. Thus, a connected directed network that is free of loops makes up the suggested EPN paradigm. As shown in Figure 1.
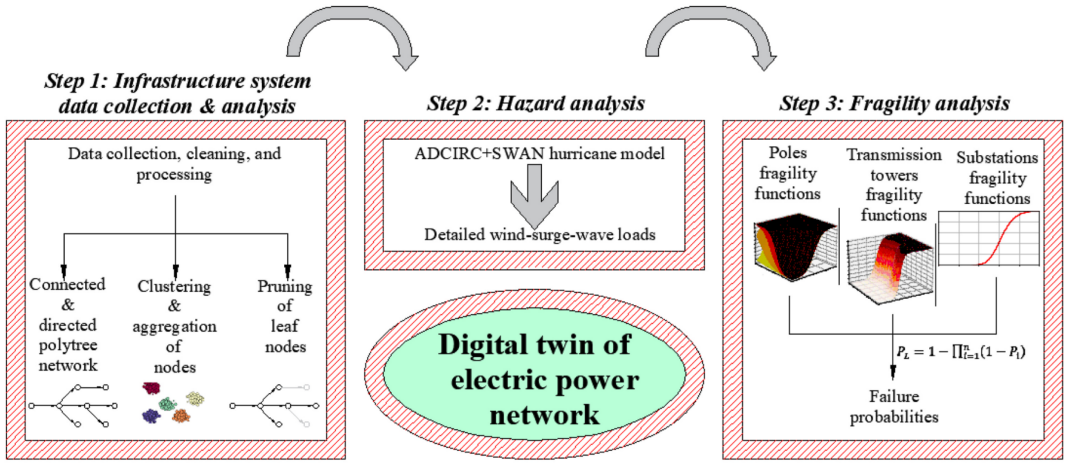
In order to preserve the network’s connectedness and interdependencies while shrinking its size, a methodology of aggregating and centralizing the elements into super nodes is employed, based on the direction of the literature, making this method more scalable and computationally economical [12].
It is regarded as common practice for distribution poles and towers to be integrated into transmission and distribution lines. Buildings can also be arranged into clusters according to their category and spatial location. One popular machine learning approach for spatial clustering based on the maximum distance between two items is density-based noisy spatial clustering application (DBSCAN) [1]. As a spatial clustering algorithm, DBSCAN measures the greatest distance between two items to achieve clustering. Building clustering may result in many distribution line nodes at the network’s terminus. By running these nodes, the network’s size can be decreased without affecting the mathematical model. In summary, the substation nodes, transmission nodes, and network nodes that make up the Bayesian network (BN) in the suggested model will be covered in more detail in the sections that follow.
We must build precise mathematical models to represent the design, construction, operation, and maintenance procedures at each stage in the 3D design of the entire substation engineering infrastructure process based on digital twin technology. We shall extract a number of important formulas and discuss their implications in the sections that follow.
The basic idea behind the digital twin system is to create a digital representation of the real environment using the following formula:
\[\label{e1} DT(t) = (P(t),D(t),M(t)),\tag{1}\] where \(DT(t)\) represents the digital twin system at a certain time \(t\), \({{P(t)}}\) represents the state of the physical entity at time \(t\), \({{D(t)}}\) represents the state of the digital model at time \(t\) and \({\rm{M(t)}}\) represents the mapping relationship between physical entities and digital models.
Additionally, the following equation can be used to characterize the physical state of the substation:
\[\label{e2} P(t) = (L(t),S(t),E(t)),\tag{2}\] where \(L(t)\) represents the position vector (including the three-dimensional coordinates of each device). \(S(t)\) represents structural parameters (including equipment size, shape, etc.) and \(E(t)\) represents electrical parameters (such as voltage, current, etc.)
The numerical model’s current status can be shown as follows:
\[\label{e3} D(t) = (G(t),F(t),C(t)),\tag{3}\] where \(G(t)\) represents the geometric model (including the three-dimensional model of the equipment), \(F(t)\) represents the functional model (including the functional description of the equipment), \(C(t)\) represents the constraint conditions (such as connection relationships, working environment), etc.
The following is an expression of the mapping relationship between digital models and physical entities:
\[\label{e4} M(t) = \left( {{T_m}(t),{T_d}(t)} \right)M(t) = \left( {{T_p}(t),{T_d}(t)} \right)M(t) = \left( {{T_p}(t),{T_d}(t)} \right),\tag{4}\] where \({T_d}(t)\) represents the mapping of digital models to physical entities (e.g., applying optimized model parameters to physical devices) and \({T_p}(t)\) represents the mapping of physical entities to digital models (e.g., mapping sensor data to model parameters).
Real-time data updates are necessary for the digital twin system, and the data update formula is as follows:
\[\label{e5} \frac{{dDT(t)}}{{dt}} = \left( {\frac{{dP(t)}}{{dt}},\frac{{dD(t)}}{{dt}},\frac{{dM(t)}}{{dt}}} \right).\tag{5}\]
It takes multi-objective optimization to create a 3D design. The optimization issue can be stated as follows, assuming that the constraint condition is \({g_i}(x) \le 0\) and the optimization objective function is \(f(x)\).
\[\label{e6} {\min _x}f(x){\rm{ s}}{\rm{.t}}{\rm{. }}{g_i}(x) \le 0,i = 1,2, \ldots ,m.\tag{6}\]
Every deliverable in the proposed framework’s implementation phase had a vulnerability analysis done on it. The degree of risk is measured by a conditional probability that the African agility function offers. As a result, the vulnerability function and the outcomes of the hazard analysis were used to determine the probability of a physical model implementation failure. Binary physiological states were used to compute the survival rates of power grid elements. The vulnerability functions that were employed in this investigation were chosen from the body of current literature and are explained below.
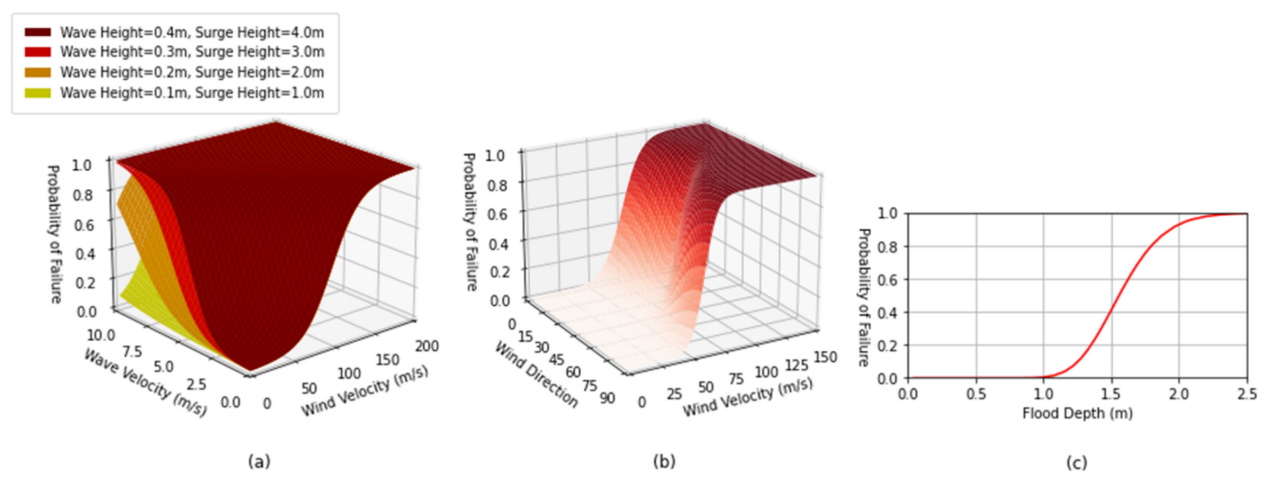
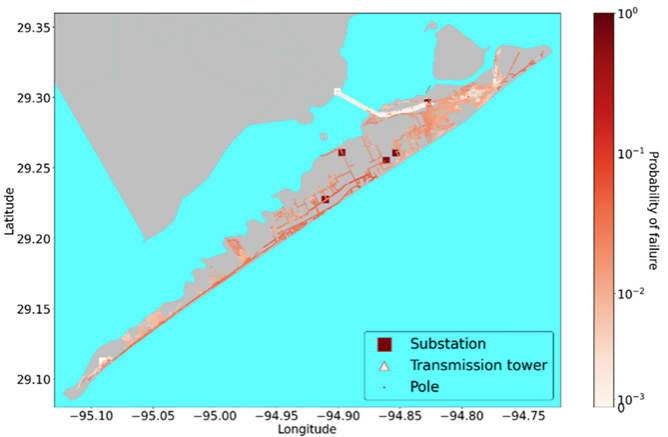
A different parametric vulnerability model has recently been put forth in the literature, with a focus on foundation pole design. The parameters of the model take into account a range of intensity measurements and pole characteristics, such as wind speed \({{V_W}}\) = 3-second gusts in meters per second), wind direction \({{\theta _W}}\) = radians, current speed \({{V_F}}\) = meters per second), surge height \({{H_S}}\) = meters, effective wave height \({{H_W}}\) = meters, pole height \({{H_P}}\) = meters, pole age \({{t_P}}\) = years, and effective area of conductor \({{A_C}}\) = square meters. Eq. (6) incorporates the vulnerability function for wooden utility poles that has been developed. For utility poles in Classes 3, 4, and 5, Table 1 presents a summary of the fracture limit states found in the literature, assuming a coefficient of rigid soil \(\alpha\) to \(\omega\). A multidimensional plot of the fragility function is shown in Figure 2(a), where the remaining parameters remain fixed but the strength measurements of \({{V_W}}\), \({{\theta _W}}\), \({{H_S}}\), and \({{H_W}}\) are varied.
\[\begin{aligned} \label{e7} P&\left( {{\rm{ Pole failure }}\mid {V_W},{\theta _W},{V_F},{H_S},{H_W},{H_P},{t_P},{A_C}} \right) = \sigma \left( {\alpha _0} + {\alpha _1}{V_W} + {\alpha _2}\left( {{H_p} – {H_S} – {H_W}} \right)\right.\notag\\&~~~~~~~~~~~~ + {\alpha _3}{V_F}{H_S} + {\alpha _4}{V_W}\sin \left( {{\theta _W}} \right) + {\alpha _5}{V_W}{A_C}\left. + {\alpha _6}\max \left( {{t_P},25} \right) + {\alpha _7}{H_W} \right), \end{aligned}\tag{7}\]
\[\label{e8} \sigma (y) = {(1 + \exp ( – y))^{ – 1}}.\tag{8}\]
Thus, for wind speed \({{V_W}}\)(m/) and direction w with respect to the conductor, where the wind loads were projected to the vertical directions 21438.0.2056.-9.5395 and 0.1235, respectively, Eq. (7) was used to calculate the probability of failure of the transmission tower. The transmission tower’s brittle surface under wind loading is depicted in Figure 2(b).
\[\label{e9} \begin{array}{l} P\left( {{\rm{ Tower failure }}\mid {V_W},{\theta _W}} \right) = 1 – \left[ {1 – \sigma \left( {{\beta _0} + {\beta _1}{V_W}\sin \left( {{\theta _W}} \right)} \right)} \right]\left[ {1 – \sigma \left( {{\beta _2} + {\beta _3}{V_W}\cos \left( {{\theta _W}} \right)} \right)} \right]. \end{array}\tag{9}\]
Substations are susceptible to flooding from hurricanes and floods, even if wind damage is less likely to affect them. The intensity metric is the flood height \(F\)(measured in meters). The vulnerability curve of a substation to flooding is depicted in Figure 2(c). Eq. (5) can be used to determine the probability of damage \({{P_L}}\) for a transmission line (such as a pole or tower) with n elements once the vulnerability functions for each element in the DT model have been obtained. Here, \({{P_i}}\) represents the probability of failure of the \(i\) element within the line. The details are shown in Table.1.
| Class | \({\alpha _0}\) | \({\alpha _1}\) | \({\alpha _2}\) | \({\alpha _3}\) | \({\alpha _4}\) | \({\alpha _5}\) | \({\alpha _6}\) | \({\alpha _7}\) |
|---|---|---|---|---|---|---|---|---|
| 3 | -7.254 | 0.0245 | 0.0514 | 0.2987 | 0.0258 | 0.00258 | 0.0268 | 0.5147 |
| 4 | -6.898 | 0.0502 | 0.3025 | 0.3047 | 0.0365 | 0.0025 | 0.0285 | 0.5328 |
| 5 | -6.878 | 0.0214 | 0.0458 | 0.3266 | 0.3325 | 0.0058 | 0.0265 | 0.598610 |
The following formulas are specifically derived:
1. Component failure probability: The failure probability of the ith component can be written as follows:
\[\label{e10} {P_i} = P\left( {{F_i} > {f_i}} \right),\tag{10}\] where \({f_i}\) is the component’s tolerance strength and \({F_i}\) is the stress intensity.
2. Transmission line overall failure probability: For transmission lines with n components, the failure probabilities of each component can be used to compute the overall failure probability, or \(\beta\).
\[\label{e11} {P_L} = 1 – \prod\limits_{i = 1}^n {\left( {1 – {P_i}} \right)}.\tag{11}\]
3. Transmission line vulnerability function: This can be stated by adding the vulnerability function \({V_i}(F)\) of each component.
\[\label{e12} {P_i} = {V_i}(F).\tag{12}\]
4. By combining the previously mentioned calculations, the likelihood of transmission line damage is finally expressed as follows:
\[\label{e13} {P_L} = 1 – \prod\limits_{i = 1}^n {\left( {1 – {V_i}(F)} \right)}.\tag{13}\]
5. Vulnerability curve: The probability distribution of system failure under various conditions can be derived by drawing vulnerability curves at different flood heights \(F\).
6. Example of calculation: Three components make up a transmission line, and their corresponding vulnerability functions are \({V_1}(F)\), \({V_2}(F)\), and \({V_3}(F)\). The total likelihood of failure \({P_L}\) is:
\[\label{e14} {P_L} = 1 – \left( {1 – {V_1}(F)} \right)\left( {1 – {V_2}(F)} \right)\left( {1 – {V_3}(F)} \right).\tag{14}\]
This method allows us to systematically evaluate how vulnerable substations and transmission lines are to storms and floods. It also offers a theoretical foundation and empirical support for the development of better disaster prevention and mitigation strategies for power systems.
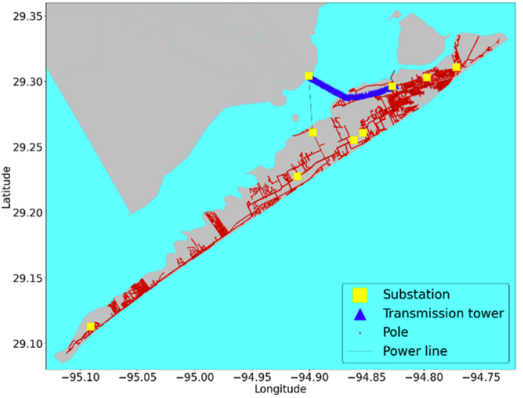
Through a case study of the Guangzhou application, the suggested Digital Twin (DT) framework’s practical application to a hurricane strike scenario is illustrated. A thorough review of the literature is done regarding the ammeters and other test instruments that are used in the community. Information in-depth about the Guangzhou electrical power network (EPN), including utility holes and transmission towers that were included in the Ike simulation data, as well as the locations, characteristics, and connections of substations.
The cleaned EPN dataset includes an inventory of 24,756 residential, 2,681 commercial, and 357 industrial structures in addition to 13,207 utility poles, 52 transmission towers, and 9 substations. The DBSCAN method divides these buildings into 2102 residential, 1108 commercial, and 248 industrial clusters. A maximum clustering distance of 40 meters was selected in order to achieve a compromise between computational efficiency (bigger clusters) and model accuracy (smaller clusters). Furthermore, the end lines (leaf nodes) of the EPN towers that were disconnected from the building clusters were removed and aggregated into straight lines. Ultimately, the DT model’s EPN is made up of 2,718 distribution lines, one transmission line, and nine substations. Figure 3 depicts the EPN’s architecture on Guangzhou Island, while Figure 4(a) and Figure 4(b) show the tabular diagrams before to and following building clustering, respectively.
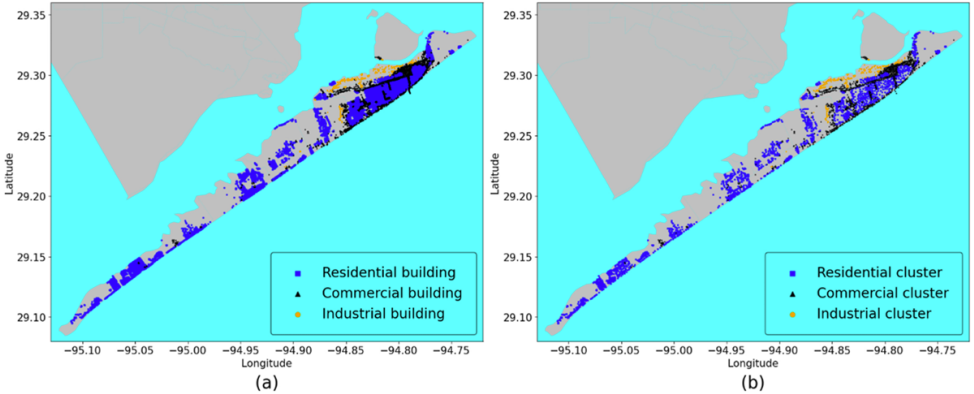
As seen in Figure 4, the vulnerability function is utilized to estimate the chance of failure. Assuming that component failures follow an independent Bernoulli distribution, the estimated number of failures for each type of component (substation, tower, or pole) is summarized to provide a fuller understanding of these estimates. The findings indicate that whereas utilities sustain significant damage and are predicted to have 211 failures, transmissions are only slightly impacted. Furthermore, since flooding affected four substations, the likelihood of failure at these substations was directly correlated with the level of the flooding. As shown in Figure 5.
Following the steps outlined in Figure 6(a), we built a Bayesian Network (BN) using 8914 EPN nodes and customized code. We then applied the Environmental Vulnerability Function (EVF) and related procedures to determine the likelihood that customers would experience an interruption in their electricity supply. According to the model’s estimation results, 96.3% of the customers’ electricity is anticipated to run out. The decision-maker can select different weights based on the land use pattern and the particular requirements of various building types. The estimated electricity consumption for residential, commercial, and industrial buildings is 96.4%, 96.0%, and 94.2%, respectively. Furthermore, since substations often require routine maintenance, decision-makers would be curious about outages that happen right away following a restoration. After the repair, this one can be calculated by updating the BN with the available data. Assuming that every substation is fixed, we modeled this situation, and the outcomes are displayed in Figure 6(b). In certain regions, the model indicates that power supply is restored once all substations have been upgraded to the “repaired” physical condition. Nonetheless, the model continues to indicate that pole failures could result in widespread outages.
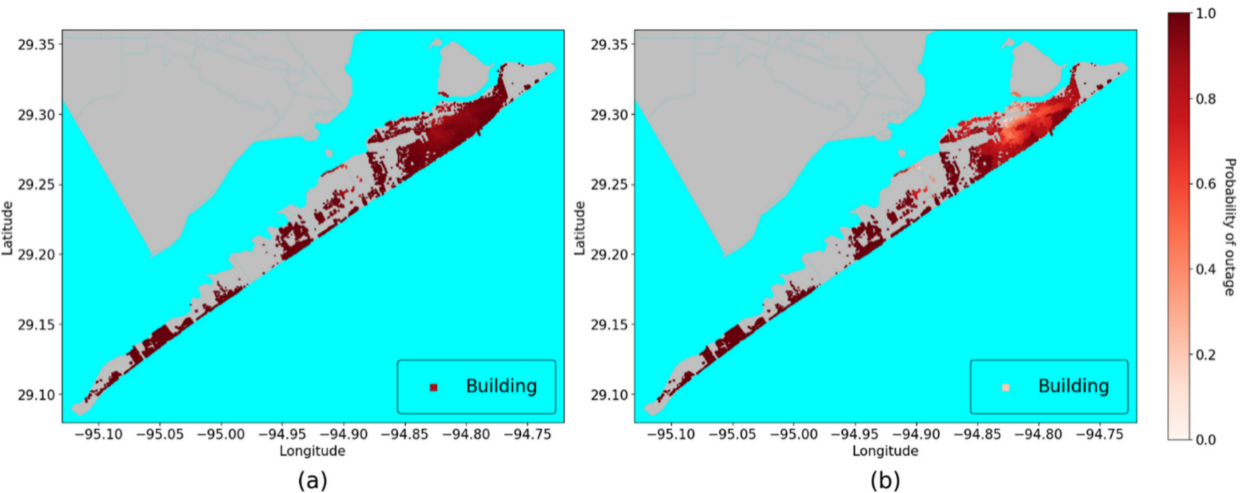
Historical data show that Hurricane Ike severely damaged 238 transmission towers, 383 substations, and 10,300 utility poles. As a result, 3.9 million consumers in nine U.S. states were left without power. However, the majority of the damaged transmission towers were located in East Texas and Louisiana, with the greater Houston area escaping unscathed. Following the hurricane, the Greater Houston area had to rebuild 8,500 utility poles as a result of damage to distribution lines and substations, which was the main cause of the outages. Guangzhou Island also had floods at four substations; three of them could be repaired in three days, but the fourth needed to be completely replaced. Guangzhou Island and the Bolivar Peninsula were completely without electricity, according to reports from the two main electric providers serving the greater Houston area the day after the hurricane. Of their customers, 99 percent were without power.The DT model forecasts practically total outages for much of the island, and its results (see Figure 6(a)) are consistent with historical data. Furthermore, the model predicts low failure probabilities for transmission towers and relatively high failure rates for utility poles and substations.
This study takes the Shouti 220 kV Forest Power Transmission and Transformation Project as the carrier, and applies and continuously improves the new mode of digital management of power grid infrastructure projects in practice, aiming to verify the feasibility and effectiveness of the above solutions.
The adage “what you see is what you get, what you get is what you build” is realized throughout the design phase. During the engineering design phase, the 2D design drawings are used as the basis for 3D design modeling of the civil and electrical specialties using Autodesk’s Revit modeling tool.
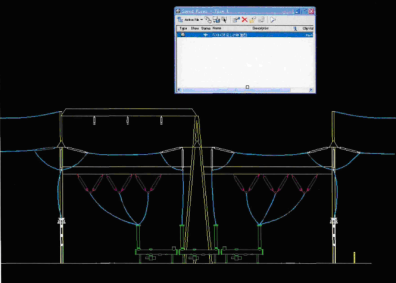
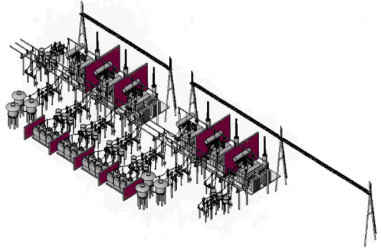
The advancement of the construction, acknowledging “where it is completed, where it is displayed”. The digital management platform associates work tasks with elements of 3D models, automatically detects whether the workflow is reasonable, and achieves dynamic progress display effects based on timelines, as shown in Figures 7, 8, and 9. This graphic and user-friendly interface enables management personnel to monitor the construction progress at any time. Each object in the 3D model corresponds to each construction entity in the construction.
Understanding that “what is set up is what is counted, and what is counted is what is paid” is the third step in progress payment administration. Every construction entity in the construction correlates to an object in the 3D model. The progress payment information can be viewed directly on the 3D model in the digital management platform by uploading project payment information, linking the task progress, and then using the association relationship between task progress and model elements to realize the association between the model and the payment. This allows the relevant personnel to use the 3D model as a reference.
Quality and safety report for management of visualization. Along with specific data or images, the safety checkpoints, inspection results, quality checkpoints, and inspection or improvement results related to the project’s construction are entered into the platform for three-dimensional visualization, enhancing the three-dimensional digital model and offering the management staff strong support for their decision-making [4].
Using a real-world case study on Guangzhou Island, this research validates a three-dimensional digital twin-based design framework for the whole substation engineering infrastructure process.Using digital twin technology for power system modeling and analysis, this study establishes a high-fidelity electric power network (EPN) model to efficiently integrate the power system’s major components: the power plant, substation, transmission system, distribution system, and customers. By building a loop-free connected directed network and using a multinomial tree structure, it is possible to maximize both computational efficiency and model accuracy, which results in an improved solution for power system design and management.
This study offers a thorough analysis of the failure probability of every component in the power system by applying the vulnerability function and Bayesian network (BN) model extensively. The findings demonstrate that there are notable distinctions in the susceptibility of poles, substations, and transmission towers to severe weather events; pole and substation failure rates are higher, whereas transmission tower failure probabilities are lower. These analysis’ findings offer a solid scientific foundation for enhancing the electricity system’s resilience.
The experimental data used to support the findings of this study are available from the corresponding author upon request.
The authors declared that they have no conflicts of interest regarding this work.