
Fine arts education is an important way to cultivate students’ aesthetic emotion, creativity and cultural literacy, and it has a far-reaching impact on the comprehensive development of individuals and the civilized progress of society. In recent years, the interdisciplinary subject of fine arts has received more and more attention. This field covers a number of disciplinary categories, including fine arts, culture, education, sociology, philosophy and so on [8, 20, 2,4]. The interdisciplinary topics of fine arts are mainly involved in the following areas: the field of education. Fine arts education is one of the important educational fields. In recent years, based on the idea of fine arts interdisciplinary, some educators have begun to explore how to combine fine arts education with other disciplines to form a more connotative interdisciplinary education model [18, 11, 14,10]. Cultural field. Art interdisciplinary involves a wide range of cultural dimensions, including not only traditional culture, but also contemporary culture. Other fields. The study of fine arts interdisciplinary is not limited to the field of education and culture. For example, some scholars have studied the relationship between fine arts and philosophy and put forward some new views on the philosophy of art, and some people have explored the connection between fine arts and sociology and analyzed the relationship between fine arts works and social groups [12,16,15, 7].
Pattern recognition is a fundamental function of the human mind that enables us to discover connections between seemingly unrelated information. This ability is particularly valuable in innovation and artistic creation. Pattern recognition in artistic creation is the process by which artists use pattern recognition to transform observations from everyday life into ideas in their work. Whether in painting, music or literature, artists are constantly searching for and creating patterns [13, 6,3, 17].
This paper analyzes the way of visual expression of art and philosophy fusion driven by big data, including digital virtual and multi-dimensional spatial expression, philosophical information interaction and dynamic presentation. A generative art-philosophy fusion visual expression system is designed using collaborative filtering recommendation algorithms, image visual enhancement techniques, and loop consistency adversarial networks. The system is equipped with a pattern recognition application based on art recommendation, which can follow the designed operation process, through data input, data visualization and coding, and output the art work that integrates fine art and philosophy.
For visual communication design, the trend of digitalization of design forms and behaviors is closely in line with the development characteristics of the information digitalization era. The digital virtualization of design forms is embodied in the dataization of all visual design images, which are processed and stored in the form of binary codes. Graphics, text, color and other visual information become data files, and their file capacity is measured in bits. Compared with the creation of traditional visual images, digital visual design is characterized by “immateriality”. The digital virtualization and immateriality of visual forms have led to a great increase in the mobility and functionality of visual information in art and philosophy.
With the development and integration of information technology, visual communication design based on visual image information transmission has undergone great changes in design forms and their creative concepts. In the information age, the visual communication design is changing from the graphic paper media form in the industrial period to the digital design form based on network information and targeting at the new media publishing platform, and interactivity is an important feature of its development nowadays.
An important feature of interactive digital media that distinguishes it from traditional media is that it dissolves the aesthetic distance between the viewer and the visual form, and interacts with the viewer in a more “affinity” posture. Therefore, the essence of digital interactive philosophy visual communication design lies in the two-way transmission of information, and the interactive experience of the information receiver and the visual form together become the most core component of the visual communication design work.
Another important influence of digital information technology on visual communication design is the development and promotion of dynamic visual forms. While the new media based on digital virtual technology is gradually popularized, the dynamic transformation of traditional static graphics has become an important feature of the transformation of visual communication design in the information age.
The user-based collaborative filtering algorithm [9,5] is divided into three main steps:
In a recommender system, \(U^{m} =\left\{u_{1} ,u_{2} ,\ldots ,u_{m} \right\}\) is generally used to denote the set of users and \(I^{n} =\left\{i_{1} ,i_{2} ,\ldots ,i_{n} \right\}\) the set of works. \(R^{mn}\) denotes a \(m\times n\)-dimensional rating matrix, where the values in row \(i\) and column \(j\) of the matrix are the ratings given by user \(u_{i}\) to work \(i_{j}\). \(r_{ij}\) The ratings may range from 1 to 10, or from 1 to 5, or other scales, depending on the actual situation. If a user has not rated a work, the corresponding matrix entry is empty.
Generally, the similarity between users is calculated based on the user-work rating matrix. The rating vector \(\left(r_{i1} ,r_{i2} ,\ldots ,r_{in} \right)\) of each user \(u_{i}\) represents the “portrait” of the user, and the proximity between users is measured by calculating the distance between the rating vectors. There are two commonly used methods to calculate similarity in recommender systems:
Given a rating matrix \(R^{mn}\), the similarity \(sim\left(a,b\right)\) of users \(a\) and \(b\) can be expressed by: \[\label{GrindEQ__1_} PCC\_ sim\left(a,b\right)=\frac{\sum\limits_{p\in P}\left(r_{a,p} -\overline{a_{a,p} }\right) \left(r_{b,p} -\overline{r_{b,p} }\right)}{\sqrt{\sum\limits_{p\in P}\left(r_{a,p} -\overline{r_{a,p} }\right)^{2} } \sqrt{\sum\limits_{p\in P}\left(r_{b,p} -\overline{r_{b,p} }\right)^{2} } },\tag{1}\] where \(P\) denotes the set of works jointly rated by users \(a\) and \(b\), and \(\overline{r_{a,p} }\) and \(\overline{r_{b,p} }\) denote the average ratings of users \(a\) and \(b\), respectively, based on the set of common works \(P\).
The cosine similarity between two users can be expressed by: \[\label{GrindEQ__2_} Cos\_ sim\left(a,b\right)=\frac{\vec{a}\cdot b}{\left|\vec{a}\right|*\left|\vec{b}\right|} ,\tag{2}\] where the symbol \(\cdot\) denotes the dot product between the vectors, \(\vec{a}\) and \(\vec{b}\) denote the rating vectors of users \(a\) and \(b\), respectively and \(\left|\vec{a}\right|\) and \(\left|\vec{b}\right|\) denote the Euclidean length of their vectors, i.e., the square root of the vector’s own hits. The formula can also be written as: \[\label{GrindEQ__3_} Cos\_ sim\left(a,b\right)=\frac{\sum\limits_{p\in P}r_{a,p} r_{b,p} }{\sqrt{\sum\limits_{p\in P}r_{a,p} p^{2} } \sqrt{\sum\limits_{p\in P}r_{b,p}^{2} } } .\tag{3}\]
The value of cosine similarity is between 0 and 1, the closer to 1 the more similar it is.
After calculating the similarity between users, the nearest neighbors of the target user are sorted according to the size of their similarity, and the first \(k\) similar user is selected to predict the unrated works. The calculation formula is as follows: \[\label{GrindEQ__4_} pre\left(a,p\right)=\bar{r}_{a} +\frac{\sum\limits_{b\in NN}sim \left(a,b\right)*\left(r_{b,p} -\overline{r_{b} }\right)}{\sum\limits_{b\in NN}sim \left(a,b\right)}.\tag{4}\]
The formula takes into account the deviation of the most similar \(k\) immediate neighbors from the average rating \(\bar{r}_{a}\) of the target user \(a\). Where \(NN\) represents the set of \(k\) neighbors that are most similar to user \(a\), and \(r_{b,p}\) and \(\overline{r_{b} }\) represent a neighbor \(b\)’s rating of the artwork \(p\) and that neighbor’s average rating, respectively.
According to the above formula the predicted ratings of the target user for the unseen artworks can be calculated, and by sorting these predicted rating values from largest to smallest, a personalized Top-N recommendation list can be generated.
This enhancement method is one of the easiest and most common basic image operations that can provide some data enhancement to image datasets. However, for image datasets with advanced semantics such as those involving numbers and text, the direct use of this method does not guarantee that the data labels remain unchanged.
In view of the digital image is usually height \(\mathrm{\times}\) width \(\mathrm{\times}\) color channel as input, data enhancement can also be transformed through the color channel to achieve the effect of enhancement. Common means of data enhancement through color transformation can be extracted R, G, B one of the color channels, an image can be quickly converted to its representation in a color channel by extracting the matrix, and from the other color channels to add two zero matrices.
Cropping an image can be used as a practical processing method where image data with different heights and widths can be processed by cropping the center region of each image. On the other hand, random cropping has some similarity to panning in its effect.
Rotation enhancement is achieved by rotating an image to the left or right on an axis between 1\(\mathrm{{}^\circ}\) and 359\(\mathrm{{}^\circ}\). The rotation parameter largely determines the effectiveness of rotation enhancement, but as the rotation angle increases, the labels of the data may not be retained after rotation.
It usually refers to moving the image in directions such as up, down, left, right, etc. This operation can effectively avoid the positional differences appearing in the image. Assuming that most of the image positions in some datasets are centered, after using these data for training, it is also necessary to try to select centered images when testing.
Noise injection refers to injecting the original image with a matrix of random values, which usually come from a Gaussian distribution. Adding noise to the image can motivate the adversarial network to learn more robust features.
Typically image data is encoded into 3 matrices, each of which has a size of length \(\mathrm{\times}\) width. Each value in these matrices represents a pixel value of an RGB color value. A quick solution for images that are too bright or too dark is to decrease or increase the pixel value by a constant value in the image. In addition to this, another quick color space operation is to splice out individual RGB color matrices or limit the pixel values to some minimum or maximum value.
Kernel filters [21] are a very popular method of image processing, these filters work by sliding an n \(\mathrm{\times}\) n matrix over the image to give a blurring or sharpening effect. The use of Gaussian blur filter makes the image blurrier and the use of high contrast vertical or horizontal filters sharpens the edges of the image.
Fundamentals of Cycle Consistent Generative Adversarial Networks (CycleGAN) []: the general underlying generative adversarial network model operates in a single direction, and generally there is also a discriminator D, generator G each. Among them, in the generative adversarial network generator G is essentially a generative network, generator G is mainly responsible for generating a into specific image based on the input random noise image z.
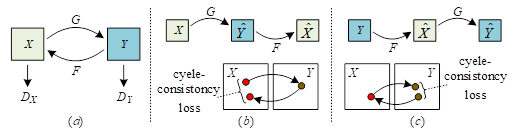
The CycleGAN network model is shown in Figure 1. Regarding the
Cyclic Consistent Adversarial Network, it is a ring network structure
consisting of two mirror-symmetric GANs. Both of the two mutually cyclic
GAN networks each possess a discriminator to discriminate the images in
their respective image domains, and these two generative adversarial
networks share two opposite generators, that is, the network contains
two generators, discriminators respectively.
The loss function of CycleGAN network model has two main components:
1) Adversarial Loss For the mapping function \(G:X\to Y\) and its corresponding discriminator \(D_{Y}\), the objective function of the adversarial loss is: \[\label{GrindEQ__5_} {L{}_{GAN} \left(G,D_{Y} ,X,Y\right)}= {E_{y\sim P_{data} \left(y\right)} \left[\log D_{Y} \left(y\right)\right]} {+E_{x\sim P_{data} \left(x\right)} \left[\log \left(1-D_{Y} \left(G\left(x\right)\right)\right)\right]} ,\tag{5}\] where, \(D_{Y}\) is the discriminator of the \(Y\) domain image, \(G\) is a generator that generates an image in domain \(Y\) using an image in domain \(X\) and \(x\) is a random image in the \(X\) domain representing the image domain.
2) Cyclic consistency loss, for the mapping function, CycleGAN sets constraints so as to ensure that the learned mapping function has cyclic consistency, i.e., for an arbitrary image \(x\) in the \(x\)-domain, it can be mapped into the original image, i.e., \(x\to G\left(x\right)\to F\left(G\left(x\right)\right)\approx x\), by using the image generation transformation loop, which is called positive cyclic consistency. Similarly, any image \(y\), \(y\to F\left(y\right)\to G\left(F\left(y\right)\right)\approx y\) in domain \(Y\), is called reverse loop consistent. This constraint process can be portrayed using the cyclic consistency loss as: \[\label{GrindEQ__6_} {L_{cyc} \left(G,F\right)} {=} {E_{x\sim P_{data} \left(x\right)} \left[\left\| F\left(G\left(x\right)\right)-x\right\| _{1} \right]} {+E_{y\sim P_{data} (y)} \left[\left\| G\left(F\left(y\right)\right)-y\right\| _{1} \right]} ,\tag{6}\] where \(F\) is the generator that generates the \(X\)-domain image with the \(Y\)-domain image, \(G\) is a generator that generates a \(Y\)-domain image from a \(X\)-domain image, \(x\) is a random image representing an image in domain \(X\) and \(y\) is an image in the input \(Y\) domain.
The overall loss function of CycleGAN is mainly the sum of the above several loss functions as shown in Eq. (7): \[\label{GrindEQ__7_} {L\left(G,F,D_{X} ,D_{Y} \right)} {=} {L_{GAN} \left(G,D_{Y} ,X,Y\right)} {+L_{GAN} \left(F,D_{X} ,Y,X\right)+\lambda L_{cyc} (G,F)} ,\tag{7}\] where \(\lambda\) is the weight used to control the relative importance of the two loss terms.
In this section, a generative visual expression system for the integration of fine arts and philosophy is designed based on the above proposed algorithm. The generative visual representation system consists of two parts: a data collection system and a visual generation system. The system is first designed and developed by designers and developers, and then deployed on a server. To be precise, it is a web-based generative visual representation system.
The data collection system has two ways of receiving data, either automatically collected by the system or provided by the user. The data collection system transmits the data to the visual generation system where the data processing is performed and finally the visual output is performed. The operational flow of the generative visual representation system is shown in Figure 2.

Data are symbols that describe and record objective things that are expressible and abstract. The input to a generative visual representation system is, by necessity, data-driven. Whether the input is a picture, video, text, or geometric figure, it is converted into a single piece of data information, which the designer has to process, calculate, recombine, and then output new data. The input data in the generative visual representation system is multidimensional, and the author first divides the data according to different perspectives and then encodes the input data visually.
The data collection system automatically collects streams of fine arts data related to philosophy from outside sources. These data are real data volumes that exist objectively. The data collected by the system can be directly related to the philosophy or indirectly related to it. These data are not directly related to the philosophy itself, but after being processed by the designer, they can also reflect the philosophy from the side.
The data collection system can also receive data provided by users. The generating system inputs data from the user to interact with the user or to personalize the visual expression for the user.
This part of the data does not exist objectively, but is subjectively set by the designer himself, and is virtual. The data itself has no meaning, but the logic between the data and the changes in the data can be interpreted through visual images to convey the corresponding philosophical connotations.
Positional data refers specifically to various coordinate data that reflect information about the position of the object to which it belongs.
Qualitative data refers to data that represent the attributes of things, such as images, text, shapes, and colors.
Quantitative data are data that reflect the quantitative characteristics of things, such as geometric quantities like length, area, volume, etc. or physical quantities like weight, speed, etc.
Timing data refers to the data reflecting the time characteristics of things, such as year, month, day, hour, minute, second and so on.
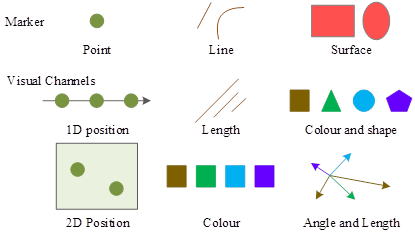
Visual coding refers to the technique of mapping data information into visual elements and consists of two aspects: graphical element markers and visual channels. Markers are usually geometric elements such as points, lines, surfaces, and bodies. Visual channels, on the other hand, are used to control the visual characteristics of markers. Generic visual channels include the position, size, shape, direction, color tone, brightness, etc. of markers.
In data-driven design, designers need to map data into appropriate markers and visual channels. Data consists of data attributes and data values, and markers reflect the mapping of data attributes to visualization elements and are used to visually represent the nature classification of data. The visual channel reflects the mapping of data values to the visual representation attributes of the markers, which are used to present quantitative information about the data attributes. The graphical markers and visual channels are shown in Figure 3.
Data-driven generative visual expression design is different from information visualization design, which emphasizes the accuracy of data presentation, and needs to help users make sense of the relationship between the data presented, highlight the contrast between the data, and then visualize the information hidden behind the data to play the role of data analysis. In generative visual expression design, the importance of data accuracy is reduced, and more emphasis is placed on the overall presentation of the data, the visual form of the combination of data, and the comparison between the data is weakened.
Refers to the case where one algorithm implementation corresponds to one generative model with a specific visual form. Under certain conditions, the algorithm has only one execution path, the same input will only be accompanied by a unique output result, each step in the algorithm is precisely defined without ambiguity, which is the determinism of the algorithm.
This refers to a basic algorithm, in the case of the basic logical framework remains unchanged, through the parameters, functions, algorithmic logic and other changes, will produce a variety of completely different results. The most widely used in visual expression design is parameterized design, in which the value of parameters can be changed to maintain the unity of the visual form while the output results are varied.
This refers to the fact that there are countless different algorithms for the same generation result. Compared with the first two emphasized forms of generation, this one highlights more the characteristics of generative visual expression design in design method.
In the training phase, the specific setup of the experiment and the parameters of the network model are as follows. Generator \(GF\) and discriminators \(D_{Y}\) and \(D_{X}\) both use the Adam optimization algorithm, where \(beta\)=(0.4,0.8). The batch is set to 0.5, the epoch value is set to 100, and the initial learning rate is set to 0.0001 for the first 50 epochs during training, and the linear decay is 0 for the last 50 epochs. The correlation weight values \(\lambda _{1} \lambda _{2} \lambda _{3}\) were set to 4, 8, and 2, respectively.The experiments were conducted under Ubuntu 18.04.1 with an Intel(R) Xeon(R) Platinum 8255C, 47 GB of RAM, and a 24GNVIDIA Ge Force RTX 3090 GPU.
Three different datasets, namely MNIST, SVHN, and Photo2vangogh datasets, are selected to evaluate the training effect of the loss function of the model in this paper on 100 epochs. The training effect of loss function based on different datasets is shown in Figure 4.
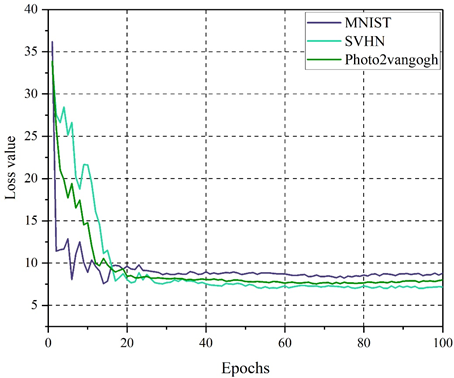
From the figure, it can be visualized that the model of this paper has a large fluctuation in the first 20 epochs on the three datasets, with an overall decreasing trend. However, the direction of the total loss function for the later 80 epochs tends to be smooth, with convergence values between 7.0 and 9.0. This indicates that the proposed model is calculated by comparing the image generated by the generator with the input image after the constraint of the associated loss function, which makes it more difficult for the discriminator to determine the authenticity of the image. The content of the image generated by the model in this paper is consistent with the input image and can reflect the visual expression effect of the fusion of aesthetic art and philosophy.
In this paper, we use two widely used evaluation metrics: average accuracy (Acc) and mean reversed rank (MRR) to evaluate the performance of fine art recommendation models based on collaborative filtering and adversarial networks.
Acc is the proportion of true samples among the predicted Top-K positive samples. In the experiments of this paper, K=\(\mathrm{\{}\)10,20,30,40,50\(\mathrm{\}}\) is used to evaluate the recommendation performance. The formula for \(Acc\) is as follows: \[\label{GrindEQ__8_} Acc=\frac{1}{\left|V\right|} \sum\limits_{v\in V}\frac{\left|S_{v}^{K} \cap S_{v}^{L} \right|}{\left|S_{v}^{L} \right|} ,\tag{8}\] where \(S_{v}^{K}\) is the set of predicted Top-K similar artworks for artwork \(v\), and \(S_{v}^{L}\) denotes the real label of artwork \(v\).
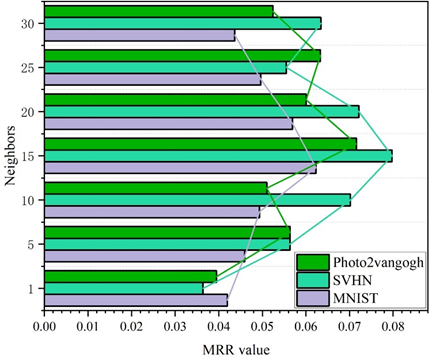
Unlike Acc which focuses on Top-K, MRR aims to measure the overall recommendation performance of the model. The formula for \(MRR\) is as follows: \[\label{GrindEQ__9_} MRR=\frac{1}{\left|V\right|} \sum\limits_{v\in V}\frac{1}{\left|S_{v}^{L} \right|} \sum\limits_{u\in S_{v}^{L} }\frac{1}{rank_{u} } ,\tag{9}\] where \(rank_{u}\) denotes the ranking of each label \(u\in S_{v}^{L}\) of artwork \(v\).
In this paper, user-based k-nearest-neighbor hyperparameter sensitivity experiments have been conducted on MNIST, SVHN, and Photo2vangogh datasets to evaluate the performance variations of the model in terms of two metrics, Acc and MRR, and the results have been analyzed accordingly in order to get the appropriate hyperparameter settings to enhance the performance of the model in this paper.
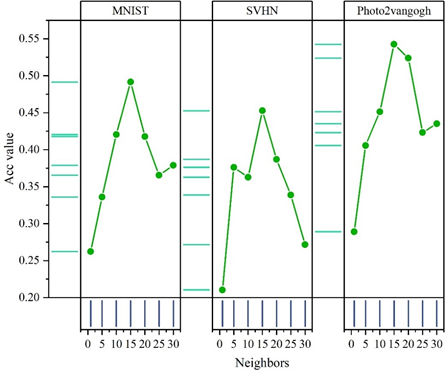
In this paper, the performance of the model on the Photo2vangogh dataset is measured in terms of two metrics, Acc and MRR, when the value of the number of users’ nearest neighbors k is set to 1, 5, 10, 15, 20, 25,30. Figures 5 and 6 show the effect of different number of neighboring points on the Acc and MRR of the model, respectively. The following two findings can be obtained from them:
As shown in Figure 5, on the three datasets, the model achieves the best performance in Acc metrics when the number of nearest neighbors k=15. While the performance is slightly worse at other number of neighbors and has the worst performance at k=1. For example, on the MNIST dataset, the model Acc values are 0.262 and 0.492 when k is 1 and 15, respectively.
From Figure 6, it can be learned that the model also achieves the best performance on the MRR metric when the number of nearest neighbors k = 15 on the MNIST, SVHN, and Photo2vangogh datasets. And far outperforms the other nearest neighbor numbers. Therefore, in this paper, ka=20 is set as the default value.
This section generates Top-5 personalized recommendation lists for five fine art creators by filtering 15 fine art philosophical fusion works from the Photo2vangogh dataset, none of which have been viewed. The fine art works include The Scream, The Tower of Babel, The Stars, The Hand Holding Up a Reflective Sphere, The Painted Hand, Sky and Water, The Theory of Relativity, The Miyagi, The Arnolfini Couple, This is Not a Pipe, Three Chairs, The Shoe, One of the Text Sketching Series, The Painted Master, and The Fuck Shang Diagrams, which are noted in order from 1-15. The ratings of the different fine art works of the five creators The results are shown in Figure 7.
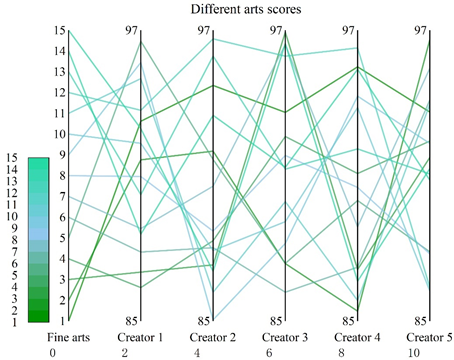
This system can predict the rating of unviewed works by the art works that users have viewed. As can be seen from the figure, for different creators, the Top-5 recommended list of art works generated by this system varies. For example, for creator 1, the Top-5 works recommended by this system are The Painted Hand, Mr. and Mrs. Arnolfini, Three Chairs, Shoes, and The Scream, with corresponding ratings of 96.55, 95.67, 95.00, 93.70, and 93.24, respectively.
In this section, we will take the visual expression system as an example to analyze its pattern recognition strategy in artistic creation, to ensure that the research is representative and at the same time ensure the feasibility and efficiency of the research argument.
This section analyzes the research on the recognition mode of visual expression system integrating art and philosophy in art creation from five dimensions: “spiritual level”, “value level”, “philosophical level”, “aesthetic level” and “technical level”. In this survey, 100 art creators were selected.
In response to the five dimensions (20 in total), respondents could choose the answer or option that suited their situation. The degree of cognition ranged from “very much in line” to “very much out of line”, with scores corresponding to 5, 4, 3, 2, and 1, respectively, and the higher the final average value, the higher the degree of agreement, and the lower the value, the lower the degree of agreement. Figure 8 demonstrates the results of the respondents’ recognition of the system of this paper for pattern recognition in art creation.
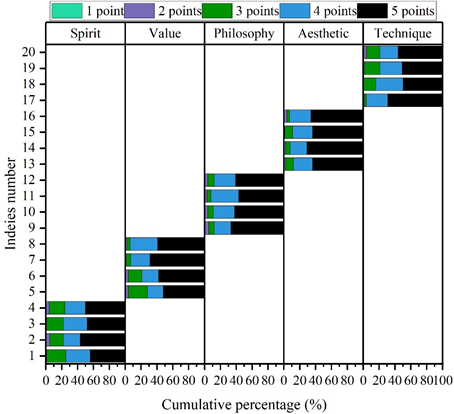
As can be seen from the figure, the visual expression system for the integration of fine arts and philosophy constructed in this paper is recognized by a wide range of respondents. The recognition of the five dimensions of “spiritual level”, “value level”, “philosophical level”, “aesthetic level” and “technical level” is distributed between 4.24\(\mathrm{\sim}\)4.55. The “philosophical dimension” and the “aesthetic dimension” were more highly recognized than the other three dimensions, with 4.47 and 4.55 respectively. It shows that the visual expression system is more than just visual imitation and reproduction, and that there is a precise identification and understanding of the deeper meaning and cultural context of the art work.
In view of the visual expression system of the integration of art and philosophy studied in this paper, the continuous creative ability of the system users and the pattern recognition effect are taken as the dependent variables, and the independent variables mainly include the “spiritual level”, “value level”, “philosophical level”, “aesthetic level” and “technical level” functions provided by the system users. The relationship between the variables was analyzed using SPSS software as a way to verify the research hypotheses based on the results of the regression analysis. The statistical results of the regression analysis of sustained creative ability and pattern recognition effect with visual expression system are shown in Table 1.
In this study, the value of tolerance and variance inflation factor (VIF) are used to carry out the discriminant metacollinearity problem, when the value of tolerance is less than 0.10 or variance inflation factor (VIF) is more than 10, it indicates that there is a multivariate covariance problem among the variables. The “spiritual level”, “value level”, “philosophical level”, “aesthetic level” and “technical level” are all less than 10, which indicates that there is no multivariate collinearity problem between the independent variables, which means that the regression analysis of its impact on the continuous creative behavior and pattern recognition effect of the system can be carried out, and the regression equation can be established.
| Variable | Independent variable | |||
|---|---|---|---|---|
| Model 1(Creative ability) | Model 2(Pattern recognition) | |||
| Correlation coefficient | VIF | Correlation coefficient | VIF | |
| Spiritual | 0.246*** | 1.75 | 0.215*** | 2.263 |
| Value | 0.232*** | 1.242 | 0.193*** | 2.061 |
| Philosophical | 0.358*** | 1.14 | 0.179*** | 1.768 |
| Aesthetic | 0.275*** | 1.651 | 0.162*** | 2.963 |
| Technical | 0.233*** | 2.014 | 0.287*** | 2.526 |
| Adjusted \(R^{2}\) | 0.261 | 0.179 | ||
| F | 23.427 | 26.351 | ||
| *** is p significant at the 0.001 level | ||||
For the effect of creative ability, as shown in Model 1, the regression coefficients between the independent variables and creative ability are all greater than 0 and pass the test of significance at the 0.001 level. The influence intensity from strong to weak was “philosophical level” (0.358), “aesthetic level” (0.275), “spiritual level” (0.246), “technical level” (0.233) and “value level” (0.232).
Second, for Model 2, the effect of the independent variables on the pattern recognition effect was analyzed. The regression coefficients between “spiritual level”, “value level”, “philosophical level”, “aesthetic level” and “technical level” and pattern recognition effect were between 0.162\(\mathrm{\sim}\)0.287, and passed the significance test of 0.001 level. It shows that when the independent variable is increased by one unit, the pattern recognition effect can be increased accordingly by 0.162\(\mathrm{\sim}\)0.287. The explanatory strength of the adjusted R-square for model 1 and 2 is 26.1% and 17.9%, respectively.
In this paper, a generative visual expression system is designed using a variety of big data algorithms and combining fine art and philosophy to fuse visual expressions. The system can realize the application of pattern recognition in art creation through artwork recommendation. A regression model is used to analyze the impact of this paper’s system on art creation.
1) When the number of neighbors is 15, the Acc and MRR metrics reach the best performance, and the Top-5 recommendation list rating of Fine Art Creator 1 is calculated to be between 93.24 and 96.55, which stimulates the user’s creativity and inspiration in art creation.
2) The system in this paper has a high recognition rate of 4.47 and 4.55 for the “philosophical level” and the “aesthetic level” of artistic creation pattern recognition, respectively.
3) The system in this paper exhibits a positive effect on both creative ability and pattern recognition at the 0.001 level, and the strength of explanation of the adjusted R-square is above 17.9%.
This work was supported by the phased achievements of the major art project: “Research on innovative Methodology of Intelligent Design in the Information Age” (No.22ZD17).