
With the acceleration of globalization and the rapid development of information technology, the employment environment faced by contemporary college students has undergone profound changes. Especially in China, the rapid economic transformation, the popularity of “Internet plus” and the continuous impact of the COVID-19 have made the employment situation of college graduates more complex and changeable [11,13]. In this context, universities, as an important component of China’s higher education system, shoulder the responsibility of cultivating high-quality talents. However, in recent years, there have been some prominent issues with the employment quality of college graduates, which have attracted widespread attention.
Firstly, the impact of multicultural trends and values has brought significant changes to the employment concepts of college students. The popularity of the Internet has brought unprecedented employment opportunities to college students, but it has also led to profound changes in their career concepts and employment perspectives [17,12]. In this era of diverse values, college students have gained a new understanding of “self-worth” and “self positioning”, leading to an increasingly common phenomenon of “slow employment”, where many students are not in a hurry to find employment but choose to postpone it or rely on recommendations from family and friends to decide on employment [6,1]. In addition, some students lack a clear understanding of career planning after employment, resulting in a high turnover rate and a state of career instability. This misunderstanding of the concept of “employment first, then career choice” further exacerbates the employment problem [16,9].
Secondly, the contradiction between the demand for a new employment environment and the employability of college students is becoming increasingly prominent. Although universities play an important guiding role in students’ career development, many current employment guidance education in universities still remains at the level of introducing employment situations and policies, lacking in-depth education on students’ career judgment, selection ability, and professional ethics [15]. The lack of such educational content makes it difficult for some college students to make reasonable judgments when facing the job market, and they are unable to effectively apply the professional knowledge they have learned to practical work, resulting in a significant decline in employment quality [5,7]. Especially for some students in universities, they lack the awareness of actively learning and exercising their personal abilities during their time in school, resulting in a mismatch between their core competitiveness in employment and practical needs, making it difficult to meet the industry’s requirements for high-end talents [14,20].
In this context, the Analytic Hierarchy Process (AHP), as an effective multi criteria decision analysis method, has shown wide potential for application in evaluating and enhancing the employment competitiveness of college students [19]. The AHP method decomposes complex problems into hierarchical levels and combines qualitative and quantitative analysis to help decision-makers obtain more reasonable decision results [2]. This article explores the impact of gender and place of origin on the employment competitiveness of college students through descriptive statistical analysis. Research has found significant differences in various dimensions of employment competitiveness among college students from different origins, indicating that regional differences have a significant impact on their employment choices and competitiveness.
The Analytic Hierarchy Process (AHP), also known as the Analytic Hierarchy Process, was a relatively practical judgment method with more than one standard found by Professor Saadi, who was renowned in the United States in the 1970s. This method conforms to both the laws of thinking and psychology. Through qualitative and quantitative analysis, more reasonable decisions are made, making the entire process more progressive and evolving.The AHP method is commonly used when it is not possible to fully quantify concepts that contain multiple elements [10]. Employment competitiveness is also a necessary quality for individuals to participate in recruitment activities for the first time, in job positions, and to change jobs [4]. And the employment competitiveness of college students refers to the proportion of those who find jobs before leaving their senior year.
In the talent exchange market and future career, being able to compare oneself with other job competitors and quickly export one’s professional skill advantages and quality abilities to work units with high quality, in order to fully maintain one’s long-term foundation [8]. Starting from computer science majors as the main body, this article explores the factors of individual employment competitiveness, decomposes various indicators for evaluating employment competitiveness, and constructs a hierarchical model of the evaluation index structure. Then, a matrix is used to determine the relative weight of each evaluator index, and the importance of employment competitiveness factors is ranked. Finally, an evaluation system is built to analyze and explore how college students can stand out from similar competitors in the job search stage.To provide strategies for computer science majors, the Analytic Hierarchy Process (AHP) is applied in the construction process of the employment competitiveness evaluation system for computer science majors. The entire process enables students to think more clearly and comprehensively about the factors and problems that currently affect their participation in the campus recruitment process [3,18]. At the same time, provide scientific advice to relevant departments of the school in guiding career planning and employment guidance for computer students.
The data were first standardized because the original data collected were not uniform in terms of units and size. The standardization formula is as follows:
For positive indicators “+”, \[\label{GrindEQ__1_} x_{ij}^{'} =(x_{ij} -x_{\min j} )/(x_{\max j} -x_{\min j} ) .\tag{1}\]
For the negative indicator “-“, \[\label{GrindEQ__2_} x_{ij}^{'} =(x_{\max j} -x_{ij} )/(x_{\max j} -x_{\min j} ) .\tag{2}\]
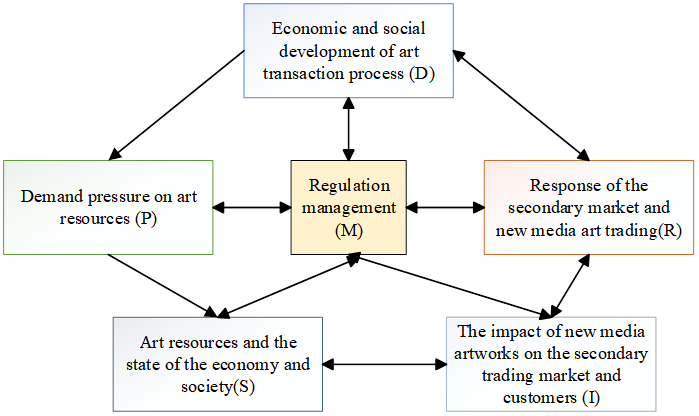
Based on the conceptual framework of the DPSIRM model, six subsystems are constructed: driver, pressure, state, impact, response and management, as shown in Figure 1. The specific meaning is: urban and economic and social development to promote the change of artworks as “D driving force” subsystem; the resulting demand and pressure of artworks as “P pressure” subsystem; facing the supply and demand of artworks to promote the economic and social development as “S state” subsystem. “The contradiction and benefit between artwork and society, nature and economy as the “I impact” subsystem; for the sake of social construction and the mitigation of the contradiction between artwork and society, nature and economy, the new media art slump management and In order to build society and alleviate the conflict between artworks and society, nature and economy, the new media art slump management and artworks space supply and demand as “R response” subsystem; strengthen the regulation of artworks through policy release as “M management” subsystem.
According to the characteristics and utilization of artworks in a city, based on the realistic development of the artwork trading market, and based on the principles of rationality, representativeness and scientificity, new media art is taken as the target layer of the evaluation index. Because of the wide range of artwork issues, and each index system should have a certain hierarchical structure. In order to integrate the challenges faced by artworks in the 21st century, the artwork index system is established with transaction volume, transaction amount and transaction price as the elemental layer of the evaluation index.
Although the subjective assignment method is easy to operate and convenient to calculate, it is influenced by external factors and has a weak scientific rigor. In order to avoid the deviation caused by subjective factors to some extent, this paper adopts the improved entropy method, which can avoid the problem of multiplicative changes between the entropy weights of different indicators due to small differences between them.
Coupling refers to the phenomenon of multiple things influencing and interacting with each other. In order to more clearly characterize whether the two are promoting each other at a high level or constraining each other at a low level, this paper chooses the T-C-D coupling coordination model for evaluation, and the specific steps are as follows.
Calculate the year-by-year composite evaluation index of the two systems according to the index weights: \[\label{GrindEQ__3_} u=\sum\limits_{i=1}^{n}(x_{ij}^{'} w_{j1} ) ,\tag{3}\] where \(u\) is the comprehensive evaluation index.
Calculate the overall comprehensive evaluation index of new media art and artwork \(T\): \[\label{GrindEQ__4_} T=\alpha u_{1} +\beta u_{2} ,\tag{4}\] where \(\alpha\) and \(\beta\) are both 0.5; \(u_{1}\) and \(u_{2}\) are the comprehensive evaluation indices of new media art and artwork, respectively.
Based on the principle that the smaller the difference coefficient between the two, the more coordinated the system relationship, the coupling degree formula is determined as: \[\label{GrindEQ__5_} C=u_{1}^{k} u_{2}^{k} /T^{2k} .\tag{5}\]
To calculate the degree of coordination of the two coupling. \[\label{GrindEQ__6_} D=\sqrt{CT} .\tag{6}\]
The coupling coordination level of the two systems is divided and classified, and the results are shown in Table 1 and Table 2.
| Coupling coordination degree \(D\) | Type | \(u_{1}\) and \(u_{2}\) of the relationship | Coordinated development type | |
|---|---|---|---|---|
| Coordinated Development | \(0.90<D\le 1.00\) | High quality coordination | \(u_{1} >u_{2}\) | Quality and coordinated development of trading market security lags |
| \(u_{1} =u_{2}\) | Quality and coordinated synchronized development | |||
| \(u_{1} <u_{2}\) | Quality coordinated development of secondary market development lags | |||
| \(0.60<D\le 0.90\) | Moderate coordination | \(u_{1} >u_{2}\) | Medium coordinated development of trading market security lags | |
| \(u_{1} =u_{2}\) | Moderately coordinated synchronous development | |||
| \(u_{1} <u_{2}\) | Medium coordinated development of secondary market development lags | |||
| Transitional Period | \(0.50<D\le 0.60\) | Barely coordinated | \(u_{1} >u_{2}\) | Barely coordinated development of trading market security lagging |
| \(u_{1} =u_{2}\) | Barely coordinated synchronous development | |||
| \(u_{1} <u_{2}\) | Barely coordinated development of secondary market development lags | |||
| \(0.40<D\le 0.50\) | Nearly dysfunctional | \(u_{1} >u_{2}\) | On the verge of dysfunctional development trading market security lags behind | |
| \(u_{1} =u_{2}\) | On the verge of dysfunctional synchronized development | |||
| \(u_{1} <u_{2}\) | Lagging secondary market development of endangered disorder development | |||
| Dysfunctional Development | \(0.25<D\le 0.40\) | Moderate disorder | \(u_{1} >u_{2}\) | Moderate dysfunctional development trading market security lagging |
| \(u_{1} =u_{2}\) | Moderately dysfunctional synchronous development | |||
| \(u_{1} <u_{2}\) | Moderate dysfunctional development lagging secondary market development | |||
| \(0.00<D\le 0.25\) | Severe Disorders | \(u_{1} >u_{2}\) | Severe dysfunctional development of trading market security lags | |
| \(u_{1} =u_{2}\) | Severe dysfunctional synchronous development | |||
| \(u_{1} <u_{2}\) | Severe dysfunctional development secondary market development process lags |
| Coordination level | Severe Disorders | Moderate disorder | Nearly dysfunctional | Barely coordinated | Moderate coordination | High quality coordination |
|---|---|---|---|---|---|---|
| Coupling coordination degree \(D\) | \(0.00<D\le 0.25\) | \(0.25<D\le 0.40\) | \(0.40<D\le 0.50\) | \(0.50<D\le 0.60\) | \(0.60<D\le 0.90\) | \(0.90<D\le 1.00\) |
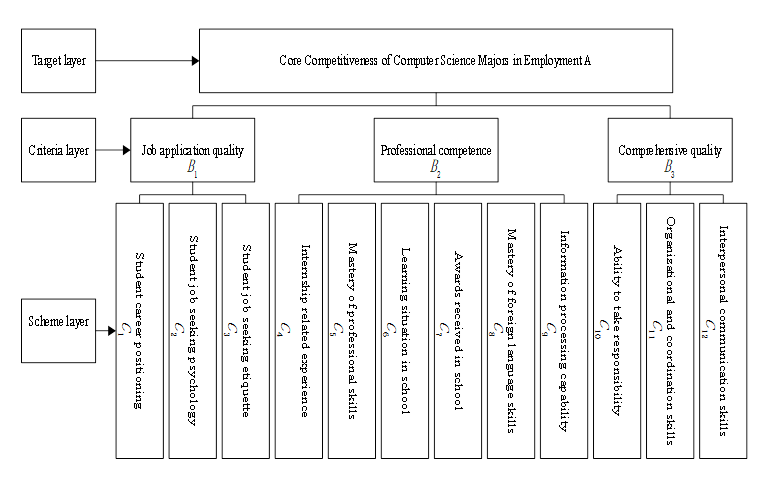
The first step is to use the Analytic Hierarchy Process to decompose the target layers of employment competitiveness for computer science majors based on in-depth investigation and research. Firstly, the decision-making objectives for the employment competitiveness of computer science majors are organized and decomposed into parts, and then these indicators are summarized according to the same attributes, in order to obtain a level of mutual matching and constraint. The second step is to divide the target level of employment competitiveness for computer science majors into three levels. The target layer only contains individual modules, often referring to the initial objects of the entire exploration and enumeration project. Next is the criterion layer, which is composed of multiple indicators that represent the intermediate steps in achieving the goal layer. The scheme layer is a detailed strategy that selects different methods or applies different approaches with the initial object as the endpoint. The elements within the same level have no similarities in meaning, and the elements between the upper and lower levels have a progressive relationship in meaning. The target layer, criterion layer, and scheme layer together constitute the evaluation index system for the employment competitiveness of computer science majors. Based on the model established in the early stage, use the previous stage module as a benchmark, compare it with various indicators in the same stage, infer its criticality, and quantify it. Based on the evaluation scale, determine the relative importance of each scheme, and finally construct judgment matrices in sequence. By calculating the eigenvalues and eigenvectors of each judgment matrix, determine the relative importance between the elements at each level, and finally perform consistency checks on them. By constructing a new feature vector, the nonlinear problem is transformed into a linear problem, and finally the clustering is carried out in the high-dimensional feature space class [5].
The improved FKCM clustering algorithm is: \[\label{GrindEQ__7_} J_{m} (U,V)=\sum\limits_{i=1}^{c}\sum\limits_{k=1}^{n}u_{ik}^{m} \left\| \phi \left(x_{k} \right)-\phi \left(v_{i} \right)\right\| ^{2} ,\tag{7}\] where \(c\) \((2 \leq c \leq n)\) is the number of clusters, \(u_{ik}\) denotes the membership degree of the \(k\)-th sample belonging to the \(i\)-th cluster, and \(x_k\) represents the \(k\)-th data sample. The mappings \(\phi(x_k)\) and \(\phi(v_i)\) represent the images of the sample and the cluster center, respectively, in the feature space \(F\). Thus, \(\left\| \phi(x_k) – \phi(v_i) \right\|^2\) is the squared distance between the sample and the cluster center in the kernel space. It can also be expressed as: \[\label{GrindEQ__8_} \left\| \phi \left(x_{k} \right)-\phi \left(v_{i} \right)\right\| ^{2} =K\left(x_{k} ,x_{k} \right)-2K\left(x_{k} ,v_{i} \right){\rm +}V ,\tag{8}\] \[\label{GrindEQ__9_} K\left(x_{i} ,y_{i} \right)=\exp \left(-\frac{\left\| x_{i} -y_{i} \right\| ^{2} }{2\sigma ^{2} } \right) ,\tag{9}\] where \(\sigma ^{2}\) is a constant. Substituting Eq. (8) into Eq. (9), we get \[\label{GrindEQ__10_} \left\| \phi \left(x_{k} \right)-\phi \left(v_{i} \right)\right\| ^{2} =2{\rm +}V-2K\left(x_{k} ,v_{i} \right) .\tag{10}\] Substitute Eq. (10) into Eq. (9) to get: \[\label{GrindEQ__11_} J_{m} (U,V)=V{\rm +}2\sum\limits_{i=1}^{c}\sum\limits_{k=1}^{n}u_{ik}^{m} \left(K\left(x_{k} ,v_{i} \right){\rm +}1\right) .\tag{11}\]
The minimum value of Eq. (8) is the optimization condition, and the corresponding sample membership function and cluster center expression can be obtained as Eq. (12) and Eq. (13) respectively: \[\label{GrindEQ__12_} u_{ik} =\frac{V+\left(1{\rm +}K\left(x_{k} ,v_{i} \right)\right)^{\frac{-1}{m-1} } }{\sum\limits_{j=1}^{c}\left(1{\rm +}K\left(x_{k} ,v_{j} \right)\right)^{\frac{1}{m-1} } } ,\tag{12}\] \[\label{GrindEQ__13_} v_{i} =\frac{\sum\limits_{k=1}^{n}u_{ik}^{m} K\left(x_{k} ,v_{i} \right)x_{k} }{\sum\limits_{k=1}^{n}u_{ik}^{m} K\left(x_{k} ,v_{i} \right)} .\tag{13}\]
Introducing the index weight coefficient into the kernel function of the FKCM clustering, the Gaussian kernel function in the algorithm is modified to: \[\label{GrindEQ__14_} K\left(x_{i} ,x_{j} \right)=\exp \left(-\frac{\sum\limits_{i=1}^{c}\left(\omega _{i} \left(x_{i} -y_{i} \right)\right)^{2} }{2\sigma ^{2} } \right) .\tag{14}\]
In order to make the evaluation index system for the core competitiveness of computer majors in employment more objective, 20 HR professionals from the computer industry were invited to construct the structural model for this category. 20 computer related employment counselors and 10 computer related graduates will jointly complete the scale of this value. Firstly, starting from the research object, 30 relevant evaluation indicators were obtained through literature review, online research, and user interviews. They were preliminarily integrated using the JK method and expert group discussions, resulting in 12 of the most representative scheme indicators. Based on the suggestions of relevant experts, a hierarchical structure model will be constructed for the listed factors, and a judgment matrix will be used to calculate the weight of each indicator. Finally, consistency testing will be conducted, and the results show that the model is valid. The evaluation of the core competitiveness of computer science majors in employment A is divided into three evaluation indicators, namely job application quality \(B_{1}\), professional quality \(B_{2}\), and ability quality \(B_{3}\). A first level evaluation indicator set A is constructed as \(\mathrm{\{}\)\(B_{1} ,B_{2} ,B_{3}\)\(\mathrm{\}}\), and a second level evaluation indicator set \(B_{1}\) is constructed as \(\mathrm{\{}\)\(C_{1} ,C_{2} ,C_{3}\)\(\mathrm{\}}\), \(B_{2}\) is \(\mathrm{\{}\)\(C_{4} ,C_{5} ,C_{6} ,C_{7} ,C_{8} ,C_{9}\)\(\mathrm{\}}\), \(B_{3}\)is \(\mathrm{\{}\)\(C_{10} ,C_{11} ,C_{12}\)\(\mathrm{\}}\). The final evaluation indicator system is shown in Figure 2.
The expert scoring method is used to confirm the weights between indicators. By constructing a comparative judgment matrix and calculating the relative weights of the judgment indicators, the importance and relative weights of factors in the scheme layer can be obtained. Obtain eigenvectors and eigenvalues through a matrix, compare level A with level B, level B with level C, and level C with level C, and perform consistency checks to calculate weights. Based on the data results, the top 5 indicators that affect target layer A are \(C_{5}\) professional skill mastery accounting for 0.245, \(C_{4}\) internship related experience accounting for 0.198, \(C_{10}\) responsibility ability accounting for 0.158, \(C_{12}\) interpersonal communication ability accounting for 0.092, and \(C_{1}\) student job positioning accounting for 0.088. From this, it can be seen that the main factors affecting the core competitiveness of computer science majors in employment are professional skills and grades, internship experience in technology companies, interpersonal communication skills, responsibility, and job positioning, providing reference and guidance for improving the employment competitiveness of computer science majors in the later stage.
Using the statistical program SPSS22.0, descriptive statistical analysis was carried out on the study’s components related to entrepreneurial education, learning motivation, learning investment, and job competitiveness, as indicated in Table 3. As seen from the perspective of the entire scale, the average scores for entrepreneurial education are 3.615, learning motivation is 3.821, learning investment is 3.798, and employment competitiveness is 3.881.The survey sample’s average values for both simulated and cognitive entrepreneurship education are over 3.64 from a variety of variable variables, and the degree of variation is likewise rather minor. The average values for feedback and practical entrepreneurship education, however, are somewhat low, suggesting that respondents are more likely to have received cognitive and simulated entrepreneurial education than they are to have received practical or feedback entrepreneurship education.The average scores of various dimensions of learning motivation are between 3.72-3.87, with the highest score being in the pursuit of ability. The average scores of various dimensions of learning engagement are between 3.76-3.84, with behavioral engagement scoring the highest; The mean values of various dimensions of employment competitiveness are between 3.84-3.94, with the highest score in metacognition and a small standard deviation.
| Variable type | Variable Name Effective | Sample size | Mean value | Standard deviation |
|---|---|---|---|---|
| Independent variable | Cognitive Entrepreneurship Education | 314 | 3.648 | 0.957 |
| Simulated Entrepreneurship Education | 314 | 3.648 | 0.957 | |
| Practical entrepreneurship education | 314 | 3.507 | 1.108 | |
| Feedback based entrepreneurship education | 314 | 3.608 | 0.999 | |
| Total amount of entrepreneurship education | 314 | 3.613 | 0.917 | |
| Mediating variable 1 | Job Interest | 314 | 3.859 | 0.713 |
| Ability pursuit | 314 | 3.866 | 0.691 | |
| Reputation acquisition | 314 | 3.720 | 0.789 | |
| Altruistic orientation | 314 | 3.818 | 0.729 | |
| Learning motivation | 314 | 3.813 | 0.678 | |
| Mediating variable 2 | Behavioral investment | 314 | 3.831 | 0.756 |
| Cognitive investment | 314 | 3.763 | 0.793 | |
| Emotional investment | 314 | 3.813 | 0.762 | |
| Total amount of learning investment table | 314 | 3.796 | 0.743 | |
| Dependent variable | Subject comprehension | 314 | 3.845 | 0.764 |
| Skill | 314 | 3.848 | 0.705 | |
| Personal qualities | 314 | 3.907 | 0.731 | |
| Metacognition | 314 | 3.932 | 0.738 | |
| Total Employment Competitiveness Table | 314 | 3.883 | 0.694 |
The data in Table 4 shows that, in terms of entrepreneurship education, males generally score higher than females, particularly in the areas of practical entrepreneurship education (T=3.292, p=0.001), feedback-based entrepreneurship education (T=2.822, p=0.006), and overall entrepreneurship education (T=2.662, p=0.009), where gender differences are statistically significant (p \(\mathrm{<}\) 0.01). This suggests that males may have a stronger engagement or recognition in practical, feedback-based, and overall entrepreneurship education compared to females. This difference may be related to gender role perceptions, socialization processes, or disparities in opportunity access.
For variables such as job interest, ability pursuit, reputation acquisition, and altruistic orientation, although males score slightly higher on average, the T-values are not statistically significant (p \(\mathrm{>}\) 0.05), indicating no meaningful gender difference. In other words, both males and females exhibit similar attitudes toward career interest, learning motivation, and behavioral investment.
Similarly, for learning engagement and employment competitiveness, no significant gender differences were found (p \(\mathrm{>}\) 0.05), suggesting that students of both genders perform similarly in terms of their engagement in learning, cognitive investment, emotional investment, and employment competitiveness.
| Test variables | Male (n=110) | Female (n=204) | T-value | Sig (Double tailed) | ||
|---|---|---|---|---|---|---|
| M | SD | M | SD | |||
| Cognitive Entrepreneurship Education | 3.8109 | 0.8510 | 3.6336 | 0.8945 | 1.707 | 0.088 |
| Simulated Entrepreneurship Education | 3.7809 | 0.8903 | 3.5733 | 0.9901 | 1.896 | 0.057 |
| Practical entrepreneurship education | 3.7659 | 0.9271 | 3.3697 | 1.1715 | 3.292** | 0.001 |
| Feedback based entrepreneurship education | 3.8136 | 0.8976 | 3.4977 | 1.0361 | 2.822** | 0.006 |
| Entrepreneurship education | 3.7926 | 0.8310 | 3.5183 | 0.9468 | 2.662** | 0.009 |
| Job Interest | 3.9046 | 0.7410 | 3.8316 | 0.7026 | 0.861 | 0.387 |
| Ability pursuit | 3.9189 | 0.7330 | 3.8352 | 0.6711 | 1.027 | 0.305 |
| Reputation acquisition | 3.8056 | 0.8175 | 3.6777 | 0.7690 | 1.372 | 0.168 |
| Altruistic orientation | 3.8692 | 0.7450 | 3.7876 | 0.7248 | 0.947 | 0.341 |
| Learning motivation | 3.8788 | 0.7169 | 3.7896 | 0.6583 | 1.111 | 0.268 |
| Behavioral investment | 3.8993 | 0.7556 | 3.7982 | 0.7526 | 1.138 | 0.255 |
| Cognitive investment | 3.8326 | 0.7907 | 3.7222 | 0.7970 | 1.177 | 0.237 |
| Emotional investment | 3.8546 | 0.7635 | 3.7877 | 0.7595 | 0.744 | 0.455 |
| Learning engagement | 3.8580 | 0.7490 | 3.7663 | 0.7370 | 1.054 | 0.292 |
| Subject comprehension | 3.8512 | 0.7888 | 3.8446 | 0.9497 | 0.074 | 0.944 |
| Skill | 3.8906 | 0.7160 | 3.8216 | 0.7035 | 0.822 | 0.415 |
| Personal qualities | 3.9620 | 0.7458 | 3.8806 | 0.7208 | 0.943 | 0.343 |
| Metacognition | 3.9777 | 0.7806 | 3.9111 | 0.7126 | 0.758 | 0.450 |
| Employment competitiveness | 3.9196 | 0.7187 | 3.8612 | 0.6846 | 0.707 | 0.477 |
Table 5 results show that there are significant differences among college students from different origins in entrepreneurship education, learning investment, and employment competitiveness; In terms of learning motivation, there are significant differences in job seeking interests, ability pursuit, and altruistic orientation among college students from different origins, while there is no significant difference in reputation acquisition level.
| Test variables | Rural areas (n=140) | City (n=174) | T-value | Sig (Double tailed) | ||
|---|---|---|---|---|---|---|
| M | SD | M | SD | |||
| Cognitive Entrepreneurship Education | 3.4965 | 0.9281 | 3.8595 | 0.8092 | -3.646*** | 0.00 |
| Simulated Entrepreneurship Education | 1.0343 | 1.0346 | 0.8735 | 0.8737 | -2.797** | 0.004 |
| Practical entrepreneurship education | 3.4777 | 3.4773 | 3.7844 | 3.7840 | -2.499* | 0.012 |
| Feedback based entrepreneurship education | 1.0343 | 1.0343 | 0.8738 | 0.8738 | -2.433* | 0.015 |
| Entrepreneurship education | 3.3380 | 3.3380 | 3.6465 | 3.6465 | -3.015** | 0.001 |
| Job Interest | 1.1336 | 1.1336 | 1.0666 | 1.0666 | -2.241* | 0.025 |
| Ability pursuit | 3.4588 | 3.4588 | 3.7320 | 3.7320 | -2.377* | 0.016 |
| Reputation acquisition | 1.0437 | 1.0437 | 0.9471 | 0.9471 | -1.956 | 0.053 |
| Altruistic orientation | 3.4425 | 3.4425 | 3.7565 | 3.7565 | -2.457* | 0.013 |
| Learning motivation | 0.9699 | 0.9699 | 0.8485 | 0.8485 | -2.444* | 0.017 |
| Behavioral investment | 3.7577 | 3.7577 | 3.9387 | 3.9387 | -3.070** | 0.003 |
| Cognitive investment | 0.7603 | 0.7603 | 0.6688 | 0.6688 | -2.826** | 0.006 |
| Emotional investment | 3.7626 | 3.7626 | 3.9478 | 3.9478 | -2.893** | 0.006 |
| Learning engagement | 0.7413 | 0.7413 | 0.6426 | 0.6426 | -3.022** | 0.005 |
| Subject comprehension | 3.6272 | 3.7272 | 3.8013 | 3.8013 | -3.423** | 0.001 |
| Skill | 0.8197 | 0.8197 | 0.7535 | 0.7535 | -2.526** | 0.011 |
| Personal qualities | 3.7023 | 3.7023 | 3.9092 | 3.9092 | -2.808* | 0.003 |
| Metacognition | 0.8208 | 0.8203 | 0.6385 | 0.6385 | -2.880* | 0.002 |
| Employment competitiveness | 3.7176 | 3.7176 | 3.9053 | 3.9053 | -3.043* | 0.001 |
This study analyzes the employment status of college students in the context of the new era, explores the multiple factors that affect their employment competitiveness, and uses AHP to construct an evaluation system for college students’ employment competitiveness. In the analysis of students, the mastery of professional skills and internship experience have been identified as the most important influencing factors, indicating that students should pay attention to the combination of theory and practice during their school years, actively participate in industry related internship activities, and enhance their competitiveness in the job market.
In the future, with the continuous changes in the socio-economic environment, how universities can further optimize their employment guidance work and enhance students’ competitiveness in employment will still be an important topic that requires in-depth research. This study provides valuable research results for universities, society, and policy makers in promoting higher education reform and optimizing employment guidance services. However, it also suggests that future research should continue to explore new influencing factors to adapt to the constantly changing demands of the job market.