
Rural revitalization, education first. With the proposal of the new development concept and the continuous promotion of rural revitalization, the balanced development and quality balance of compulsory education are increasingly concerned and valued. Rural education is an important fulcrum of rural revitalization and an important part of the new development concept, and the key lies in the development of rural compulsory education [15, 1, 9]. Compulsory rural education is a key step in rural revitalization, and compulsory rural education is the guarantee and foundation of rural talent cultivation [20, 8, 13, 22].
From the perspective of process theory, the balanced development of compulsory education consists of dynamic development stages such as balanced opportunities, balanced resources and balanced quality [2,11]. The acceptance of the “two basics” marks the initial realization of the equalization of opportunities in compulsory education in China, and also marks that China as a whole has moved from the stage of equalization of opportunities to the stage of equalization of resources. The synchronization of resource balancing and quality balancing assessment work is the actual manifestation of the uneven development of compulsory education in China [4,5, 14,19].
Wang et al. [17] pointed out that in order to solve the problem of imbalance between urban and rural educational resources teachers, it is necessary to study the effective way of balanced development of compulsory education in terms of technical support and mechanism synergy. In addition, it is also necessary to use information technology to the optimal allocation of teachers. Shang [12] pointed out that at present, the problem of uneven distribution of educational resources in China has become more and more serious, and the educational resources in the city are far richer than those in the countryside, so that the balanced development of urban and rural compulsory education has become an urgent problem to be solved. The distribution of educational resources in urban and rural areas was investigated, the reasons leading to the uneven distribution were discussed and corresponding solutions were proposed. Liang et al. [6] discussed the differences in the distribution of resources in compulsory education. Ran [10] introduced the “Study on the Balance of Educational Resource Allocation and Spatial Layout”, which studied the urban area of Xi’an City in China as the research object. Wang [16] calculated and analyzed the per capita education pointed out by Chinese students using the Dagham Gini coefficient method. Liu [7] used descriptive statistical analysis and ANOVA methods to analyze the allocation of compulsory education resources in Guangxi at the end of 2019, and explored the differences and characteristics that existed in the urban and rural education resource allocation. Zeng et al. [23] emphasize that if China wants to realize the balanced development of compulsory education between urban and rural areas, it is necessary to set up the concept of development of urban-rural economic integration.
This paper introduces the concept of spatial equilibrium into the field of education, and explores the spatial equilibrium of compulsory education from the perspectives of spatial supply and demand status, spatial location layout, and the quality of school resource allocation. On this basis, the evolutionary characteristics of spatial equilibrium pattern are accurately quantified, and the deep spatial and temporal differentiation mechanism of spatial equilibrium is excavated. From the spatial perspective, the spatial structure and spatio-temporal evolution characteristics of compulsory education resources in Chongqing are explored based on spatial indicators such as imbalance coefficients, kernel densities, Moran’s I indices, and Gini coefficients. Based on Arcgis 10.5 software combined with land use data and Poi data, urban-rural zoning is carried out in Chongqing Municipality, and then the basic data of 2013 and 2023 are spatially expressed.
Educational facilities, as an important part of public service facilities, are mainly provided by the government, with non-competitive nature of consumption and non-exclusive nature of benefit. China’s education system consists mainly of basic education, secondary education and higher education. Educational facilities are the spatial carriers of education, including kindergartens, elementary school, middle schools, universities and other educational facilities.
Based on the above analysis, considering the completeness of the research object and combining with the actual situation in Chongqing, the compulsory education facilities in this paper include two stages of elementary school and junior high school, specifically elementary school (including teaching points), junior high school, nine-year system junior high school, and complete secondary school junior high school.
Equilibrium is initially a concept in physics, which refers to an object being balanced by a force and thus reaching a relatively static state, and the concept of “equilibrium” was later introduced in the fields of economy, society, geography and cities. In urban planning, “spatial equilibrium” refers to the optimal allocation of resource supply and demand within a certain spatial range. Spatial equilibrium pays more attention to the distribution of various elements in space; at present, studies on the spatial equilibrium of facilities mainly focus on medical care, elderly care facilities, occupational and residential relations, educational facilities, parks and green spaces, and so on. Currently, the indicators for measuring the equalization of basic education facilities are mainly based on the allocation of resources such as teacher allocation, school class size allocation, area of sports grounds, investment of education funds, and the quality of education, i.e., the rate of advancement, and so on. The equalization of compulsory education facilities in this paper’s study is mainly from a spatial perspective, based on spatial indicators such as accessibility, to explore the spatial equalization of compulsory education facilities in Chongqing.
The high and balanced development of school quality requires that primary and secondary schools in the region meet the national standards in terms of school conditions, teacher staffing and external environment. And there is little difference between schools, maintaining a flush situation. However, this is an ideal state, the high and low advantages and disadvantages of the comprehensive school configuration quality score directly cause the differences in quality balance within the region.
There are many factors affecting the quality of school configuration, and to deeply investigate the obstacles to the regional quality balance of basic education, it is necessary to introduce the obstacle degree analysis model. In order to determine the main factors that cause quality imbalance, and find the main contradiction of the problem. Thus, it can be targeted to formulate corresponding measures to improve the status quo of the imbalance in the allocation of quality. In this paper, from the “imbalance coefficient”, “index deviation” and “factor contribution” 3 aspects, to determine the main factors hindering the improvement of the balance of compulsory education allocation, the imbalance coefficient the imbalance coefficient is calculated as follows: \[\label{GrindEQ__1_} M_{j} =\frac{\left(U_{j} \times V_{j} \right)}{\sum\limits_{i=1}^{n}\left(U_{j} \times V_{j} \right) } ,\tag{1}\] where, \(M_{j}\) is the degree of obstacle, \(n\) is the number of factors influencing the quality of school allocation, and \(U_{j}\) is the factor contribution. \(V_{j}\) is the indicator deviation, which represents the gap between each indicator and the overall goal of quality balance, set as the gap between the standardized value of each indicator \(Y_{ij}\) and 100%, i.e. \(V_{j} =1-Y_{ij}\). Factor contribution \(U_{j}\) represents the degree of influence of each indicator on the overall goal, i.e., the weight of each indicator in the overall goal \(W_{i}\), i.e. \(U_{j} =W_{i}\).
Chongqing Municipality is located in southwestern China, in the upper reaches of the Yangtze River, straddling the transition zone between the Tibetan Plateau and the plains of the middle and lower reaches of the Yangtze River, and bordering five provinces, namely, Hubei, Hunan, Guizhou, Sichuan, and Shaanxi, with a total area of 82,500 square kilometers, and 38 districts and counties under its jurisdiction. The locational structure of Chongqing is shown in Figure 1, spanning longitude \(105{}^\circ 10'110{}^\circ 15'\) east and latitude \(28{}^\circ 10'32{}^\circ 14'\) north, and is located in the transition zone from the Tibetan Plateau to the plains of the middle and lower reaches of the Yangtze River. Influenced by the complex geographic environment of undulating topography and mountainous and water-rich terrain, Chongqing takes the Yangtze River and the Jialing River as its main axes, and develops in groups along three parallel troughs and valleys. It presents a unique “four mountains, three valleys and two rivers” landscape cityscape and a geospatial structure of “one core, multiple centers and clusters”.

This paper mainly utilizes GIS spatial analysis to study the spatial allocation pattern of compulsory education facilities in Chongqing Municipality, and obtains intuitive knowledge of the problems in the spatial allocation of compulsory education resources in Chongqing Municipality in reality by means of field surveys and structured interviews, which are supported by the collected data. In addition, the Gini coefficient and information entropy are used to measure the level of equalization of compulsory education facilities between regions and townships in Chongqing Municipality, and to quantitatively characterize the layout of compulsory education facilities in Chongqing Municipality at different levels. Statistical analysis is further applied to study the root causes of the equalization problem of compulsory education facilities in Chongqing.
In this paper, the kernel density estimation (KDE) method is used to analyze the agglomeration and diffusion characteristics of compulsory education in Chongqing [21]. The kernel density method is based on the first law of geography, which can reflect the distance decay law of spatial diffusion of geographic phenomena. In this paper, this method presents the distribution density of primary and secondary schools in Chongqing Municipality, and visualizes and expresses the educational centers and educational weak areas in Chongqing Municipality. And through the comparison of the kernel density maps in the years before and after, it reveals the spatial agglomeration-diffusion change characteristics of the layout of primary and secondary schools in Chongqing Municipality. Its calculation formula is as follows: \[\label{GrindEQ__2_} F(x)=\frac{1}{nh^{d} } \sum\limits_{i=1}^{n}k\left(\frac{x-x_{i} }{h} \right) ,\tag{2}\] where \(F\left(x\right)\) is the estimate at \(x\) and \(k\left(x\right)\) is the kernel function. \(h\) is the threshold, \(n\) is the number of samples, \(d\) is the dimension of the data, and \(d=2\) is the most commonly used kernel density formula.
Using the kernel density estimation in the spatial analysis function of ArcGIS 10.2, the kernel density is estimated for the primary and secondary schools in Chongqing Municipality, and the larger the kernel density value of the estimated point is, the larger the estimated kernel density value around it is, so as to express the spatial agglomeration and diffusion characteristics of primary and secondary schools visually. In the kernel density analysis, in order to enhance the contrast between the years before and after, the distinction between high and low grade densities is manually categorized by fixing five interruption values.
The spatial autocorrelation model can study the clustering state of variable attributes in the spatial scope, and explore whether there is a clustered or dispersed correlation state in the regional space as a whole or locally by measuring the similarity, dissimilarity, or independent characteristics among the observations of the research object. In this paper, the global spatial autocorrelation Moran index model is used to study the compulsory education resource allocation pressure index, and after confirming its significant level of spatial autocorrelation at the district and county levels of Chongqing Municipality, the local spatial autocorrelation analytical tools (clustering and outlier models) are further used to explore the spatial clustering patterns of preschool education resource allocation pressure across Chongqing Municipality at a finer scale. Considering that there are a total of 38 data samples at the Chongqing municipal level, generally speaking, exploratory spatial analyses have relatively high statistical significance only in the case of more than 30 data samples. Therefore, this section chooses districts and counties rather than prefectures and cities as the research unit.
The C Index is the Compulsory Education Facility Resource Index, which represents the amount of per-pupil preschool facility resources in the district. The formula for its calculation is as follows: \[\label{GrindEQ__3_} K_{i} =\frac{S_{i} }{N_{i} } ,\tag{3}\] \[\label{GrindEQ__4_} C_{i} =\frac{K_{i} }{3G_{i} } ,\tag{4}\] where \(S\) represents the total number of students enrolled in compulsory education, \(N\) represents the total number of schools, \(G\) represents the average size of compulsory education (number of tracks), and \(i\) is any of the study units in the study area \(R\). The \(K\) index is an index of the average number of students per school defined by combining the supply and demand factors, which can characterize the actual pressure on the supply of compulsory education facilities in the region. The \(C\) index is based on the \(K\) index, the interference factor of the difference in the number of school tracks is taken into account, and the class size index is obtained by weighting the average size of each study unit, which can more accurately characterize the pressure on the allocation of compulsory education facilities in the region.
The formula for the global Moran index is expressed as follows [18]: \[ I=\frac{\sum {}_{i=1}^{n} 1_{j} \sum {}_{i\ne 1}^{n} w_{ij} (x_{i} -\overline{x})(x_{j} -\overline{x}) }{S^{2} \sum {}_{i=1}^{n} 1_{j} \sum {}_{i\ne 1}^{n} w_{ij} } ,\tag{5}\] \[ S= \frac{1}{n} \sum {}_{i=1}^{n} (x-\overline{x})^{2} ,\tag{6}\]\[ \label{GrindEQ__7_} \overline{x}=\frac{1}{n} \sum x _{i} . \tag{7}\]
When the result of Moran’s index ranges from [-1, 0), it represents that the study area is spatially negatively correlated and the variable is spatially dispersed. When Moran’s index is in the range of (0, 1], it represents that the study area is spatially positively correlated and the variables are spatially clustered. When the value is 0, the variables are not correlated on the spatial extent of the study. The higher the absolute value of the resultant value of the index calculation, the more significant the state of clustering or dispersion.
The formula for the localized Moran index is expressed as follows: \[\label{GrindEQ__8_} Z=(x_{i} -\overline{x})\sum\limits_{j\ne 1}^{n}w_{ij} (x_{i} -\overline{x}) .\tag{8}\]
In the formula, the meaning of the variables is the same as that of the global Moran index. The results of the local Moran index measurement can be based on the Lisa clustering diagram to identify the spatial clustering and anomaly state of the variables, with HH representing high value clustering, LL representing low value clustering, and HL and LH representing high value anomalies within the low value circle and low value anomalies within the high value circle, respectively. For spatial autocorrelation calculation, the data need to be standardized, and the spatial relationship conceptualization setup selects the face-neighborhood model with shared edges or corners.
The hotspot analysis tool is a spatial data analysis method that detects the characteristics of an attribute in the local spatial agglomeration, and is able to find the hot and cold spot areas of a variable, and determine its agglomeration or random state in the spatial distribution. In this paper, we use the hotspot analysis tool (Getis-Ord-Gi*) to conduct exploratory spatial analysis of the C-index of pressure on the allocation of compulsory education facilities in the districts and counties of Chongqing Municipality, and to find hotspots and cold spots of spatial concentration of pressure on the allocation of compulsory education facilities. The expression formula is as follows: \[\label{GrindEQ__9_} G_{i} {}^{*} ={\sum\limits_{j\ne 1}^{n}w_{ij} x_{i} \mathord{\left/ {\vphantom {\sum\limits_{j\ne 1}^{n}w_{ij} x_{i} \sum\limits_{j=1}^{n}( x_{i} )}} \right. } \sum\limits_{j=1}^{n}( x_{i} )} ,\tag{9}\] where \(w_{ij}\) is the spatial weight matrix, \(n\) is the total number of elemental points, and \(x_{j}\) is the attribute value of the research unit. Elemental points with positive and significant results belong to the hotspot area, and if the results are negative and significant, they belong to the coldspot area. When hotspot analysis is calculated, the spatial relationship conceptualization is set as a face adjacency model with shared edges or corners.
The Gini coefficient is essentially an expression of the degree of deviation of a particular attribute from the absolute fairness among samples, which can be used to characterize the spatial variability of a certain element within a region, and has been widely used to measure the unfairness of the distribution of social wealth.
In this paper, we use the Gini coefficient to conduct a comparative study of the degree of imbalance in the amount of per-pupil educational facility resources within Chongqing Municipality, respectively, to measure the gap in the development of the construction of inter-regional compulsory education facilities, and use the geometrically-defined grouping integral calculation method to solve the Gini coefficient [3]. The formula is as follows: \[ \label{GrindEQ__10_} Gini=S_{A} /(S_{A} +S_{B} ) , \tag{10}\]\[ S_{B} =(F_{i} +F_{i+1} )(R_{i+1} -R_{i} )/2 , \tag{11}\]\[ S_{A} =S_{\Delta } -S_{B} , \tag{12}\]\[ F_{i} =\frac{1}{C_{i} } , \tag{13}\] where \(F\) is the per capita educational facility resource index, \(R\) is any spatial unit (here representing any district or county in Chongqing). \(S_{\Delta }\) represents the area of the triangle enclosed by the horizontal axis of the cumulative percentage of districts and counties, the vertical axis of the cumulative percentage of the index, and the diagonal line after all spatial units are sorted in ascending order according to the \(F\) indicator variables, \(S_{B}\) represents the area of the \(B\) area enclosed by the Lorenz Curve (plotted according to the cumulative percentage of districts and counties and the cumulative percentage of the facility resource \(F\) index of Chongqing Municipality) and the horizontal and vertical axes, and \(S_{A}\) is the difference between \(S_{\Delta }\) and \(S_{B}\). Because the extreme difference in the supply of compulsory education facilities is relatively small, and also in order to pursue a higher level of equilibrium, this paper determines that a Gini value of \(\mathrm{<}\)0.02 is the absolute average, 0.02 to 0.05 is the comparative average, 0.05 to 0.1 is relatively reasonable, 0.1 to 0.15 is regarded as an excessively large gap, and a value greater than 0.2 represents a wide gap.
The basic data of this paper’s research includes four parts, and the basic data are all cropped with the overall administrative area of Chongqing Municipality as a mask, and the time scale is from 2013 to 2023, and all the data are uniformly transformed into 500m \(\mathrm{\times}\) 500m image elements. The data are as follows:
The land use data are derived from the National Earth System Science Data Platform-Southwest Mountain Subcenter, with the time scale of 2013 and 2023, spatial resolution of 50m \(\mathrm{\times}\) 50m, and extracted from the mask with the overall administrative area of Chongqing Municipality as the scope.
The 2023 Poi data were obtained by the Gaode map crawler, including 25 major categories, 261 medium categories, and 827 subcategories. The 2023 Poi data of Chongqing is around 29.5 million items. Given that the original data are tabular data, they are vectorized with the help of ArcGIS10.5 platform. 2013 Poi data are derived from historical electronic maps for subsequent calculations and operations.
Population density data is based on the LandScan global vital statistics analysis database, and then combined with statistical data for correction.
Sourced from the current year’s Chongqing Municipal Statistical Yearbook, and relevant government bulletins of districts and counties.
Using the kernel density analysis tool of ArcGIS10.5 software, we analyzed the kernel density of compulsory education resources (primary and secondary schools) in Chongqing. Figure 2 shows that the compulsory education resources of primary and secondary schools in Chongqing Municipality present the characteristics of node network structure, i.e., the spatial distribution pattern of “decentralized multi-center and scattered”, with a significant spatial structure at the edge of the center. “Multi-center” is mainly concentrated in the western part of Chongqing and around the central urban area, and sporadically scattered in counties and towns. District and county central urban areas of high nuclear density on the periphery of the compulsory education resources in the region there is a more significant siphon effect, the metropolitan area along the central city outward, primary and secondary school nuclear density value is higher, yu xi area high value is more. In comparison, the distribution density and kernel density value of elementary school is higher than that of secondary schools, and the distribution is more dense in 2013 than in 2023. The maximum value of kernel density of elementary school was 1.4842 in 2013, and it declined to 0.7821 in 2023, with a significant decrease in the density value. The trend for secondary schools is smaller, from 0.5973 to 0.5506, a decrease of only about 0.0467, indicating that in the process of consolidating schools, elementary school have been consolidated more than secondary schools, and basically the ones that have been consolidated are elementary school or rural teaching points.
According to the statistics of Chongqing Municipality, there will be a total reduction of 2,054 primary and secondary schools from 2013 to 2023, and the large reduction of primary and secondary schools leads to a decrease in the value of density, which in the short term affects the difficulty of access to compulsory education resources for students.
Based on the ArcGIS10.5 platform, the three-dimensional spatial visualization of the nuclear density sub-district counties of Chongqing Municipality in 2013 and 2022 was carried out, and the results are shown in Figure 3. Among them, the X-axis indicates the due east direction, the Y-axis indicates the due north direction, and the Z-value indicates the value of the nuclear density of rural compulsory education resources. Overall, the two-year spatial structure does not change much, with small differences in the east-west direction and a linear distribution, which is attributed to the fact that Chongqing Municipality has fewer provinces alongside in the east-west direction, and the degree of development is relatively balanced, with small differences in changes. In the north-south direction, there is an inverted “U” distribution, with peaks in the east-west direction, mainly in Yuchong, Jiangbei, Shapingba, etc., and in the north-south direction, mainly in Wanzhou, Xiushan, etc. The distribution of Chongqing’s spatial structure has not changed much in the east-west direction, with a linear distribution. From Wushan, Wuxi, Chengkou and other places to Wanzhou, Dianjiang and other places in a small increment, north-south direction in the north is stronger than the south. In recent years, Xiushan County Government focuses on building “Wuling Mountain Education Highland”, focusing on strengthening the foundation, promoting fairness, increasing vitality, improving quality, constantly optimizing the allocation of resources, constantly improving the livelihood of education, promoting the coordinated development of various types of education, the cause of education has made great progress, making it the most developed district and county in southeast Chongqing.

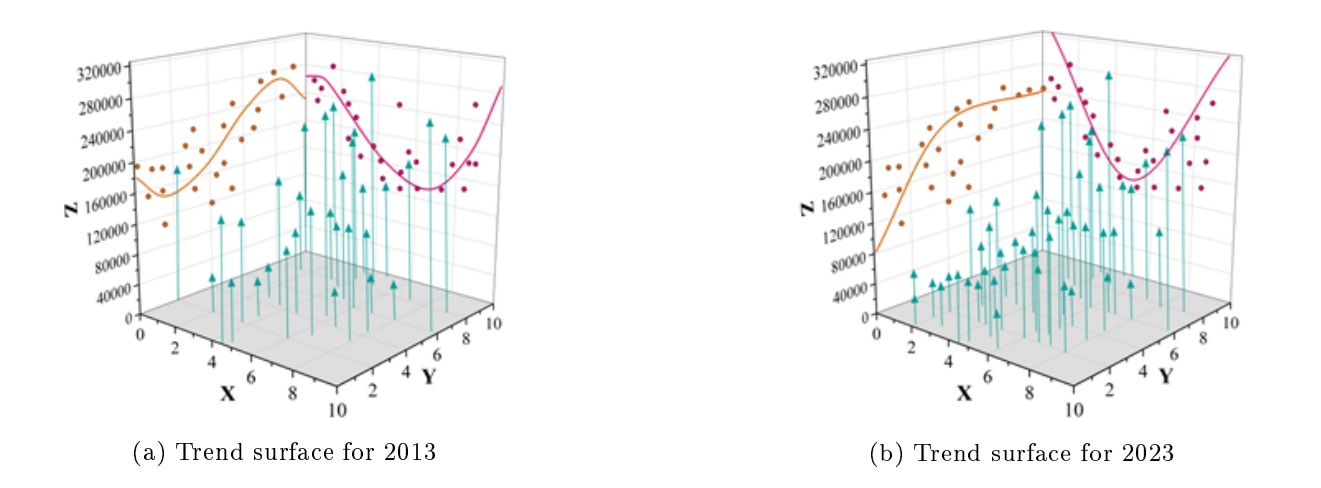
At the same time, the influence of the crisscrossing Wuling Mountains has led to a serious bifurcation of the overall situation in the south-eastern part of the region, suggesting that regional disparities in the south-eastern part of the region need to be narrowed in order to achieve relatively balanced regional development. In terms of spatial patterns, Chongqing City as a whole showed an “S” shape in the east-west direction in 2013, and then a slow rise followed by a gradual stabilization in 2023.
The 38 districts and counties under the jurisdiction of Chongqing Municipality were categorized into the metropolitan area (Area A), the northeastern Chongqing urban cluster (Area B) and the southeastern Chongqing urban cluster (Area C). Using the Gini coefficient to analyze the degree of imbalance in the amount of per-pupil educational facility resources within Chongqing Municipality, i.e., the imbalance coefficient, the results of the spatial imbalance coefficient of primary and secondary compulsory education in Chongqing Municipality in the period from 2013 to 2023 in the “one region and two clusters” are shown in Table 1.
| School | Middle school | Primary school | ||||||
|---|---|---|---|---|---|---|---|---|
| Year | Citywide | A region | B region | C region | Citywide | A region | B region | C region |
| 2013 | 0.3637 | 0.2957 | 0.3747 | 0.4208 | 0.3582 | 0.3307 | 0.2889 | 0.4550 |
| 2014 | 0.2849 | 0.2455 | 0.2603 | 0.3488 | 0.3360 | 0.3176 | 0.2389 | 0.4516 |
| 2015 | 0.2585 | 0.2426 | 0.2351 | 0.2979 | 0.3133 | 0.2929 | 0.2270 | 0.4200 |
| 2016 | 0.2087 | 0.2396 | 0.1931 | 0.1935 | 0.3046 | 0.2744 | 0.2243 | 0.4150 |
| 2017 | 0.1931 | 0.2070 | 0.1872 | 0.1851 | 0.2811 | 0.2693 | 0.2079 | 0.3662 |
| 2018 | 0.1636 | 0.2031 | 0.1153 | 0.1723 | 0.2719 | 0.2642 | 0.1997 | 0.3519 |
| 2019 | 0.1534 | 0.1889 | 0.1055 | 0.1659 | 0.2637 | 0.2522 | 0.1892 | 0.3498 |
| 2020 | 0.1312 | 0.1513 | 0.0880 | 0.1543 | 0.2495 | 0.2376 | 0.1863 | 0.3246 |
| 2021 | 0.0936 | 0.0470 | 0.0801 | 0.1537 | 0.2290 | 0.2291 | 0.1563 | 0.3016 |
| 2022 | 0.0439 | 0.0093 | 0.0652 | 0.0572 | 0.2146 | 0.2148 | 0.1293 | 0.2997 |
| 2023 | 0.0243 | 0.0043 | 0.0536 | 0.0149 | 0.1952 | 0.1900 | 0.1292 | 0.2665 |
The coefficient of imbalance in the layout of primary and secondary school resources in Chongqing decreases year by year from 2013 to 2023, and the spatial equilibrium of primary and secondary education resources increases with it. The secondary school imbalance coefficient in Chongqing was 0.3637 in 2013, decreasing to 0.0243 in 2023, with an average annual decrease of 0.0309. It means that from 2013 to 2023, the average annual increase in the spatial balance of secondary school resources in Chongqing is 0.0309, with the balance increasing over time. Similarly, the spatial imbalance coefficient for elementary school decreases from 0.3582 in 2013 to 0.1952 in 2023, with an average annual decrease of 0.0148. The above results indicate that the spatial balance of compulsory education resources in Chongqing is improving as a general trend.
The balance of compulsory education resources in all regions of Chongqing Municipality is synchronized to be better, and according to the systematic cluster analysis, the spatial allocation of compulsory education resources is classified into three grades, namely low imbalance, moderate imbalance and high imbalance.The coefficient of imbalance of secondary schools in Chongqing Municipality during the period of 2013\(\mathrm{\sim}\)2013 (0.2,0.4) is a high level of imbalance, and the coefficients of moderate imbalance during the period of 2016\(\mathrm{\sim}\)2020 with the coefficients of (0.1,0.2), and the period of 2022\(\mathrm{\sim}\)2023 is low imbalance. 2022\(\mathrm{\sim}\)2023 is a low degree of imbalance. For the elementary school stage of compulsory education in Chongqing, there is a high degree of imbalance between 2013 and 2022, and it starts to turn into a medium degree of imbalance in 2023.
Combined with the previous 2023 Chongqing Statistical Yearbook of primary and secondary schools information, 2023 Chongqing satellite images, 38 districts and counties location and area, the specific location of primary and secondary schools in the region, as well as ArcGIS10.5 to draw the distribution of primary and secondary schools in Chongqing City visualization graphics. It is found that the compulsory education resources in Chongqing Municipality are clustered to the metropolitan area, and the distribution of compulsory education resources in the main city is dense. Secondly, the service radius of primary and secondary schools in metropolitan areas overlap more. The following is a spatio-temporal trend analysis of the coefficient of variation (CV) of compulsory education in “one district and two clusters” in Chongqing between 2013 and 2023, and the results of the CV are shown in Table 2.
| School | A region | B region | C region | |||
|---|---|---|---|---|---|---|
| Year | Middle school | Primary school | Middle school | Primary school | Middle school | Primary school |
| 2013 | 0.0612 | 0.3859 | 0.0421 | 0.2085 | 0.0205 | 0.2564 |
| 2014 | 0.1640 | 0.3788 | 0.1290 | 0.2298 | 0.0607 | 0.7605 |
| 2015 | 0.1486 | 0.3999 | 0.2549 | 0.3437 | 0.3400 | 0.7690 |
| 2016 | 0.2083 | 0.4758 | 0.2907 | 0.4268 | 0.4277 | 0.6656 |
| 2017 | 0.2316 | 0.5575 | 0.4053 | 0.4049 | 0.6053 | 0.5169 |
| 2018 | 0.2638 | 0.5081 | 0.5128 | 0.4352 | 0.6406 | 0.4453 |
| 2019 | 0.3375 | 0.5304 | 0.5743 | 0.5410 | 0.7465 | 0.2809 |
| 2020 | 0.4740 | 0.5754 | 0.6234 | 0.6657 | 0.7134 | 0.7861 |
| 2021 | 0.5776 | 0.6711 | 0.6959 | 0.8647 | 0.7481 | 0.4048 |
| 2022 | 0.6436 | 0.7158 | 0.7773 | 0.3993 | 0.6186 | 0.9710 |
| 2023 | 0.6901 | 0.8039 | 1.4482 | 1.1994 | 0.8133 | 1.3005 |
It can be seen that the coefficient of variation of compulsory education in each region of Chongqing Municipality during the period from 2013 to 2023 is oscillating, but the overall trend is increasing. Meanwhile, the results of the extreme deviation, standard deviation, coefficient of variation and Gini coefficient of the coefficient of imbalance of compulsory education resources in Chongqing Municipality are shown in Table 3. It can be seen that the imbalance coefficient of compulsory education resources space in Chongqing Municipality, and its standard deviation change trend is not stable, showing an oscillating forward state. The Gini coefficient of compulsory education also maintains between 0.2 and 0.4, and does not show a significant downward trend. The unbalanced trend of the city’s spatial equalization degree of compulsory education is expanding, which also puts forward higher balanced requirements for the spatial allocation of compulsory education resources in the next period.
| School | Middle school | Primary school | ||||||
|---|---|---|---|---|---|---|---|---|
| Year | Imbalance value | SD | Coefficient variation | Gini | Imbalance value | SD | Coefficient variation | Gini |
| 2013 | 0.2263 | 0.0534 | 0.0413 | 0.3256 | 0.1729 | 0.0416 | 0.2836 | 0.3302 |
| 2014 | 0.2193 | 0.1291 | 0.1179 | 0.2730 | 0.2606 | 0.0862 | 0.4564 | 0.3126 |
| 2015 | 0.3402 | 0.0922 | 0.2478 | 0.3113 | 0.2640 | 0.0017 | 0.5042 | 0.3102 |
| 2016 | 0.2284 | 0.1269 | 0.3089 | 0.2197 | 0.2602 | 0.0965 | 0.5227 | 0.2764 |
| 2017 | 0.2337 | 0.1811 | 0.4141 | 0.3358 | 0.2062 | 0.0906 | 0.4931 | 0.2597 |
| 2018 | 0.2687 | 0.1431 | 0.4724 | 0.2049 | 0.2275 | 0.1361 | 0.4629 | 0.2115 |
| 2019 | 0.2202 | 0.1278 | 0.5528 | 0.2608 | 0.2312 | 0.1552 | 0.4508 | 0.2235 |
| 2020 | 0.2442 | 0.0664 | 0.6036 | 0.2479 | 0.2777 | 0.0626 | 0.6757 | 0.2652 |
| 2021 | 0.3396 | 0.0724 | 0.6739 | 0.2553 | 0.3333 | 0.1202 | 0.6469 | 0.3263 |
| 2022 | 0.2755 | 0.1039 | 0.6798 | 0.2974 | 0.2710 | 0.0597 | 0.6954 | 0.2835 |
| 2023 | 0.3496 | 0.1214 | 0.9839 | 0.2816 | 0.3894 | 0.0991 | 1.1013 | 0.2650 |
For the global Moran index, the existence of spatial autocorrelation across all study areas can be tested with the standardized statistic Z. This part focuses on the global autocorrelation analysis of the spatial imbalance coefficient of compulsory education resources in Chongqing Municipality, the core of which is to recognize the spatial dependence of compulsory education resources in Chongqing Municipality.
| Year | Moran’s I | z-value | p-value |
|---|---|---|---|
| 2013 | 0.502611 | 6.612637 | 0.000000 |
| 2014 | 0.502157 | 6.610101 | 0.000000 |
| 2015 | 0.503140 | 6.613386 | 0.000000 |
| 2016 | 0.503407 | 6.611932 | 0.000000 |
| 2017 | 0.503187 | 6.613030 | 0.000000 |
| 2018 | 0.501911 | 6.613169 | 0.000000 |
| 2019 | 0.502226 | 6.612607 | 0.000000 |
| 2020 | 0.503053 | 6.613247 | 0.000000 |
| 2021 | 0.502467 | 6.612826 | 0.000000 |
| 2022 | 0.502946 | 6.613054 | 0.000000 |
| 2023 | 0.503124 | 6.612574 | 0.000000 |
Table 4 shows the Moran’s I index of compulsory education resources in Chongqing Municipality from 2013 to 2023, and its significance value. It can be seen that the compulsory education resources of Chongqing Municipality in the period of 2013\(\mathrm{\sim}\)2023 presents a spatial clustering phenomenon. All global Moran’s I indices are greater than 0, indicating that the spatial distribution of compulsory education resources in Chongqing is not random, but presents a positive correlation across the whole area, with similar levels of areas clustered together, and there is spatial dependence and spatial agglomeration phenomenon.
The Moran’s I index of Chongqing’s compulsory education resources in 2013 is 0.502611, and the Moran’s I index in 2023 is 0.503124.On the whole, between 2013 and 2023, the Moran ’s I are all positive. And all the P values are less than 0.01, and all of them pass the significance test. It is further verified that there is a positive spatial autocorrelation in the pattern of compulsory education resources in Chongqing Municipality during the study period, presenting the phenomenon of spatial clustering with spatial high or low values.
The study utilizes exploratory spatio-temporal data analysis, GIS analysis and other methods to analyze the spatio-temporal evolution and spatio-temporal trends of the balance of compulsory education resources in rural areas of Chongqing. Finally, the differences from 2013 to 2023 are compared, and different development regions are identified using cluster analysis and other methods. The conclusions are:
1) Compulsory education resources in rural areas of Chongqing Municipality in “one district and two clusters” have increased in spatial equalization from 2013 to 2023, and the overall level of accessibility in the western part of Chongqing is higher than that in the northeastern part and the southeastern part of Chongqing. However, the standard deviation gradually grows, and compulsory education resources become more varied within the region as they develop.
2) The balance of compulsory education resources in rural areas of Chongqing Municipality has a clear correlation and agglomeration in geographic space, and the results of Moran’s I index show that the balance of compulsory education resources in rural areas of Chongqing Municipality has a certain degree of stability in the local area, and the regional spatial structure fluctuates weakly, with relatively high path-locking characteristics.
Hence, to promote the spatial balanced layout of compulsory education resources and to improve the spatial balanced development of compulsory education resources, it is necessary to start from the concept of development ideology, policy objectives, spatial governance capacity and rational demand concept. It is necessary to have both the pursuit of spatial balanced development and tolerance for spatial imbalance. It is necessary to focus on the static layout results at the point in time and to see the dynamic development process in the time sequence in order to realize the goal of spatially balanced development of compulsory education resources.
This research was supported by the Youth Project of the Science and Technology Research Program of Chongqing Municipal Education Commission in 2024 (Grant No. KJQN202406203).