Users may receive personalised information services and decision support from personalised recommendations. In this paper, a hybrid algorithm-based personalised recommendation approach for learning English is proposed. The user model is created by merging user interest tags, and the Person Rank algorithm is then recommended based on user information. Second, the question-and-answer model is created once the question-and-answer data has been labelled, and the Problem Rank algorithm is suggested in accordance with the question-and-answer data. Then, the approach of tag-based recommendation, comparable user recommendation, and multi-dimensional sliding window are used to construct the recommendation algorithm model. The experimental findings demonstrate that, following the model’s training with the gradient descent technique, the recommendation accuracy is steady at around 0.78, the suggested information can accommodate users who are learning English, and the personalised recommendation effect is enhanced.
There are currently numerous studies undertaken both domestically and internationally that characterise participants’ learning behaviours, and there are certain restrictions on the choice of study subjects and samples. However, numerous studies on online learners’ behaviours have been carried out with the assistance of researchers [1]. In on-line English-Chinese translation courses, the amount of user learning behaviour and reflective learning was investigated [2]. The relationship between various levels of prior knowledge and students’ online learning behaviour has been investigated in this research. It has been investigated how learners’ online learning behaviours relate to various levels of prior knowledge [3]. Some academics presented their own theories regarding analysis methodologies and the creation of analysis models [4].
The majority of the research on learning analysis technology is based on literature research questionnaires and is still in the early stages of investigation. The domestic online learning analysis technology primarily researches theories, concepts, and influencing elements. There aren’t many empirical research on data analysis using on-line English-Chinese translation courses platforms, the data mining and data gathering are shallow, and there isn’t any good visual analysis of the data, which is bad for finding hidden information [5]. Therefore, the relationship between online learning behavior and students’ offline performance, as well as effective learning guidance methods, deserve special attention. This paper focuses on the following three research issues.
If we utilise online learning behaviour to forecast how well a person will perform offline, we can objectively assess a person’s learning effect. Analyse the regularity of your online learning behaviour and whether it is a factor in your performance [6, 7]. Determine how different learner personalities affect their online learning behaviours, then suggest suitable online learning strategies for each personality type.
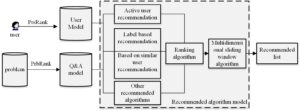
Figure 1 illustrates the three main components of the personalised on-line English-Chinese translation courses recommendation model for learning English: the user model, the question-answer model, and the recommendation algorithm model. Person Rank (PrsRank), an iterative method, is suggested to develop a user model with its interest tag in accordance with user input for English language learners [8, 9]. A Problem Rank (PrbRank) algorithm is suggested based on the question-and-answer data, and the question-and-answer model is built after labelling the question-and-answer data. Then, the ranking algorithm is constructed by using tag-based recommendation, similar users and other recommendation methods, and the recommendation algorithm model is constructed by combining multi-dimensional sliding windows in stages to finally obtain the recommendation information list.

Build a user model by analysing the on-line English-Chinese translation courses learning webpage and user characteristics, collecting user IDs, follower and followed-by counts, questions answered, consent counts, thanks received, attention tags, and other data. The question-answering model is created by gathering data on the question’s time, the number of liked questions, the number of answers, the question’s title, its tag, etc. We eventually collected 26000 English learning users, 4.61 million following links, and 720000 question data after processing noise data [10].
As an online question and answer platform, English learning can reflect user activity in question and answer. The analysis of the experimental data set shows that most users do not participate in question-and-answer interaction, that is, the overall user activity of English learning is low and shows a long tail effect, as shown in Table 1.
| Didn’t answer any questions | 21913 | 83.77% |
|---|---|---|
| Agreed and concerned | 2373 | 7.12% |
| Agreed, no concern | 432 | 1.66% |
| No approval and concern | 864 | 3.65% |
| No approval or concern | 1863 | 3.83% |
The attention relationships between users on the English learning platform, which has a social component, make up the points and edges of the graph’s structure. According to Table 1, 16.24% of users are in charge of resolving issues related to English language acquisition, and only a small portion of answers are approved. Up to 83.77% of users have not responded to queries. As a result, the study map’s active user group can increase overall English learning user activity [11, 12].
For active users, take users with more than 10000 (Net10k, 1885 people) and more than 50000 (Net50k, 395 people) to quantify the characteristics of active groups in English learning. The graph density indicates the tightness of the graph structure, which can reflect the degree of association between users. The calculated density of Net10k and Net50k graphs are 0.064 and 0.195, respectively, indicating that users with more approval are more closely concerned.
A strongly linked graph can be used to represent the relationship between English learning users, and the strongly connected components can be used to effectively represent the interaction between groups. The findings demonstrate how a close-knit social circle is formed when active users from many fields congregate in one place. Therefore, increasing the influence of active users and widening their social circle will help to increase the overall activity of English learning users. The overall user activity can be significantly increased by promoting active users to inactive users by determining the average path length, radius, and diameter of the strongly connected graph, as shown in Table 2.
| Data | Net10k | Net50k |
|---|---|---|
| Number of points | 1859 | 379 |
| Average path length | 2.12 | 1.86 |
| radius | 3 | 3 |
| diameter | 6 | 5 |
To calculate the English learning user ranking (PrsRank), After the
principal component analysis, the number of users following
The PageRank ranking algorithm is introduced in combination with the
strong connectivity among English learning users, that is, the user’s
own ranking is determined by the follower’s ranking. English learning
users have relatively complex concerns [13]. The strong connected graph contains some
isolated points (points with an outgoing chain of 0), that is, user
The initial user ranking is obtained from Eq. (1), and the final
user ranking is obtained after the iteration of Eq. (2). PageRank
(
The ranking of users and questions is dynamic due to variables like
the quantity of liked messages, the quantity of forwarded messages, and
the passage of time. Every piece of recommendation information, both
label-based and comparable user-based recommendations, is fundamentally
unique. In order to preserve the ideal value within the interval,
multi-dimensional sliding windows are employed for suggestion
information. Determine users’ satisfaction with different recommendation
methods
Although there are minor variations, the preprocessing approach for English text is largely the same as that for Chinese text. First, although Chinese text mining preprocessing involves word segmentation, English text mining preprocessing typically does not (unless there are unique requirements). Second, since the majority of English texts are encoded using UFT-8, most processing does not need to take the issue of encoding conversion into account. The issue of Unicode encoding for Chinese texts needs to be solved. In actuality, English text preparation has its own unique characteristics, and then there is the spelling issue. Spelling checks, such as “Hello Word” errors, should typically be part of the preprocessing of English text because they cannot be left for repair after analysis. In order to prepare for pretreatment, this must be fixed. Lemmatization and stem extraction are the more crucial concepts. This step is necessary since English has multiple tenses, as well as the singular, plural, and singular and plural forms of the same word. As an illustration, the words “countries” and “country” and “wolf” and “wolves” are the same [14].
The user’s behaviour with picture books in the picture book reading recommendation system shows the user’s varied tastes for various kinds of picture books. In the form of logs, the data corresponding to user behaviour will be kept in the database or system file in the background of the system. It is required to retrieve pertinent logs, identify the user’s interest in various picture books in light of the user’s varied behaviour, and then provide appropriate recommendations in order to monitor the user’s behaviour within the system. Table 3 displays the user behaviour weight for the picture book reading recommendation system.
| User behavior | field | Behavior weight | Behavior description |
| Points exchange picture book | user exchange | 1 | The user exchanged the picture book |
| Downloading picture books | user downloa | 0.8 | The user downloaded the picture book |
| Collection | user collect | 0.7 | Users collected picture books |
| share | user share | 0.6 | The user shared the picture book |
| Phonetic Follow up | user voice read | 0.5 | The user followed the picture book |
| Read carefully | user read c | 0.9 | Users are interested in picture books |
| Normal reading | user read n | 0.6 | Medium user interest in picture books |
| Fast reading | user read f | 0.3 | Low user interest in picture books |
Overall, show behaviour and implicit behaviour can be used to categorise user behaviour in the picture book reading recommendation system. When reading picture books, users’ display behaviour, such as point exchange for picture books, collection, sharing, voice following, and other behaviours, can be seen as a clear expression of their reading preferences; The implicit behaviour of users, such as reading behaviour [15], can be characterised as behaviour in which users do not overtly and directly indicate their reading preferences. The implicit user behaviour is typically not properly analysed in the majority of the historical personalised recommendation systems, which prevents accurate interest mining. In fact, if users’ implicit behaviour can be broken down in depth, it will be quite helpful in identifying their true reading preferences. The user’s interest in picture books cannot be effectively assessed in the picture book reading suggestion system based solely on the user’s simple reading behaviour, but it may be determined from the user’s reading pace of picture books. When a person reads picture books, their various reading moods reflect the variety of reading interests they have [16].
The user’s reading status can be roughly divided into fast reading, normal reading and serious reading according to the user’s reading speed. Because everyone’s cognitive level and reading habits are different, and the reading speed of users will also vary greatly, it is necessary to consider the average reading speed of users and the average length of picture books. The relative reading speed Rate (t) of picture books is defined as follows, as shown in Eq. (4):
| Relative reading speed | Corresponding reading status | ||
|---|---|---|---|
| Rate(t) |
Fast reading | ||
| 70% |
Normal reading | ||
| Rate(t) |
Read carefully |
This section will assess the picture book text classification model, the process for creating picture book recommendations, and the overall effectiveness of the picture book recommendation system from the viewpoint of recommendation performance. It will also analyse the rationality and efficacy of the picture book reading recommendation system. It will also evaluate the conventional recommendation algorithm based on association rules in addition to the Ebbinghaus Forgetting Curve-based recommendation algorithm suggested in this research. Get the experimental results and accompanying analysis by experimenting with and contrasting the various CF recommendation algorithms based on users [17].
The performance evaluation indicators in the general recommendation system mainly include three types, namely, accuracy, recall and F-Measure. These three indicators are described in detail below:
The accuracy rate is typically used in the recommendation system to measure the recommended user’s interest in the content in the recommendation list because the picture book content in the user’s reading recommendation list generated by the system does not entirely meet the user’s reading preferences. Using the picture book recommendation system in this study as an example,as shown in Table 5 the picture book recommendation results have four potential outcomes if the picture book users have never used it or contributed it to the system: 1, does the picture book simply match the user’s reading habits while the system recommends it? 2, The system suggests it but the picture book does not match the user’s reading preferences; 3, The system does not recommend it and the picture book simply matches the user’s reading preferences; and 4, The system does not recommend it and the picture book simply does not match the user’s reading preferences. Table5 displays the reader’s preferred picture books [18].
| User reading preferences | System recommendation | System not recommended |
|---|---|---|
| Like reading | true positives(tp) | false positives(fp) |
| Don’t like reading | false negatives(fn) | true negatives(tn) |
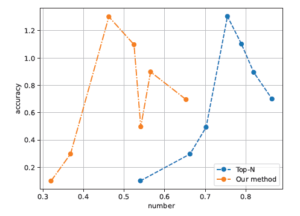
The user-based CF recommendation algorithm matches the recommendation results according to their own optimal recommendation proportion and the proportion of interest in the category of picture books. The generation of picture book recommendations is based on the strongest association rules of picture book reading recommendation obtained by using the association rule-based recommendation algorithm. For recommendations, a few picture books that most closely match the user’s reading preferences are chosen. The experimental findings are given in Figure 2. The entire recommendation process involves calculating the proportion of interest in various picture books, the calculation of recommendation algorithms based on association rules, redundant deletion, and filtering of picture books, among other steps [19].

As observed in Figure 2, the suggested generation method of picture books put out in this research is more expressive in terms of recommendation accuracy than the conventional Top-N method.
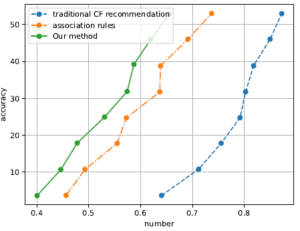
This section primarily tests and evaluates the overall effectiveness of the entire picture book reading recommendation system. The traditional recommendation method and the recommended method designed in this paper are selected for analysis and comparison in this experiment because the Ebbinghaus forgetting curve-based recommendation scheme adopted by this system is improved based on the traditional CF recommendation algorithm based on association rules and users. Traditional recommendation methods are mainly traditional association rule-based and user-based CF recommendation algorithms [20]. Figure 3 displays the F-Measure comparison results.

The F-Measure of each suggested strategy will gradually rise as the number of picture books rises, as seen in Figure 3. However, compared to the two conventional recommendation methods discussed above, the F-Measure of the recommendation system provided in this study is significantly greater. The recommendation approach suggested in this study takes advantage of some of its benefits while avoiding some of its drawbacks.
This work develops a manual annotation experiment, specifically examining the three dimensions of relevance, diversity, and surprise, to confirm the efficacy of the proposed algorithm (CDM) in the job of English learning complementarity discovery. Complementary product discovery based on simultaneous buy frequency (norm prob) and complementary product discovery based on simultaneous purchase condition probability (cooccur) are the two comparison approaches, respectively. In the experiment, we first compute the complementarities between English learning using three ways (including CDM), and then we select the top 150 English learning with the highest complementarities from each approach, combining them into a list of 450 English learning pairs. After the sample was randomised, we gathered five participants to respond to four questions for each English-learning pair in order to assess the complementarities. A score of 1 indicates agreement, while a score of 0 indicates disagreement [21, 22].
The issues are as follows: (1) I might purchase English Learning A
and B at the same time; (2) I frequently use or consume English Learning
A and B at the same time; (3) English Learning A and B are very
different from one another; and (4) The collocation of English Learning
A and English Learning B was unexpected, but I thought it was quite
appropriate. The Kappa coefficient for the final experimental annotation
result was

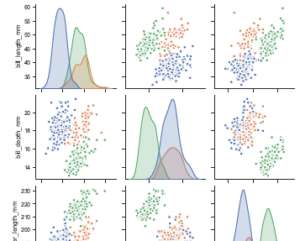
The results in Figure 4 demonstrate that, in comparison to the method based on norm prob and cooccur, the complementary discovery algorithm CDM introduced in this paper has greatly improved the relevance, diversity, and surprise of English learning. The significant improvement of the approach in questions 1 and 2 demonstrates that the suggested method is capable of finding complements with functional complements that are more in line with the concept of economics as well as complements with simultaneous purchase characteristics. This indicates that the method in this paper has a higher probability of finding different kinds of complements (such as different brands/types) and is closer to the actual situation of complements [23].
In terms of English learning diversity, CDM has achieved nearly 50% improvement in question 3 (compared with the second highest method). Additionally, CDM’s performance on question 4 demonstrates that the approach used in this paper can find more varied complements, and the addition of English instruction also gives users a feeling of being new and reasonable. For instance, CDM can locate (hotpot components, mutton), (Coca Cola, Sprite) based on the frequency of spot buy, and (Cappuccino, Latte) based on the probability of purchase conditions. These three approaches are utilised to find the top 10 complements. There is no doubt that the English-learning pairs discovered using this method are more in line with the complements of users in the hotpot scenario. The English learning pairings found in the other two techniques, however, are in a different category and are more similar to the link between substitutes.
A new area of research focuses on how to employ data mining technologies to examine the accumulated huge data to offer services for teaching decision-making and learning optimisation. This study explores the relationship between learner personality traits and learning effectiveness and realises personalised learning technique recommendations. It also analyses the behaviour features of online learning. The actual entropy value that corresponds to each learner’s online learning behaviour is defined and computed in order to assess the regularity of each learner’s behaviour and examine the connection between regularity and final score.
This work was supported by 1)Program for the First-Class Courses Construction of Higher Learning Institutions of Shanxi(K2020298, K2021380); 2) Program for Teaching Reform and Innovation of Higher Learning Institutions of Shanxi in 2022(J20221133).
The author declares no conflict of interests.
1970-2025 CP (Manitoba, Canada) unless otherwise stated.