
With global integration and the increasing internationalization of China, the demand for English learning in China is growing rapidly [1-3]. And the lack of good English teachers, and the traditional classroom teaching cannot meet the needs of English learning due to the constraints of time and location. The combination of all these reasons has made English teaching and learning a major problem for the people of China. English learning has also become one of the hot spots in the field of education. With the development of computer science and technology and advances in language teaching and learning methods, CALL technology has made it possible to solve this problem [4,5].
Facing a series of challenges brought by the rapid change of knowledge content and the increasingly fierce international competition for highly qualified talents, it is an important and urgent issue for students to change their learning style and improve the quality of learning. In order to become qualified citizens in the 21st century, students must not only have a deep grasp of the subject matter, but also learn to learn and have better problem-solving, higher-order thinking, independent thinking and knowledge application skills. Therefore, in order to meet this requirement of social development, teachers of ideology and politics classes must change their teaching methods in the teaching process, give full play to the main position of students in the learning process, provoke students to think and research deeply about the knowledge and content they have learned, and promote students’ deep learning cite [6,7]. The problem solving based on real situations is towards deep learning practice exploration, which is inseparable from the high quality classroom teaching problem design of ideology and politics class teachers. It can be said that good problems are favorable pushers to promote students’ deep learning and play an important role [8].
On the one hand, the majority of English learners in China still use language repeaters, MP3 players, cell phones and other portable devices to assist in learning spoken English, but these methods are not able to perform However, none of these devices can recognize the pronunciation, and they are limited to the function of following the pronunciation, and they cannot directly give the learners reasonable and objective pronunciation evaluation and feedback guidance. Feedback and guidance cannot be given directly to the learners [9]. Moreover, due to the limitation of technology, some CALL systems at home and abroad mainly focus on the learning of words and grammar. The system has only one or two evaluation indexes as the basis for evaluation, which has certain functional defects and can only give learners an overall rating. This has certain functional shortcomings and can only give learners an overall rating [10,11].
The purpose of these operations is to eliminate the effects on speech signal quality due to high harmonic distortion, high frequencies, and aliasing of the human vocal cords themselves and the speech signal acquisition equipment [12].
The filter response function is shown in Eq (1):
\[\label{eq1} {\text{ Accuracy }} = \frac{{TP + TN}}{{TP + FP + TN + FN}}.\tag{1}\]
The input speech signal \(x(n)\) as:
\[\label{eq2} y(n) = x(n) – \alpha x(n – 1).\tag{2}\]
It can be regarded as a quasi-steady state process because the speech signal is relatively stable within a short-time range (generally 10 30ms), i.e., the speech signal has short time smoothness [13-15].
To enhance the speech waveform around sample n and attenuate the rest of the waveform calculated by Eq (3):
\[\label{eq3} {Q_n} = \sum\limits_{m = – \infty }^\infty T [s(n)]\omega (n – m),\tag{3}\] where \(T\) denotes some transformation, either linear or nonlinear, \({Q_n}\) is a time series obtained after all segments are processed [16], rectangular and Hanning windows, which are defined as:
Hanming Window
\[\label{eq4} \omega (n) = 0.54 – 0.46\cos \left( {\frac{{2\pi n}}{{N – 1}}} \right),0 \leqslant n \leqslant N – 1.\tag{4}\]
Rectangular window
\[\label{eq5} {\omega (n) = 1,0 \leqslant n \leqslant N – 1}.\tag{5}\]
Hanning Window \[\label{eq6} {\omega (n) = 0.5\left[ {1 – \cos \left( {\frac{{2\pi n}}{{N – 1}}} \right)} \right],0 \leqslant n \leqslant N – 1}.\tag{6}\]
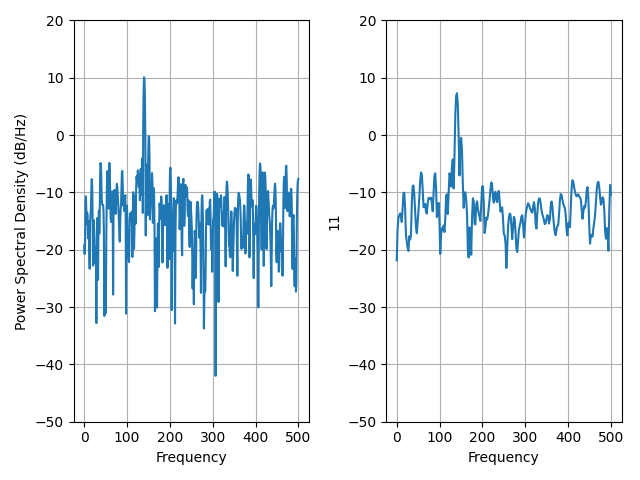
The rectangular window has a narrow main flap with high frequency resolution, but also because it has a high side flap easily leads to more serious interference between adjacent harmonics, and sometimes superimposed and sometimes canceled within the adjacent harmonic interval to produce serious leakage [17].
The endpoint detection results for the sentence will be in the place where we always put it. Are shown in Figure 1. the results, it can be seen that the endpoint detection with the double threshold comparison method have better results.
DBN is used to pre-train the weights of the generated model and then fine-tune the network with a back-propagation algorithm to obtain a better-performing network model. Numerous experiments have shown that internalizing the weight of a multilayer perceptron with a DBN of the appropriate configuration often gives much better results than random initialization [18]. DBN as shown in Figure 2. Essentially, the DBN is trained layer by layer on the RBM to obtain a global better initial parameter, thus improving the network performance. A large number of experiments also demonstrate that DBN can solve the problems of traditional BP networks: the need for a large set of training samples with markers, slow convergence, inappropriate parameter selection leading to the network falling into a local optimum.
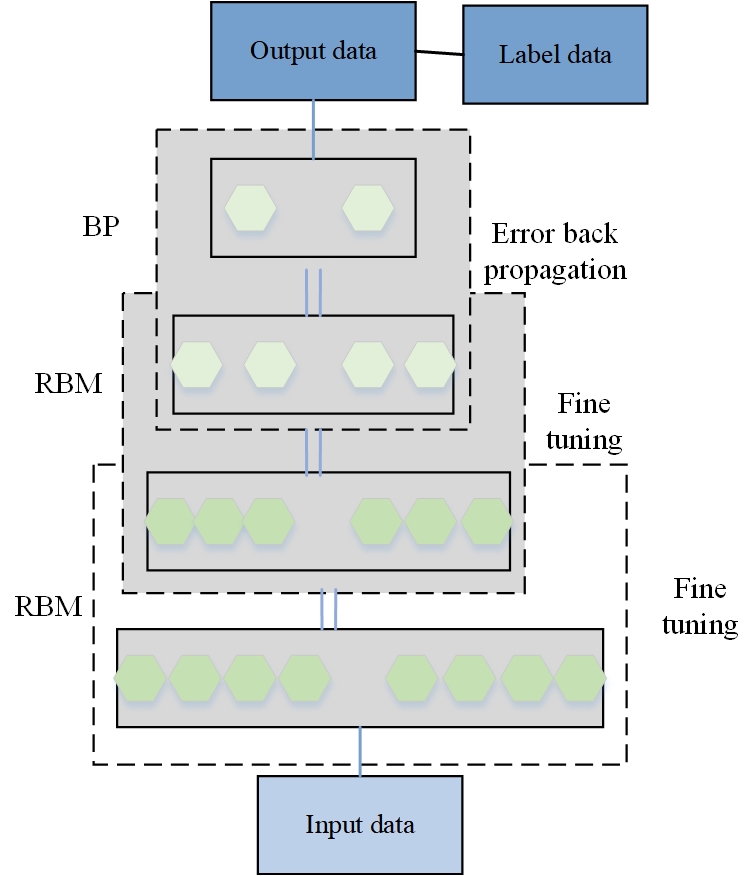
Then the Wake-Sleep algorithm is used to adjust all the weight. The cognitive and the generative are made to agree as much as possible, i.e., the topmost representation of the generative is able to recover the bottom node as correctly as possible [19].
The training process of Deep Learning is as follows:
Unsupervised hierarchical training of each layer parameters using unsolicited data (calibrated data are also possible). The main difference from traditional neural networks is that this step is equivalent to the feature learning process [20].
Top-down supervised learning (that is, by going through the data with labels for training. The errors are transmitted top-down layer by layer to fine-tune the model parameters).
Supervised learning is used to further tune the parameters of the whole multilayer model. Unlike the random initialization process of traditional neural networks, the initialized parameters of DL are obtained by learning the structure of the input data in the first step and are not randomly initialized, thus the initial values are closer to the global optimum and thus better results can be achieved.
This paper uses the Spoken Arabic Digit dataset from the UCI machine learning repository, constructed by the Automatic Signaling Laboratory at Badji-Mokhtar University. The dataset is the pronunciation of Arabic digits after extraction of 13-order MFCC feature parameters, and consists of a total of 8800 speech data (88 individuals pronouncing 10 Arabic digits, each repeated 10 times), pronounced by 44 men and 44 women between 16 and 40 years old.
Before MFCC feature parameter extraction, the parameters to be set are sampling rate 16KHz, 16-bit encoding, hamming window plus window function [21].
English sentence data source, the subjects of this paper was university students of our university, 24 in total, 15 male and 9 females. The subjects were recorded using the recording software CoolEdit, with a sampling rate of 16 KHz and 16-bit coding. A total of 10 sentences were recorded, all of which were commonly spoken English sentences
In order to verify the effectiveness of the model in this paper, we experimentally compare the recognition rate of this model with other models for non-person-specific solitary word recognition. In order to verify the effectiveness of this model, we compare the recognition rate of this model with other models for non-person-specific isolated word recognition. The Spoken ArabicDigit dataset from the UCI machine learning repository is used, which consists of 8800 Arabic digital speech data (88 individuals pronounce 10 Arabic digits, each digit is repeated 10 times). 6600 pronunciation from the first 66 individuals are used as the training set, and 2200 pronunciation from the last 22 individuals is used as the test set [22].
For the same Spoken Arabic Digit dataset from the UCI machine learning library, [23] proposed a new Tree Distributions Approximation based on Graphical Tree Structure (TDA-GTS) and is similar to the Tree Distributions Approximation based on Maximum Weight Spanning Tree (TDA-MWST), the traditional Discrete Hidden Markov Model (DHMM), and the Continuous Continuous Markov Model (CMM). Model (DHMM), and a Continuous Density Hidden Markov Model (CDHMM) is compared and the recognition effect is improved. [24] proposed a K-means algorithm based on selective weights and Thresholds (KASWT), and compared it with BP_Adaboost algorithm, and the recognition effect was improved.
Here, the model in this paper is compared with the above models, and the comparison results of their recognition rates are shown in Table 1.
| Model/Index | Recognition rate |
|---|---|
| DHMM | 90.79% |
| CDHMM | 94.09% |
| TCA-MWST | 93.16% |
| BP_Adaboost | 93.09% |
| KASWT | 92.68% |
| Paper model | 96.64% |
As showed in Table 1, the recognition rate of the DBN model constructed in this paper is 96.64%, which is better than the above models. Therefore, the DBN-based speech recognition model established in this paper is reasonable and effective, and can be further used in speech pronunciation quality evaluation.
The purpose of the speech evaluation experiment is to verify the performance of the English speech pronunciation quality evaluation model and method proposed in this paper, the method is as follows:
\[\label{eq7} {A_{{\text{Consistency rate}}}} = \frac{{{\text{Number of samples consistent between machine evaluation and manual evaluation}}}}{{{\text{Total number of samples}}}}.\tag{7}\]
The adjacent agreement rate is the ratio of the sum of the number of samples in which the machine evaluation and the manual evaluation agree and are adjacent to the total number of samples. Where “adjacent” is defined as the difference of one level between the ratings of machine and manual evaluations. The specific calculation method is as follows:
\[\label{eq8} {A_{{\text{Adjacent consistency rate}}}} = \frac{{{\text{N}} + {\text{A}}}}{{{\text{Total number of samples}}}}.\tag{8}\]
According to the pronunciation quality characteristics, we set four different levels for different evaluation indexes (pitch, speed, rhythm and intonation) and the overall evaluation situation.The detailed evaluation grades and corresponding evaluation standards are shown in Table 2.
| Grade | Intonation | Speed of speech | Rhythm | Intonation | Population |
| A | The content is complete and accurate | Moderate speed | Stress, accurate pronunciation and strong sense of rhythm | Accurate and natural intonation | Excellent pronunciation |
| B | The pronunciation is relatively clear and fluent | Speak a little faster (slower) | Stress pronunciation is more accurate and has a good sense of rhythm | The intonation is more accurate and natural | The pronunciation is generally good |
| C | There are pronunciation errors that affect understanding | Speak fast (slow) | The accent pronunciation is general and has a certain sense of rhythm | The intonation is basically accurate, but not natural enough | General grasp of pronunciation |
| D | There are serious pronunciation errors affecting understanding | Speak too fast (slow) | Accent pronunciation is wrong, the number of accents is too much (less), and the sense of rhythm is poor | The intonation is inaccurate and unnatural | Poor overall grasp of pronunciation |
The manual evaluation was done by two experienced university English teachers. They evaluated each of the 24 They evaluated each of the 10 recorded common English utterances of our university students, including 4 evaluation indicators of intonation, speed, rhythm and The four evaluation indexes and the overall evaluation were.
Considering that the subjectivity of the teacher in the manual evaluation process may have an impact on the evaluation results, this paper uses the Pearson correlation coefficient to test the reliability of the manual evaluation results.
Further, the evaluation results of the two teachers were averaged (rounded) to obtain different students’ different sentences for each evaluation index and the overall score as the final manual evaluation result.
The regression analysis method uses mathematical and statistical methods to establish statistical models to study the statistical relationships between the variables of objective things , through a large number of tests and Through a large number of tests and observations of objective things, the statistical regularities hidden in those seemingly uncertain phenomena are searched for model predictions, as in Eq. (9).
\[\label{eq10} {\text{ Score }} = {\text{ AccuracyScore }} \times 0.44 + {\text{ SpeedScore }} \times 0.106 + {\text{Rhythmscore }} \times 0.341 – 0.397.\tag{9}\]
The F-test of the significance of multiple accuracy score, speedscore, rhythmscore and intonationscore are clear about the random variable score as a whole.Significant impact. According to the analysis of variance table calculated, indicating that the regression equation is significant, and the score has a significant linear relationship with accuracyscore, speedscore, rhythmscore and intonationscore, that is, the probability of error in the judgment that the four evaluation indexes have a significant linear impact on the total score is only 0.003 as shown in Table 3.
| Index/Difference level | Consistency rate | Adjacent consistency rate | Pearson |
|---|---|---|---|
| Intonation | 87.5% | 100% | 0.722 |
In the regression analysis method, the t-test was used to test the significance of the regression coefficients. The table of regression coefficients calculated by SPSS software shows that at the significance level, AccuracyScore, SpeedScore,RhythmScore, and IntonationScore passed the significance test indicating that all four evaluation indicators had a significant effect on the total score have a significant effect on the total score.
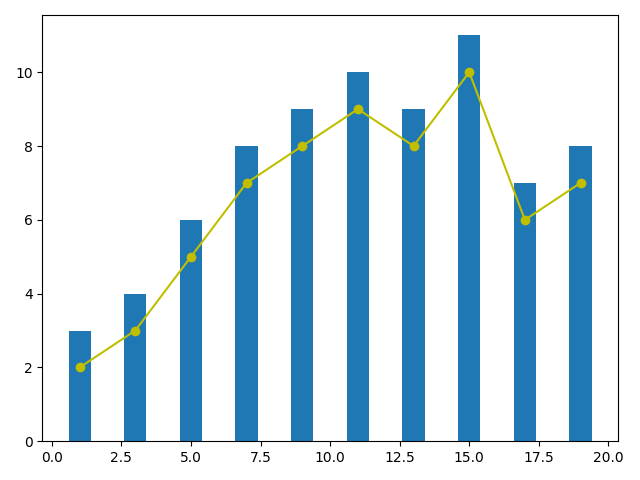
Further, Eq. (9) was used to evaluate a total of 240 sentences for 10 sentences for 24 students. The experimental results are shown in Figure 3, the distribution of different sample values is different. For example, the distribution of sample value 5 is 6, which is also what we expect. 210 samples have the same rating between machine, and no samples have the difference of two or three levels, the overall agreement rate between machine and manual evaluation is 87.5%, and the adjacent agreement rate is as high as 100%, which indicates that machine evaluation and manual evaluation have a strong correlation, indicating that machine evaluation has a strong correlation with manual evaluation.
This study advances the field of speech signal processing and evaluation through the integration of deep learning techniques and comprehensive evaluation methodologies. By leveraging DBN and rigorous evaluation criteria, we have developed a robust model for English speech pronunciation quality assessment. Our experiments demonstrate the superior performance of the proposed DBN-based model in speech recognition and evaluation tasks, outperforming existing methodologies. However, we acknowledge the need for further exploration to address limitations such as dataset size and evaluation methodology. Nevertheless, our findings lay a solid foundation for the continued refinement and application of deep learning approaches in speech processing and evaluation, with potential implications for language teaching and learning practices.
Author declares no conflict of interests.