
Financial management of colleges and universities is an important part of public financial management, therefore, the quality of financial management work of colleges and universities will be directly related to public financial security. With the application of modern science and universities and the continuous deepening of the reform supported by Internet technology is specifically manifested in the following aspects[1-3].
Firstly, strengthen the construction of financial management information standard system of colleges and universities under the background of Internet[4,5]. In view of the complexity of financial management work of colleges and universities at the present stage, the financial management department of colleges and universities should systematically sort out its work content and establish the information standard system of college financial management, so as to significantly improve the quality of college financial management work [6,7].
Implement and improve the financial management mechanism adapted to it while innovating the financial management path[8]. At present, the network service platform becomes an important support for the financial management work of colleges and universities. Based on the many advantages of the Internet, the financial management work of colleges and universities should be adjusted with reference to the information service platform, optimize the management mechanism, simplify the management process and improve the efficiency of the financial management information service platform[9].
In the background of Internet, with the advantages of information integration and transmission of Internet, it can effectively improve the quality of financial management information service. For example, the management of scientific research budget in colleges and universities needs to consider the use of fixed assets, labor cost expenditure and other related funds, in order to strengthen the management of scientific research budget, it is necessary to rely on the information service platform, and the scientific researchers will report their demands through the financial management information service platform, and the financial management The financial data will be changed after approval by the financial management department, thus making the financial management mechanism more flexible and efficient[10,11].
Optimize the financial risk management mechanism of colleges and universities and build financial risk modelp [12]. The innovation of financial management of colleges and universities in the background of Internet can use the network data for reasonable control of financial risks and establish financial risk model, and with the increase of financial data of colleges and universities on Internet, the prediction accuracy of financial risk model will be higher, so as to ensure the orderly development of financial management of colleges and universities [13,14]. This paper introduces the composition of financial management risk system of colleges and universities in detail, and proposes scientific construction plan of financial risk early warning system of colleges and universities according to the special characteristics of financial management work of colleges and universities. For example, the risk of fixed assets management of colleges and universities is mainly directly related to the frequency of use, curriculum arrangement setting and scientific research project declaration, etc. Taking relevant data as the influence factor of risk model of fixed assets management of colleges and universities, it can improve the quality of fixed assets management can be improved and financial risks caused by improper management of fixed assets can be avoided.
To meet the multi-scale deep learning requirements of the university financial system, the system hardware needs to be redesigned so that the hardware meets the fully interconnected mode of the multilayer perceptron network under multi-scale deep learning. It is known that the most critical hardware for the financial system to achieve the fully interconnected mode is the sensor and the coordinator, using the sensor to improve the transmission, processing, storage, display, and recording and control of electrical signals, and using the coordinator to scan the financial data in the system and select the appropriate parameters to build a multilayer perceptual network that can be used for multi-scale deep learning. The block diagram of the hardware design of the financial system of the university, as shown in Figure 1.
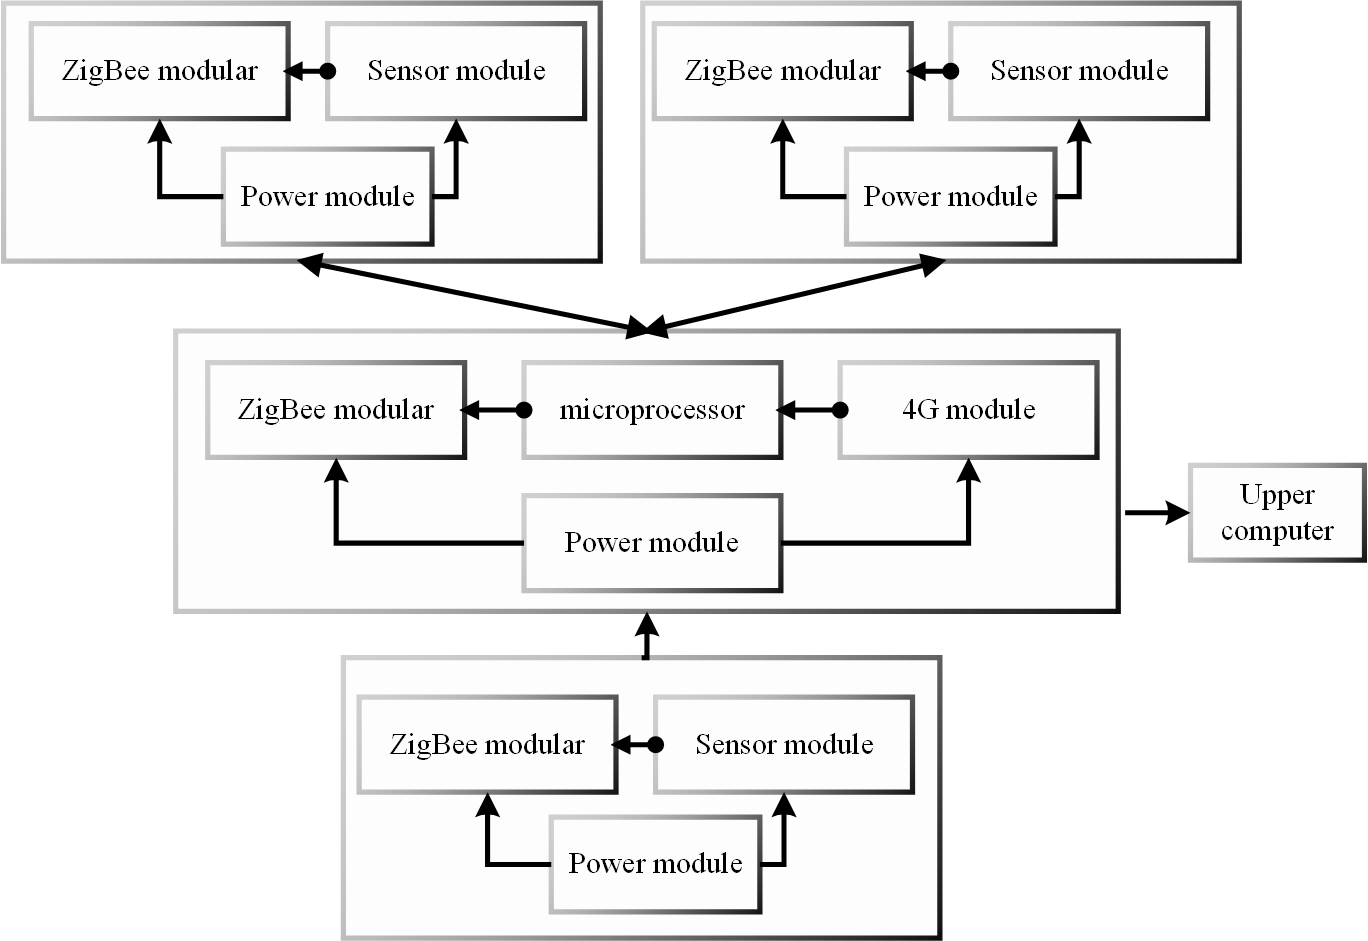
According to Figure 1, the coordinator ZigBee is connected to each node in the acquisition unit, processing unit and control unit in order to obtain the parameters suitable for the whole network and to establish a network with complete coverage of the system. The newly selected sensor model is MGS-2483-H24, and the hardware is connected to the data collection unit for searching the financial data in the university financial system. According to the block diagram, one sensor is connected to each collection node to ensure that all collected data can be uploaded to the data processing center of the system. According to the hardware design block diagram shown in Figure 1, the hardware of the financial system is reconnected to realize the hardware design of the university financial system that satisfies multi-scale deep learning [15].
In the financial system of higher education, the financial information covered is of various types, complex contents, and refined subjects may appear at three or four levels, and the system wants to carry out multi-scale deep learning by designing a database form with a sharp, clear objective and distinct type division, and by setting a weight value to connect the same attribute information [16]. The basic information of college users and college workers are shown in Table 1 and 2.
| Yuduan name | Data type | length | Remarks | Crux |
|---|---|---|---|---|
| EID | varchar | 10 | Customer number | yes |
| Name | varchar | 10 | full name | no |
| Tel | varchar | 10 | contact information | yes |
| DID | varchar | 20 | Affiliated unit | no |
| Area | varchar | 50 | Place of residence | yes |
| DName | varchar | 10 | Unit type | no |
| Yuduan name | Data type | length | Remarks | Crux |
|---|---|---|---|---|
| EID | varchar | 10 | Employee number | yes |
| Name | Varchar | 10 | Employee name | yes |
| Sex | Varchar | 10 | Gender | no |
| Birthday | Date | 10 | date of birth | no |
| Hometown | Varchar | 10 | Native place | no |
| Adress | Varchar | 50 | Current residence | Yes |
| Tel | Varchar | 10 | contact number | Yes |
| \(ID_{}number\) | Varchar | 10 | ID number | Yes |
| Department | Varchar | 20 | Department | Yes |
With Table 1 and 2 as the two major categories for financial information retrieval, the financial information of universities in terms of customers and employees is recorded and updated in real time. Set up information such as customer payment items, drug categories and charge numbers connected with Table 1; set up information such as basic salary, job salary, seniority salary, employee benefits, incentive salary and social insurance connected with Table 2. And so on, according to all the financial information of the university, set the weights of the connected financial information, and the equation of the change of the weights, as in Eq. (1).
\[\label{e1} \Delta {q_{ij}} = – \mu \frac{{\partial D}}{{\partial {q_{ij}}}} = – \mu \frac{\partial }{{\partial {q_{ij}}}}\left( {\sum\limits_{m = 1}^m {{D_m}} } \right) = \sum\limits_{m = 1}^m {\left( { – \mu \frac{{\partial {D_m}}}{{\partial {q_{ij}}}}} \right)},\tag{1}\] where \({q_{ij}}\) denotes the connection weights between financial information; \(\Delta {q_{ij}}\) denotes the change of weights; \(i\) and \(j\) denote two random financial information; \(\mu\) denotes the learning rate of the system; \(m\) denotes the same attribute financial information; and \({D_m}\)denotes the global error value. According to the information of the established database form, the weights that can connect the financial information of universities are set.
It is known that the perceptron has a single-layer computing capability and belongs to a kind of feed-forward network, and according to the set weights, bottom-up information transmission can be performed for each layer of the network[7,8]. Therefore, according to this function of the perceptron, a multilayer perceptual network is constructed, and in this way, the full interconnection pattern of the system information is set, and the connections between neurons in different layers are used to mine the financial information of the university.
The perceptron is used as each node in the neural network, and a dynamic connection weight is set according to the result of Equ (1), and then the perceptron is used to learn this weight, and the topology of the multilayer perceptual network is schematically shown in Figure 2.
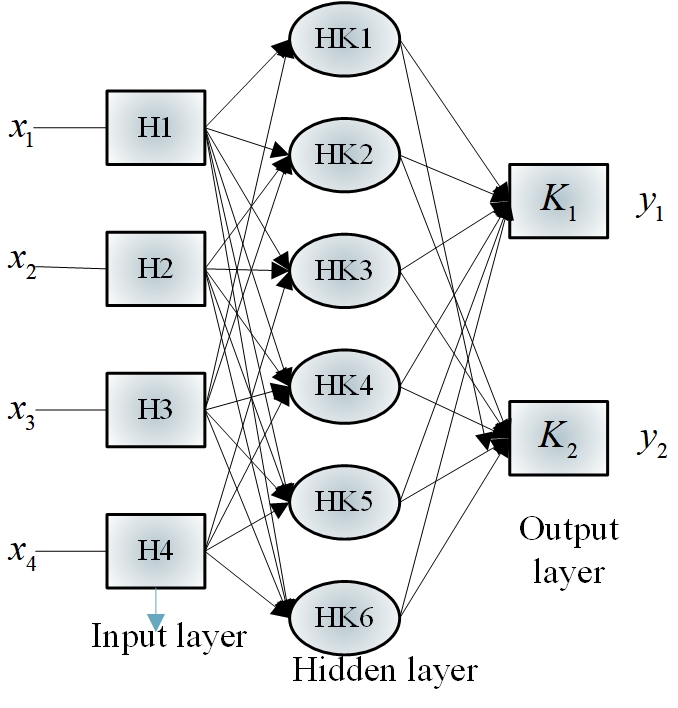
In Figure 2, \(x\) denotes the random financial information; \(H\) denotes the input layer unit; hk denotes the hidden layer unit; \(K\) denotes the output layer unit; and \(Y\) denotes the final result. According to Figure 2, neurons in the same layer are not connected to each other, and neurons in two adjacent layers are fully connected to each other, and the data transmitted from the input to the output are calculated layer by layer through directional information transfer. The multilayer perceptual network set up contains not only input and output layers, but also one or more hidden layers, allowing the system to extract financial data features with associated properties within the system during deep learning, which is the forward propagation system interconnection. In contrast, the reverse system interconnection of the perception network is designed using the back propagation algorithm, which is a secondary assignment of weights, feeding the input pattern into the system from the input side, and adjusting the weights of the previous layer using the error between the output value and the target output value, thus realizing the full interconnection pattern of the multilayer perception network [9].
It is known that the input layer of the perceptual network has a input neurons, the output layer has \(b\) output neurons, the hidden layer has \(e\) hidden neurons, \({q_{ij}}\) plus the Eq. (1) sought, is the connection weights between the output hidden layer and the output layer, is the connection weights , then the output results of the hidden neurons, the output layer neurons under forward propagation, as in Eq. (2).
\[\label{e2} \left\{\begin{array}{l} K=f_1\left(\sum\limits_{i=0}^a p_{i j} X_n\right), \\ Y=f_2\left(\sum\limits_{i=0}^e p_{i j}-K\right). \end{array}\right.\tag{2}\] Using the Eq. (2), the multi-layer perception network completes the forward propagation and establishes the spatial mapping from \(a\) dimension to \(b\) dimension. And under the definition of back propagation algorithm, let the input data be \(c\), denoted by \({x_1},{x_2}…{x_c}\), and the output value is calculated after the \(c\)-th data is input to the network. Assuming that the error function is squared, the error between the \(c\)-th output value and the target output value is calculated as in Eq. (3)
\[\label{e3} \Delta Y = \frac{1}{2}\sum\limits_{c = 1}^n {\left( {{X_c} – {Y_c}} \right)},\tag{3}\] where \(\Delta Y\) is the error; \({X_c}\) denotes the original input and also the desired output. Adjusting the connection weights \({p_{ij}}\) between the input layer and the output hidden layer according to this result, the equation of change of \({p_{ij}}\), as in Eq. (4).
\[\label{e4} \Delta {p_{ij}} = \sum\limits_{i = 1}^c {\sum\limits_{j = 1}^n \mu } \left( {{X_c} – {Y_c}} \right)f_2^\prime \left( {{S_{HK}}} \right){q_{ij}}f_1^\prime \left( {{S_K}} \right){q_{ij}},\tag{4}\] where \(f_2^\prime \left( {{S_{HK}}} \right)\) is the partial differential of the hidden layer transfer function and \(f_1^\prime \left( {{S_K}} \right)\)is the partial differential of the output layer transfer function. Add \({p_{ij}}\) to the result of Eq. (4), and similarly \({q_{ij}}\) to the result of Eq. (1), and use the connection weights of the two directions to realize the data analysis of positive and negative directions, and complete the setting of the full interconnection mode of the multilayer perception network, so that the design of the university financial system based on multi-scale deep learning is completed [2].
Constructing a financial reporting fraud identification model with good out-of-sample prediction ability is crucial to the research in this paper. For both the deep learning model and the benchmark model, three types of evaluation metrics, Precision, Recall, and F1-score[4], are used to measure the classification performance of the model on the test set.
Tables 3 and 4 summarize the prediction results of the deep learning model and the benchmark model on the out-of-sample dataset (evaluation metrics are macro-averaged), and the prediction performance of the deep learning model on different categories, using MD&A texts from the university periodic reports, respectively. The architecture of the deep learning model is based on a word embedding model and a character-level convolutional nerve network, while two types of statistical models (logistic regression and plain Bayesian models) and three types of shallow models (support vector machines, random forests, and gradient boosting decision trees) are selected for the benchmark model.
Based on the evaluation metrics presented in Tables 3 and 4, the empirical results of the study can be summarized in the following four points: first, the classification performance of the models implemented in the study, both the deep learning model and the other benchmark models, is greater than 0.7, indicating that the models can effectively use the textual information in MD&A for financial reporting fraud identification; second, the classification performance of deep learning is significantly higher than that of the other benchmark models. Framework constructed in this paper can better identify fraudulent financial reports than the models used in traditional intelligent financial reporting fraud detection studies. the evaluation index values of the deep learning models on both types of MD&A text sets are greater than 0.82, indicating that the models show better fraud identification ability on different types of data set.
| Model | Macro Precision | Macro Recall | Macro F1-score | |
|---|---|---|---|---|
| Word embedding + character level CNN | 0.89 | 0.850 | 0.851 | |
| logistic regression | 0.80 | 0.81 | 0.801 | |
| Naive Bayes | 0.795 | 0.795 | 0.795 | |
| Support vector machine | 0.811 | 0.82 | 0.812 | |
| Random forest | 0.767 | 0.768 | 0.768 | |
| XGBoost | 0.734 | 0.734 | 0.734 | |
| LightGBM | 0.769 | 0.769 | 0.769 |
| Sample category | Precision | Recall | F1-score |
|---|---|---|---|
| Fraud | 0.87 | 0.83 | 0.84 |
| Non fraud | 0.84 | 0.86 | 0.85 |
On the basis of the experimental data obtained above, the system functions and operation are black-box tested through the system’s dynamic income statement function module and financial trend analysis, etc. After logging into the system, enter the dynamic income statement interface. Analyze the correctness of the detailed data in the financial multi-dimensional analysis table according to the test cases, check the income and expense reports, and check whether the comparison of the same period of the previous year has been shown graphically. Enter the financial trend analysis page, first check the correctness of the parameter setting on the left side, set the year of salary withdrawal as a random year from January 1, 2019 to December 31, 2023, select the section department, submit the query, and check the section financial trend analysis chart and related financial index information as well as equipment yield tracking, future growth trend and cost management trend analysis in the returned results. analysis and cost management trend analysis, etc [8]. The efficiency of the financial system operation is tested as shown in Figure 3.
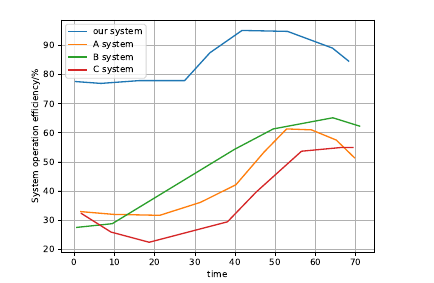
As can be seen from Figure 3, the operating efficiency of the system designed in this paper is significantly higher than that of the system used in the control experiment conducted by the three groups, and the highest operating efficiency of the system designed in this paper is close to 96%, indicating that the performance of the university financial system designed in this paper is superior.
Financial reports, as publicly disclosed information, directly reflect the operation of universities, and therefore become an important medium for universities to commit fraudulent acts. Effective identification of financial reporting fraud has become one of the important tools to regulate the operation order of financial market. This paper constructs a character-level CNN model for identifying fraudulent financial reports of colleges and universities by taking advantage of the breakthroughs in NLP in deep learning technology, and uses MD&A text in financial reports as the analysis sample. The results show that the character-level CNN model can still show better classification performance on a small sample dataset where the shallow model has obvious advantages, without complex textual feature directed extraction, and this result also provides direct evidence for using deep learning techniques to improve existing financial reporting fraud identification methods.
This work was supported by Inner Mongolia University of Technology 2023 university-level “University Student Innovation Experiment Plan” project (2023073001).