
The healthy development of agricultural economy can properly and rationally utilize agricultural production resources, to a large extent, it can further alleviate the employment pressure in rural areas, solve the employment problems of farmers, and increase the economic income of farmers [1-3]. The improvement of the agricultural economic development level in rural areas according to local conditions is based on the basic national conditions of my country’s lack of resources and more people and less land [4-5].
According to the actual investigation, the rural economic development in most areas of our country is facing many difficulties, such as loose management and insufficient supervision. Under the new rural construction environment, rural reform has been comprehensively advanced, and the support of local governments has increased. However, in essence, the real main force of agricultural economic development is farmers themselves. If we want to promote agricultural economic development, we need to strengthen the sustainable development of agricultural economy and ensure that rural reform can be fully implemented on the basis of safeguarding the vital interests of farmers. The state’s emphasis on agricultural economic development has continued unabated. Not only has it formulated poverty, but also various localities have refined implementation measures according to actual conditions, improving the development of agricultural economics in various regions. Through scientific and rational rural economic management, it is beneficial to realize the strategic goal of rural revitalization [6,7]. With the support of emerging technologies, farmers have achieved the goals of increasing production, income and sustainable development, and their overall living standards have improved [8].
Scientific sustainable development of agricultural economy can highlight scientific and environmental protection. Agricultural professional and technical personnel periodically visit the orchard to guide production, which can improve the level of scientific fertilization and application of orchard farmers, avoid the abuse of pesticides, and help reduce agricultural non-point source pollution; at the same time, the overall quality of farmers will gradually improve, so as to better participate in agriculture In economic activities, it provides reliable human support modernization.
With the cross-generational development of information technology, my country has entered the information age. Under this important background, many information technologies have been quietly applied in a very wide and in-depth agricultural economy, and more and more The more agricultural industries and the masses began to apply various types of information technology, the level of rural information exchange was significantly improved, and the ability to obtain relevant market information was significantly enhanced, which provided a lot of convenience for rural economic development [9]. For example, the application of big data technology to the agricultural economy can improve the convenience of obtaining market information, optimize the agricultural economic system, and keep the agricultural economy moving forward on the right path.
Sustainable development has always been a strategic decision in China. In the process of new rural construction, sustainable development is also the most important guiding ideology, and it is an inevitable trend of future rural economic development [10,11]. It needs to develop modern agriculture as much as possible, achieve a high degree of harmony between agricultural production and ecological environmental protection, and enhance the agricultural economy. Eco-efficiency, thus maintaining the momentum of sustainable development.
The degree of integration between agriculture and industry has become higher and higher, the development of agriculture has become more intensive and standardized, and the industrial model of agricultural production has been basically established, effectively overcoming the shortcomings of traditional agricultural production and Insufficient, greatly improved agricultural production efficiency, rural economic development is at the right time [12].
Sustainable development is a form of development with internal power. By integrating different fields and resources into the development process, the greatest synergy has been achieved in achieving sustainable, healthy and high-quality development. Sustainability standards can be simply summarized into three aspects: economic, social and ecological sustainable development, as shown in Figure 1.
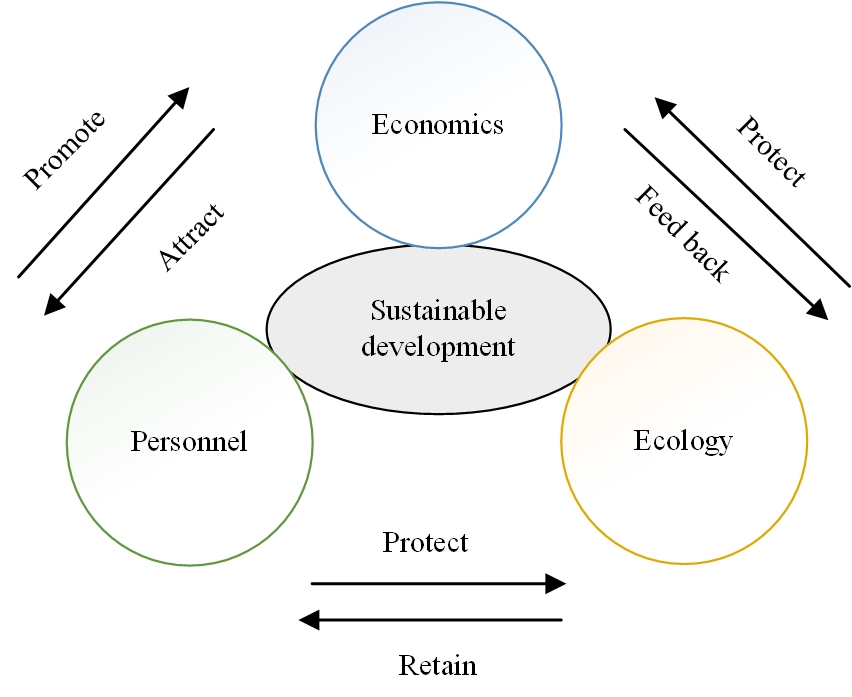
First, we should not only pay attention to the quantitative indicators of economic growth, but also pay attention to the quality of economic growth. Second, without the participation of outstanding talents, even the most perfect strategy will be a dead letter. Finally, while ensuring the sustainable development of agricultural economy, the balance between economic construction and physical consumption should be realized. At the same time, development also needs to protect and improve the ecological environment, make rational use of natural resources and ecological costs, and control rural industrial development on the premise of ecological sustainability.
The production function is the most classical and widely adaptable input-output analysis theoretical model. Through the previous theoretical analysis, it is found that sustainable development capital including physical capital, human capital, ecological capital and cultural capital will affect [13,14]. To explain the role of each element in this relationship, in this paper, four capital factors are introduced together to improve the function.
\[\label{eq1} {Y_{it}} = A{\left( {{M_{it}}} \right)^a}{\left( {{H_{it}}} \right)^\beta }{\left( {{E_{it}}} \right)^\gamma }{\left( {{C_{it}}} \right)^\delta } .\tag{1}\]
To reduce heteroscedasticity and facilitate parameter estimation, this paper takes the natural logarithm of both sides of the above equation and adds a random error term. The functional relationship is linearized as:
\[\label{eq2} Ln{Y_{_{it}}} = LnA + aLn{M_{_{it}}} + \beta Ln{H_{it}} + \gamma Ln{E_{_{it}}} + \delta Ln{C_{_{_{it}}}} + \mu .\tag{2}\]
This paper uses panel data, and the Eq. (2) is a regression econometric model. Where \(i\) is the section unit, the value is \(1,2,…,31\), \(t\) represents the year; \({Y_{_{it}}}\) is the total output of the province \(t\) in \(i\); \(A\) represents the given technical level, if the larger \(A\) is, the greater the output that can be produced by the given factor input; \(M\) is the physical capital input; \(H\) is the human capital investment; \(E\) is the ecological capital investment; \(C\) is the cultural capital investment; \(a,\beta ,\gamma ,\delta\) represent the elastic coefficients of physical capital stock, human capital stock, ecological capital stock and cultural capital stock, respectively, which reflect the degree of influence of each factor on the development of agricultural economy.
The important base point in the background of new rural development is the priority development of agriculture. Agriculture is still the basic industry for farmers to settle down, and the pillar industry for rural industry prosperity and agricultural economic development, as shown in Table 1.
| Variable | Variable definition and assignment | Man value | Standard deviation | Minimum value | Maximum |
| Rural economic development | Total output value | 2742.02 | 2042.98 | 122 | 9550 |
| Rural material capital stock | Investment in fixed assets of rural households \(NK_t = l_f + (1 – \varepsilon ) \cdot NK_t – 1\) | 2552.82 | 2024.7852.58 | 9654.22 | |
| Rural human capital stock | Average education years of rural residents \(\bar S = \sum\limits_i Y R_i \cdot HS_i\) | 8.48 | 0.74 | 0.74 | 10.71 |
| Rural ecological capital stock | Total gas production of biogas digester | 48895.88 | 58364.14 | 276.3 | 5521010 |
| Rural cultural capital stock | Number of township cultural stations | 118.23 | 776.84 | 109 | 4375 |
.
This paper adopts the traditional method of capital stock accounting.
\[\label{eq3} N{K_t} = N{K_{t – 1}} + {I_t} – CF{C_t}.\tag{3}\]
Since the average depreciation rate is in the geometric model, the Eq. (3) can be further deduced as:
\[\label{eq4} N{K_t} = {I_t} + (1 – \varepsilon ).N{K_{t – 1}}.\tag{4}\] This paper uses the fixed asset investment of rural households to measure the physical capital stock \((M)\) , divides the fixed asset investment in 2017 by 10% as the basis for determining the capital stock in the base period (2017 as the base period), and adopts the national average level of 5% as the depreciation Rate.
The average years of education as a proxy for rural human capital and uses the conventional method to estimate.
\[\label{eq5} \overline S = \sum\limits_i {Y{R_i}} .H{S_i},\tag{5}\] where, \(\overline S\) represents the average years of education of rural residents in a certain area; \(i\) represents different education levels, \(Y{R_i}\) represents the total time spent to complete the education at the \(i\) level, \(H{S_i}\) indicates the proportion of the population with an education level of \(i\) in an area.
Ecological capital is an ecological resource that has certain property rights and can realize value-added. According to this explanation, and considering that the utilization of rural renewable resources can reflect the artificial transformation and value appreciation of ecological resources to a certain extent, the total amount of gas produced by biogas digesters is used to measure the stock of ecological capital.
The data in this article come from 30 statistical yearbooks. The selected data sample period is from 2017 to 2021, and a small number of missing data are supplemented by provincial statistical bulletins and Baidu data. In this paper, the stationarity test of the data series is firstly carried out.
First, the overall panel data are regressed with variable coefficients, variable intercepts and mixed models, respectively. By comparing \(F\) with the corresponding critical value at a given significance level, it is determined to select the variable intercept fixed effect model for estimation, and the results are shown in Table 2.
| Project | Correlation coefficient | Standard error | \(t\) statistic | \(p\) value |
| Constant term | -2.638557 | 1.202738 | -2.193795 | 0.0292 |
| \(LnM\) | 1.018640 | 0.031182 | 32.66846 | 0.0000 |
| \(LnH\) | 1.290825 | 0.538615 | 2.396568 | 0.0173 |
| \(LnE\) | 0.160574 | 0.027697 | 5.797332 | 0.0000 |
| \(LnC\) | 0.246475 | 0.119552 | 2.061634 | 0.0403 |
| \(R^2\) | 0.985118 | Mean value of dependent variable | 7.439235 | |
| Adjusted \(R^2\) | 0.983274 | Standard deviation of dependent variable | 0.966557 | |
| Regression standard error | 0.125008 | Akachi information standard | -1.214512 | |
| Sum of squares of residuals | 4.156725 | Schwarz criterion | -0.794745 | |
| Log likelihood | 216.1765 | Hannan Quinn standard | -1.046522 | |
| \(F\) statistic | 533.6198 | Then Dobbin Watson statistic | 0.688537 | |
From the regression results, the value of \(R^2\) is 0.98. From the \(P\) value of the correlation coefficient of the explanatory variables, the elastic coefficients of physical capital, human capital, ecological capital and cultural capital have passed the test, which are \(1.02(P < 0.01)\), that is, the coefficient is reasonable. This means that for every 1% increase in physical capital investment, the agricultural economy grows by 1.02%; for every 1% increase in human capital investment, the agricultural economy grows by 1.29%; for every 1% increase in ecological capital investment, the agricultural economy grows by 0.16%; cultural for every 1% increase in capital investment, the agricultural economy will grow by 0.25%. Comparing the four capital elasticity coefficients, it is found that the input of human capital has the most significant impact on agricultural economic growth, followed by the input of material capital, cultural capital and ecological capital.
In order to further explore the different impacts of the four sustainable development capitals on the development of new rural areas in different regions, this paper conducts grouped panel data regressions for the eastern, central and western regions respectively. Firstly, the grouped panel data are regressed with variable coefficients, variable intercepts and mixed models, respectively. By comparing \(F\) with the corresponding critical value at a given significance level, it is determined that the variable intercept fixed effect model is selected for estimation. The specific regression results are shown in Table 3.
| Project | Eastern Region | Central region | Western Region |
| \(LnM\) | 1.059422***(0.000) | 1.069196***(0.000) | 1.075928***(0.000) |
| \(LnH\) | 2.048935**(0.0231) | 1.865678(0.4524) | 2.745716***(0.0002) |
| \(LnE\) | 0.113014***(0.0032) | 0.319847(0.2562) | 0.165116***(0.0014) |
| \(LnC\) | 0.114213(0.6633) | 1.647305(0.2562) | 0.478786***(0.0005) |
| \(R^2\) | 0.987889 | 0.973663 | 0.988489 |
| Adjusted \(R^2\) | 0.986174 | 0.968923 | 0.986794 |
| Regression standard error | 0.129693 | 0.112992 | 0.107098 |
| Sum of squares of residuals | 1.892694 | 0.638334 | 1.089668 |
| Log likelihood | 90.45774 | 51.16097 | 97.72018 |
| \(F\) statistic | 576.0425 | 205.3751 | 582.6669 |
The results of the regression by region show that: First, in terms of the elasticity of physical capital, human capital, ecological capital and cultural capital in the three regions, the elasticity effect of human capital investment is relatively significant, indicating that human capital in different regions. Secondly, the elastic coefficients of physical capital in the three regions of east, middle and west have all passed the test. The possible reason is that under the guidance, the input utility of its physical capital is more obvious; third, the elasticity coefficients of human capital in the three regions have passed the test. larger than the middle. The possible reason is that the high-quality rural human resources in the central region have been largely transferred to the economically developed eastern region, resulting in a slightly insufficient effect of human capital; fourth, the ecological capital elasticity coefficients of the three regions are all significant. Comparatively speaking, the central region is obviously larger than the western region, and the western region is slightly larger than the eastern region. Fifth, from the value of the correlation coefficient of cultural capital in each region, only the western region has passed the test.
At present, China is in the critical stage of new rural construction, and it is imperative to solve the “three rural” problem. The sustainable development of agricultural economy is an important measure to ensure the “three kinds” development of agriculture. It is conducive to the sustainable development of agriculture, drive rural development, promote agricultural modernization, improve farmers’ income and rural sustainable development through various ways, and achieve more sustainable development for farmers. Good living conditions can ensure the healthy agriculture, sustainable development and prosperity of the country [15-17]. This paper takes the new territories villages as the background to explore the agricultural development of a certain area in the southwest, and will review the specific results in the follow-up work.
The structure of agricultural output value in a county in southwest China in 2017 is shown in Figure 2.
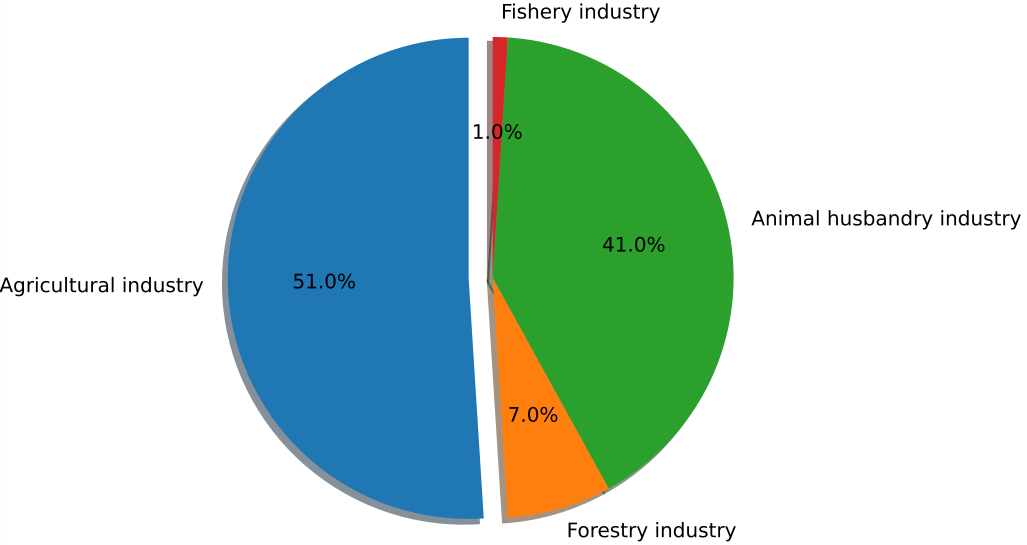
Its total output value increased from 2.814 billion yuan in 2016 to 3.107 billion yuan, an increase of 10.42%. Among them, the agricultural output value was 1.575 billion yuan, an increase of 189 million yuan compared with 2016; the forestry output value was 220 million yuan, an increase of 15.9% compared with 2016; the animal husbandry output value was 1.272 billion yuan, an increase of 67 million yuan compared with 2016; the output value of fishery in 2017 increased by 30.6% compared with 2016, to 23 million yuan; the output value was 0.17100 million yuan, an increase of 10.6% over 2016. (See Table 4 for details)
| Project | 2016 | 2017 | Growth | Growth |
|---|---|---|---|---|
| Total output value | 281369 | 310678 | 29312 | 10.43% |
| Agricultural output value | 138579 | 157478 | 18896 | 13.65% |
| Forestry output value | 18994 | 22014 | 3022 | 15.92% |
| Output value of animal husbandry | 120474 | 127165 | 6692 | 5.56% |
| Fishery output value | 1748 | 2282 | 535 | 30.58% |
| Agriculture, service industry | 1579 | 1746 | 168 | 10.59% |
In 2017, the total sown area of a county in southwest China increased from 130,658 hm in 2016 to 134,428 hm, a net increase of 3,770 hm. Among them, the sown area of grain was 88281 hm, an increase of 1381 hm compared with 2016; the sown area of oil crops was 13939 hm, an increase of 753 hm compared with 2016; the sown area of vegetables was 16328 hm, an increase of 52 hm compared with 2016; The sown area of tobacco leaves was 6941 hm, an increase of 674 hm compared with 2016, while the area of hemp remained basically unchanged, as shown in Figure 3.
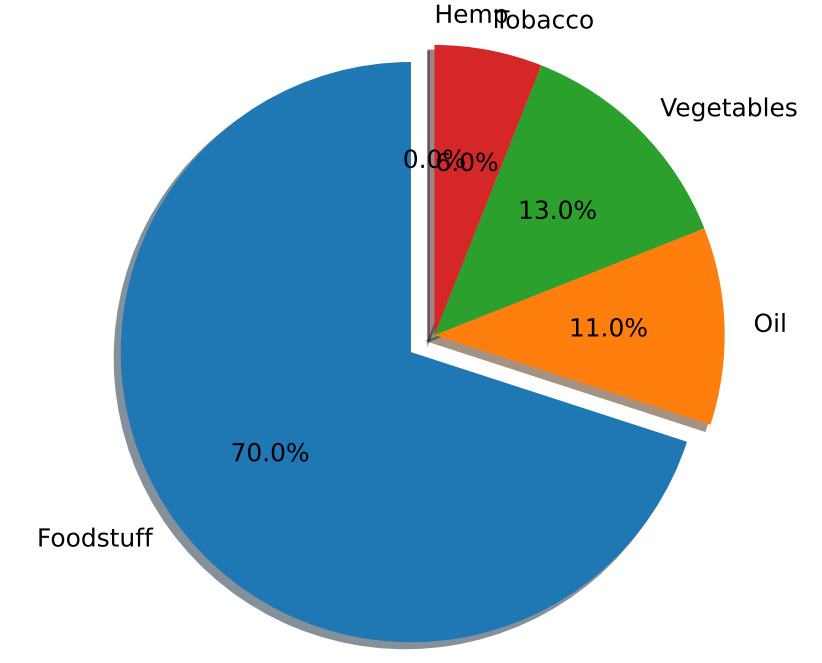
From the perspective of the output of agriculture, as shown in Figure 4.

In 2017, the total grain output of a county in the southwest region increased from 356,321t in 2016 to 367,060t, an increase of 10,739t. The average yield per hectare of land in 2017 was 4157.86 kg of grain, which was 57 kg/hm more than the 2016 per mu yield. The total output of oilseeds increased from 23088 in 2016 to 24876t, an increase of 1788t, a growth rate of 7.74%. The average output of oilseeds per hectare in 2016 was 1784.63kg; percentage point; The total output of flue-cured tobacco increased from 1 1401t in 2016 to 14356t, an increase of 2955t and a growth rate of 25.92%. The yield per hectare of flue-cured tobacco in 2017 was 2068.29kg, and the yield per mu increased by 13.69% compared with 2016; The total output of vegetables was 244,943t, an increase of 25,401t or 11.57% over 2016. The average yield of vegetables per hectare in 2017 was 15,001.41kg, an increase of 7.96% compared to the 2016 per-mu yield. The output of tea decreased from 9t in 2016 to 8t, a decrease of 11.11%; the total output of tea in 2016 was 998t, an increase of 54t over last year, and the growth rate was 5.72%; 8995t increased to 9352t, an increase of 3.97%; the output of aquatic products decreased from 1317t last year to 1300t, a decrease of 1.29%; the total meat output was 61325t, an increase of 1464t over the previous year, an increase of 2.45%; the total output of poultry eggs was 3805t, an increase of 7.12% over the previous year (See Table 2 for details).
| Poject | Output in 2016 \((t)\) | Output in 2017 \((t)\) | Growth \((t)\) | Growth rate (%) |
|---|---|---|---|---|
| Fdstuff | 356322 | 367062 | 10738 | 3.02 |
| Oil | 23089 | 24878 | 1789 | 7.75 |
| Hemp | 8 | 9 | -1 | -11.12 |
| Tbacco | 11402 | 14357 | 2956 | 25.93 |
| Vegetables | 219543 | 244945 | 25402 | 11.58 |
| Tea | 945 | 997 | 55 | 5.73 |
| Slkworm cocoon | 24 | 0 | -24 | -100.02 |
| Fruits | 8996 | 9353 | 358 | 3.98 |
| Seafood | 1318 | 1302 | -18 | -1.28 |
| Mat | 59862 | 61326 | 1465 | 2.46 |
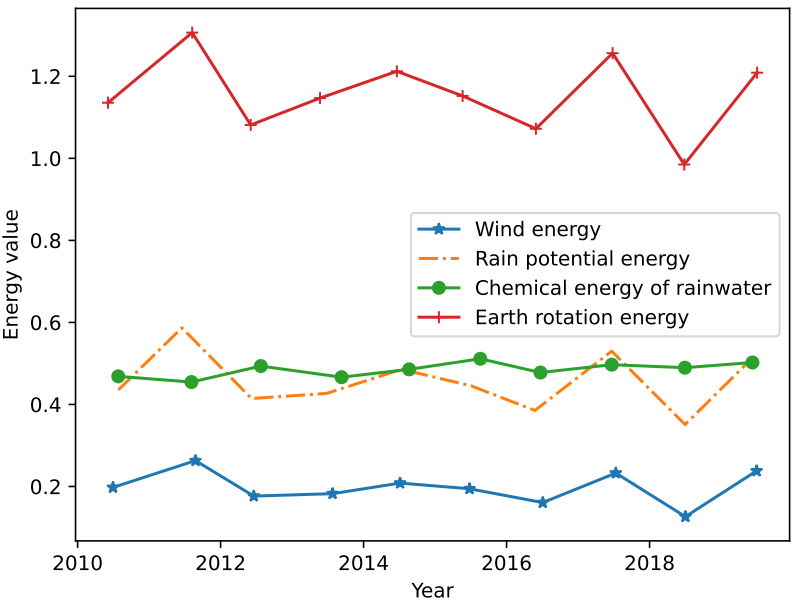
Renewable environmental resources in a county in southwest China are an important part of its agricultural ecological economic system, and solar energy, which have little or even hard influence on human activities, are renewable environmental resources. main component. The annual sunshine hours of a county in the southwest are about 1000h, and the ratio of the actual sunshine hours to the sunshine hours when the umbrella sky is cloudless is about 25%, and the solar energy resources are relatively scarce. In a county in southwest China, the energy value of solar radiation accounts for the smallest proportion, which is about 0.1%. In a county in the southwest, the chemical energy of rainwater accounts for about 30%, the rotation energy of the earth accounts for about 32%, and the potential energy of rainwater accounts for about 37%, as shown in Figure 5. Relatively speaking, these three energy values The proportion is relatively large, mainly because a county in the southwest has abundant geothermal resources and sufficient precipitation, and the annual average precipitation is 1000–1500ram [18].
The economic feedback energy value includes not only non-renewable auxiliary energy, but also renewable organic energy. The economic feedback energy of a county in southwest China has changed from the 2010 to 2020 \(7.66 \times {10^{20}}sej\) rose \(8.47 \times {10^{20}}sej\), an increase of 10.5%. The proportion of its economic feedback energy in the total system energy input increased from 40.8% to 44.58%, of which the proportion in 2018 reached 45.35%. Although the proportion fluctuates in the middle and does not increase sequentially, the overall trend is a steady increase, as shown in Figure 6. The degree of reliance on renewable organic fertilizers and non-new industrial auxiliary energy is becoming more and more obvious [18-20].
The key to revitalizing the countryside is to revitalize industry. Developing and developing agricultural economy can consolidate and improve the quality of countryside. Through the analysis of panel data, this paper analyzes the ways of agricultural sustainable development under the background of new rural construction, and gives a practical example of its effectiveness. According to the development process of modern agriculture in different regions and the construction needs of new rural areas, speed up the construction of development plans and development mechanisms that meet the requirements of new rural construction, further clarify the roles and functions of enterprises in the process of economic development, and build a complete agricultural economy management system.
This work was supported by Research on the mechanism, measurement and path of digital technology driving the high-quality development of the real economy(HB21YJ033); and Research on the Mechanism, Measurement and Policy of Beijing-Tianjin-Hebei “New Infrastructure” to Promote Economic Growth (HB23LJ004).