
One of the biggest issues facing the agricultural sector in recent years has been the issue of pests and illnesses in crop production [1]. Surface damage is widespread in garlic farming, but it can be challenging to monitor and identify properly. The severity of the damage has a direct impact on yield and quality [2]. In addition to being labour- and time-intensive, traditional manual inspection techniques are also extremely susceptible to subjective factors, which makes it challenging to satisfy the needs of large-scale manufacturing [3]. To increase the productivity and calibre of garlic production, it is crucial to design an automated damage identification approach that is both accurate and efficient.
Compared to RGB and multispectral photos, high-spectrum images provide more wavelength information, which makes them valuable in a range of industries. They are also employed in security, gender studies, and agriculture, including plant classification [4]. In addition to crop pests and illnesses, hyperspectral images of fruits are utilised to identify mechanical damage [5]. It can be applied to early egg analysis and even to evaluate the quality of the eggs. There have been reports that it is mobile [6]. Research on machine learning for the selection of damaged garlic has primarily made scapular RGB cameras possible. However, hyperspectral camera technology primarily influences allicin and the soluble solids content (SSC: SolubleSolid Content; henceforth referred to as SSC) of garlic, in addition to the garlic’s sterility following air-drying. Singularity has been detected using it [7]. In order to monitor allicin and damage in garlic, simultaneous usage of RGB and hyperspectral cameras raises the expense if such damage is found. The hyperspectral camera can also identify plant damage, and research has been done to find a way to get more useful information from a single hyperspectral image while also lowering the expense of identifying garlic damage based on the optical image [8].
Our goal in this study was to use hyperspectral camera technology and machine learning techniques to create an efficient model for recognising damage on the surface of garlic. Out of the 154 garlic plants that we gathered data from, 140 were utilised to create the model and 44 were used to validate the test. After preprocessing the data using the normalised vegetation index (NDVI) approach, we trained a logistic regression model on 579 pixels. Lastly, in order to evaluate the precision and dependability of the model, we field validated 54 garlic bulbs [9,10].
High-level logistic regression was used to evaluate the created model using a garlic classification model. In the end, the model was identified by comparing it with RGB photographs and using high-spectral photos of 24 garlic plants.
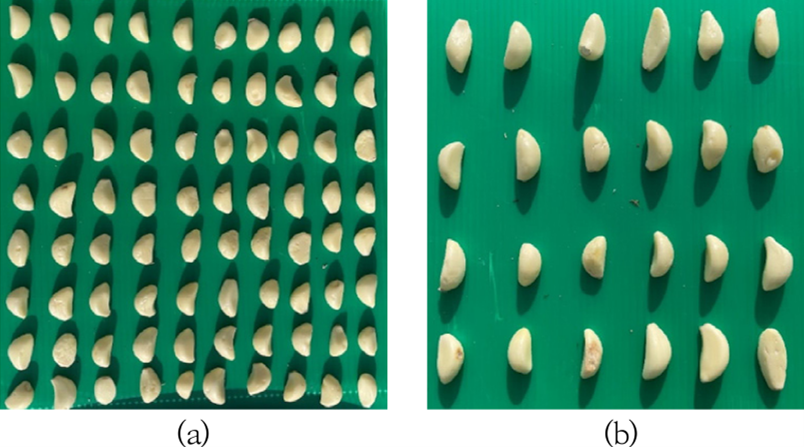
184 garlic plants were ready for use in this study after being acquired from a nearby store in Jinan, China. Using a spatula, the garlic was sliced into several tiny and big damaged areas on its surface [11,12]. The garlic was then exposed to varying degrees of damage for approximately five days at a temperature of 25°C indoors. The decaying garlic looked like what Fig. The acquired samples are displayed in Figure 1. As seen in Figure 1, the 184 garlic plants were split into two groups. Figure 1a shows the classification model developed using eighty species of garlic; Figure 1b shows the classification model developed using the remaining species. Figure 1b illustrates how 24 garlics were finished.
A Specim FX10 was employed by the camera to capture macro-image data. This device may be used to gather spectral data and has both visible and near-infrared (VNIR) wavelengths (400-1000 nm, bands 1-56) Table 1. The Lastolite LLL LR2050 20-inch Ezybalance card 18% (Manfrotto, Italy) is the reflector that was utilised to adjust the reflectance of the photos that were obtained for the high-spectral camera [13,14]. The desktop programme Lumo Scanner was used to capture hyperspectral data.
The garlic configuration illustrated in Figure 2 can be used to set up and regulate the canning stage and sample position for the study. To do this, place the sample roughly 1.2 metres away from the hyperspectral camera for image data gathering. Position the high-frequency camera on the same board as shown in Figure 2 and fasten it to the tripod support.
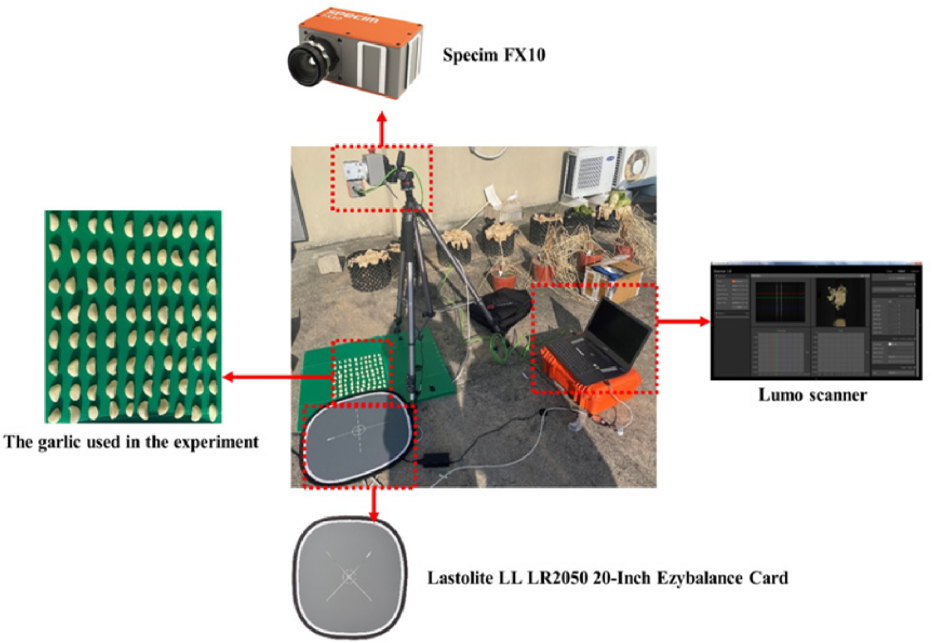
A laptop computer was linked to the hyperspectral camera’s data port, and a Lumo scanner was utilised to measure dark current images in order to reduce self-noise when the sky was clear [15]. Store the data after setting the binning value to twice the default value. Following the acquisition of the raw hyperspectral data, further modelling and computations were carried out. All pixel values were dispersed between 0 and 1 after reflectance correction was applied to the raw data using a reflector to aid in model training. (SPECIM FX10 specifications are shown in Table 1.)
| Aticle | Vntilator |
|---|---|
| Sectral range | 400-1000 nanometers |
| Sectral band | 224 |
| Spectral FWHM (Full Width at Half Peak) | 55 nanometers |
| Satial sampling | 1024 pixels |
| Frame rate | 330FPS full frame 9900FPS, select 1 frequency band |
| FOV | 38 |
| F value | F/1.7 |
| Camera signal-to-noise ratio (SNR) | 600:1) |
| Camera Interface | Gige Vision g /mera link) |
The red and near-infrared bands on crops represent the normalised vegetation index, or NDVI [16]. Using line bands from multispectral pictures and reflectance variations in the red and near-infrared bands, the NDVI is a measure of the intensity of vegetation [17]. With the use of observed multispectral satellite photos, the NDVI can be used to assess the true state of crops.
The NDVI is computed using the same formula as in Eq. ((1). Here, red indicates infrared reflectance while NIR is the closest ultraviolet reflectance. NIR data are found in band 39 (810 nm), while red data are found in band 24 (650 nm). ENVI computes the NDVI picture and generates the resulting image.
\[\label{e1} {\text{NDVI = (NIR – Red)/(NIR + Red}}).\tag{1}\]
The near-infrared reflectance is denoted by NIR, while the infrared reflectance is indicated by Red.
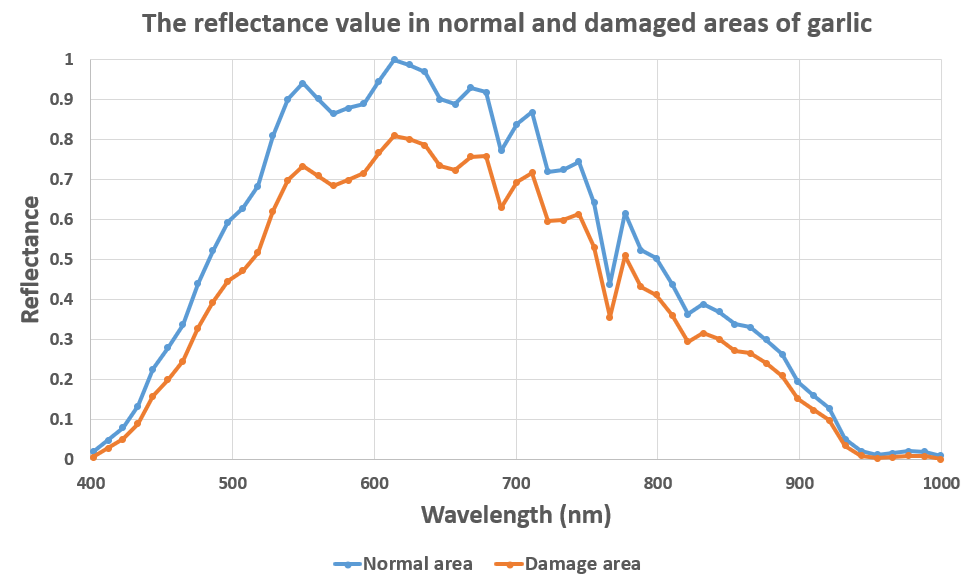
As seen in Figure 1, the ROI function was used to separate the substantially damaged and normal regions in ENVI prior to model creation. The average reflection values in each band for the injured and normal portions were calculated, same like in Figure 3. Throughout the whole band from 400 nm to 1000 nm, the reflectance values in the damaged zone are different from those in the normal region. This led to the establishment of 56 bands as the foundational data for the ensuing model training.
Little computing work is needed to use the logistic regression model. Furthermore, it is quick and adaptable to a wide range of two-dimensional classification issues [18]. The logistic regression model was selected for this study in order to create a classification model, and it was obtained and verified. The ratio of damaged to normal areas varied significantly across the 80 garlic plants in the training data; therefore, 56 bands of reflections (300 pixels) and normal ROI areas (279 pixels) were chosen for a total of 579 pixel locations in the damaged ROI areas in order to close the gap.
The validation team examined 24 samples in order to confirm the model’s capacity for categorization. The full band’s reflectance data were used to create the logic. Regression modelling was used for detection, and the ROI function in ENVI was used to examine the outcomes of the identified damaged and normal pixels. The outcomes were compared with those from the RGB camera after being shown in Jin.
Figure 4 displays the typical surface area of garlic from the NDVI photo result, with the damaged portion partially visible. As can be observed, the damaged area is easily identified from the regular area, whereas the area with minimal damage in the white dashed area barely deviates from the normal area. As depicted in Fig. Garlic has deteriorated after significant injury, as evidenced by the NDVI values when compared to the RGB shot in 1a.
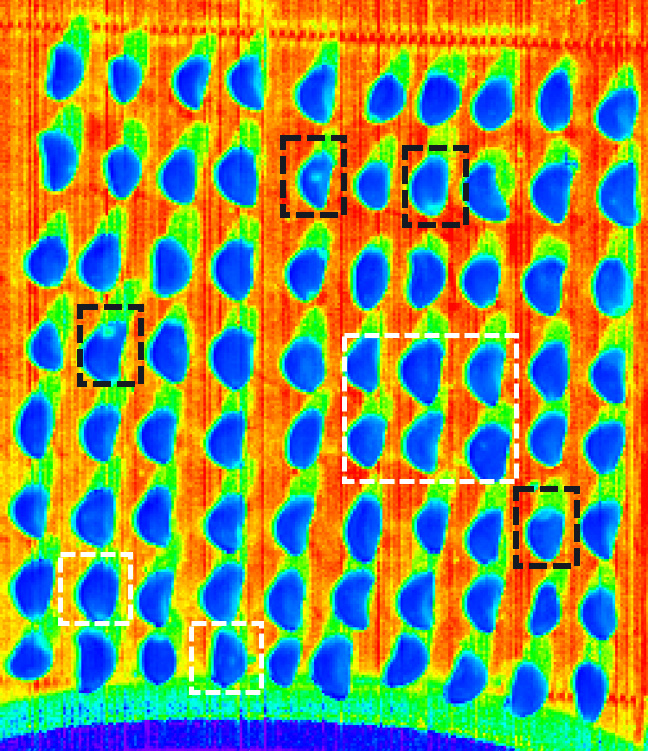
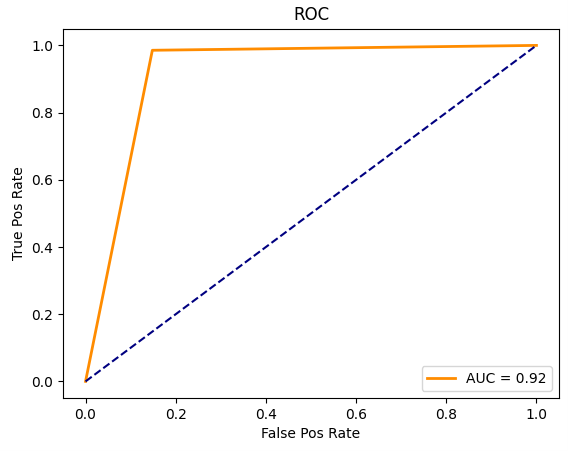
Table 2 displays the model’s accuracy results. 0 represents normal areas, and 1 represents damaged areas. As may be shown, the model’s overall identification rate is 90%. With high F1 scores of 85% and 92%, the expected failure and recall rates were 97% and 76% for normal areas and 86% and 98% for damaged areas, respectively. Figure 5 displays the overall forecast accuracy results for the model. One way to evaluate the receiver’s operating characteristics is as follows: The region beneath the ROC curve becomes the area under the curve (AUC), and once more, the greater the AUC area, the higher the model’s accuracy. The ROC curve is near the upper left quadrant. The AUC result for the model created in this investigation is 92%, according to the ROC curve.
| Item | Precision | Recall | F1-score |
|---|---|---|---|
| 0 | 0.95 | 0.77 | 0.82 |
| 1 | 0.85 | 0.96 | 0.92 |
| Accuracy | – | – | 0.92 |
| Macro avg | 0.92 | 0.85 | 0.88 |
| Weighted avg | 0.90 | 0.90 | 0.90 |
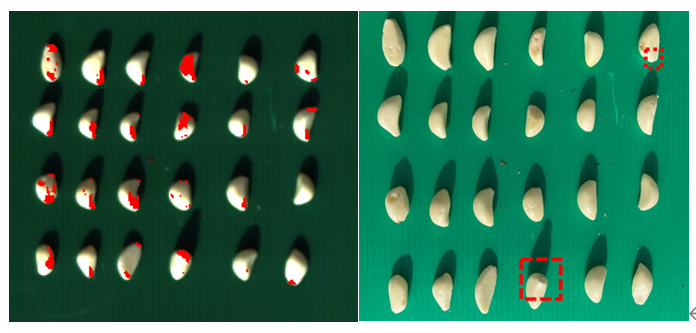
The red area in 6a is the result of anomalous damage, as seen in Figure 6. Garlic’s RGB data is seen in 6b. It is evident that the logistic regression approach can correctly identify both minor and degraded areas of damaged garlic, in contrast to the identification findings of the NDVI method. Nonetheless, the model’s drawbacks, as created in this study, are indicated below. In the future, we will create an accurate classification model that can distinguish between garlic cloves and roots, as indicated by the dashed red region in Figure 6b, which also indicates that the garlic roots were identified as damaged.
This work proposes a surface damage detection approach based on logistic regression that always analyses the complete waveform data. The significant cost of data processing is a drawback. Nevertheless, the conventional NDVI method uses a threshold value to assess the degree of surface damage to garlic; the threshold value’s assessment may be arbitrary based on the quantity of samples and the statistical analysis technique used. Nonetheless, by providing a value of 0 or 1, the logistic regression approach suggested in this work can generate objective classification findings and is thus thought to be more trustworthy.
This study used logistic regression modelling and high-spectral image processing techniques to create a surface damage detection model for garlic. After being preprocessed in ENVI, raw high-spectral photos of garlic outside the plant were sent back. After four corrections and normalisation processes, the NDVI image results were examined for the average reflectance values of the damaged and normal areas. A total of 579 pixels of data from the damaged and normal areas were added to the logistic regression model, which was trained and assessed for the validation group. Using this technique, the model’s accuracy was confirmed. When compared to the NDVI approach, the experimental findings demonstrate that the logistic regression model’s overall accuracy can exceed 90%. Additionally, the model performs well in identifying areas with both major and moderate garlic damage.