Selecting the user comment information of short videos with top 2 likes in the top 50 topics about public cultural services in Shake App as the research object, and facilitating video platforms to identify the high and low quality of the videos and make reasonable promotion arrangements by predicting the short-term playback volume of pop-up videos and analyzing the influencing factors, which is conducive to improving the platform’s pop-up video services and economic benefits. The data related to B station videos are captured, and feature selection and different algorithms are combined to construct random forest model, XG Boost model and LSTM model to predict the playback volume of the pop-up videos, and compare and analyze the effects of different feature combinations on the experimental results. The results show that the prediction accuracy of the random forest model is higher than that of the XG Boost model and the LSTM model, and the features of the pop-up video itself have the greatest influence on the playback volume, while the features of the video markup text have a smaller degree of influence on the playback volume.
With the rapid increase of mobile network speed and the innovative development of new media thinking, short video platforms suitable for fragmented reading on mobile phones have become a favored source of information acquisition for readers, especially a series of short video APPs represented by Jitterbug, Bei li Bei li, Quick Hand, Watermelon Video, Wei si, Second Beat, etc., which are highly favored by users for their characteristics of multi-channel, fragmented, high-frequency, good sharing, etc. [1]. The current short video research mainly focuses on: first, short video marketing research in different industries. Such as short video marketing of network drama, short video marketing of film and television drama, short video marketing of publishing industry, short video marketing research of science and technology journals, short video marketing of tourism, short video marketing research of online education, and short video marketing research of positive energy [2]. Second, the value of short video marketing research. For example, short video has unique value to promote national reading, mainly reflected in the communication channel and audience expansion, knowledge dissemination and knowledge value-added, emotional connection and reading mobilization [3]; short video helps social governance, playing an important synergistic value of governance [4]; short video marketing has the value of branding to strengthen the brand positioning, enhance the brand affinity, the professional development of the brand and the marketing of the value of the realization and so on [5]; short video advertising is more resilient, convergent and constructive media bond value for the foreign exchange and communication of ethnic minority regions [6]; short video has the value of handicrafts. Short video advertisements have a more resilient, convergent and constructive media bond value for the foreign exchange and communication of ethnic minority regions [7]; short video marketing of handicrafts can show the production process of traditional handicrafts, and the artistic and aesthetic value of handicrafts, etc. Third, short video marketing optimization research. For example, it is easier to create mobile vertical short video marketing to increase consumer interest and participation [8,9]; from the type of short video, source, duration, insertion of the topic, subtitles, narration, personnel appearances in seven aspects to improve the communication power of the Museum of Natural Science Shake voice [10].
The rise of pop-ups has led scholars to study them from different perspectives, such as cultural perspective, development strategy and communication science. The cultural perspective focuses on analyzing the developmental differences between the East and the West and the linguistic characteristics of pop-up culture, [11] analyzed the pop-ups of physics teaching videos on B station, revealing that the generation of pop-up texts has gone through three stages of initial generation, acceptance reproduction and high-energy stimulation, and that its interactions are characterized by vituperation and decentralization, which can more effectively promote the teaching of teachers; From the perspective of participatory culture, [12, 13] and others have explored the reasons why video triggers pop-up texts and pop-ups influence video creation, as well as the new features of participatory culture. In terms of development strategy, most of the research focuses on the impact of pop-ups on consumers’ purchasing behavior and willingness to buy, [14] and others explore the correlation between users’ emotions and ad insertion mechanism and innovatively propose an emotion-matching ad insertion mechanism and a dynamic ad insertion mechanism, which provide new marketing strategy ideas for online video platforms. The research hotspots in the communication perspective are in the areas of dissemination patterns and broadcast volume influencing factors [15]. By analyzing the characteristics of pop-ups, it is proved that pop-ups can satisfy people’s needs in three aspects: emotion, entertainment and social interaction; [16] and others respectively explored the influence of pop-ups on the dissemination effect of military-themed videos and the immediate influence of official account video dissemination from multiple perspectives; [17] proposed an RF-based PM2.5 concentration level prediction method, and the results showed that the model prediction has good precision and recall; the XG-Boost algorithm has high accuracy and scalability, and it can discover the dependency relationship between the data [18]. Aiming at the data of daily confirmed cases of COVID-19 in the United States, LSTM algorithm and XG Boost algorithm were used to build a prediction model.
Through the literature research, it is found that the research on the prediction of pop-up video playback and the analysis of influencing factors is not deep enough and the model is relatively simple, and most of the algorithms used for the prediction problem are relatively single, and there is a lack of comparative analyses between different feature choices and different algorithms [19]. In view of this, this paper takes one of the most influential domestic pop-up video websites, Bei li Bei li pop-up website (hereinafter referred to as B station), as the research object, uses the feature selection method to screen the data sample features, adopts the machine learning algorithm and the deep learning algorithm to predict the playback volume, and compares and analyses the strengths and weaknesses of the different algorithms in the prediction of playback volume of the pop-up video, as well as the factors affecting the playback volume.
With the development of digital technology and Internet technology,
users can search for content labels or enter interest groups to obtain
short video content according to their personal preferences, and their
ways to reach the content increase and the cost decreases. This
development makes short video content easier to be seen, user interests
are easier to be matched and satisfied, the concept of absolute mass
gradually faded out, and user demand presents a vertical, circle
development trend [20]. In the
context of the traditional network economy, the full-link marketing
model based on user behavior includes the more typical AISAS model,
i.e., A (Attention) attracts attention

This study combines the active users ranking of short video platforms, selects “library, cultural center, museum, electronic reading room, cultural center, public culture, culture, culture cloud, mass culture” as the topic keywords, and screens and filters mobile short video APPs such as Jitterbug, Shutterbug, watermelon video, sub-atomic, second shot, pear video, Mei pai, volcano, and the most right, and finds that the Jitterbug APP platform with its diversified user groups, rich public cultural content, and easy-to-obtain user data is more suitable for the marketing of short videos of public cultural services, and thus ultimately selects Jitterbug APP as the platform for the research and analysis.
The topic is one of the most powerful ways to achieve content aggregation of Jitterbug short video APP platform with social attributes [22]. On January 9, 2022, this research conducted a survey on topics related to public cultural services on Jitterbug APP. With “libraries, cultural centers, museums, e-reading rooms, cultural centers, public culture, culture, cultural clouds, and mass culture” as the topic keywords, 429 topics with more than 100000 broadcasts were retrieved from Jitterbug APP topics, and the top 50 topics were selected, As shown in Table 1:
| Serial number | Topic | Likes/10000 | Serial number | Topic | Likes/10000 |
|---|---|---|---|---|---|
| 1 | Traditional culture | 6953000 | 26 | Library | 81000 |
| 2 | Folk culture | 1718000 | 27 | Ethnic minority culture | 61000 |
| 3 | Traditional Chinese Culture | 1451000 | 28 | Jitterbug Cultural Kiosk | 43000 |
| 4 | Inheriting Culture | 1153000 | 29 | Cultural Confidence | 41000 |
| 5 | Promoting Traditional Chinese Opera Culture | 1090000 | 30 | National Museum | 14000 |
| 6 | Ka Material culture heritage | 925000 | 31 | Library check-in | 9576.8 |
| 7 | Culture | 826000 | 32 | Jiangxi Provincial Library | 6193.2 |
| 8 | Ethnic Characteristics and Culture | 770000 | 33 | National library | 2813.1 |
| 9 | Chinese culture | 748000 | 34 | Universal Library | 1974.3 |
| 10 | Traditional Culture Season | 562000 | 35 | Yiyang Qian xi Library | 1498.6 |
| 11 | Great Country Culture | 484000 | 36 | Cultural Museum | 975.8 |
| 12 | Promote the Classic Culture of Traditional Chinese Medicine | 420000 | 37 | Jilin province library | 823.7 |
| 13 | National culture | 334000 | 38 | Tangshan Library | 798.9 |
| 14 | Cloud Museum | 254000 | 39 | Things about the library | 792 |
| 15 | Cultural tourism | 249000 | 40 | Historical and Cultural Museum | 693.2 |
| 16 | Traditional Chinese Culture | 243000 | 41 | Lin tong Cultural Center | 679.6 |
| 17 | Go to the library | 223000 | 42 | Yunnan Folk Culture | 643.7 |
| 18 | Museum | 222000 | 43 | Shaanxi Library | 543.7 |
| 19 | Intangible cultural heritage | 217000 | 44 | Shan yang county Cultural Centre | 486.7 |
| 20 | Chinese Traditional Culture | 175000 | 45 | Internet celebrity library | 475.6 |
| 21 | Chinese culture | 158000 | 46 | Mass culture | 470.8 |
| 22 | cultural difference | 136000 | 47 | Lighthouse Library | 449 |
| 23 | Cultural Cultivation Camp | 126000 | 48 | Yunnan Culture | 431.8 |
| 24 | Promote traditional culture | 105000 | 49 | Booklist Library | 416.9 |
| 25 | Jitterbug Library | 94000 | 50 | Tianjin Binhai Library | 350.7 |
The overall framework design is shown in Figure 2. We analyze the webpage of the pop-up video website and collect video data, select features according to the Pearson correlation coefficients of the feature variables and predictor variables; construct RF, XG Boost and LSTM models to explore the optimal algorithm for predicting the amount of playback; and finally, adopt the optimal algorithm for playback prediction to explore the effects of different features on the prediction results from the four dimensions of pop-up video features, creator features, numerical features, and textual features, and analyze the results according to the evaluation index. The results are analyzed according to the evaluation indexes.
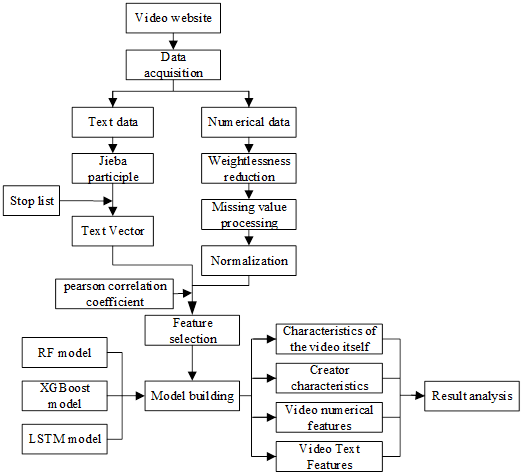
A distributed access mechanism is used to obtain 7832 video data under the three keywords of Daily, Life and VLOG for the B-site anti-crawler setup, and since users can modify their posted videos at any time, it is difficult to quantify the impact on the playback volume, so we select the videos on the same day and predict the playback volume after 24h. The dataset contains a total of 17 columns of data, and its data presentation is shown in Table 2.
| Serial number | Column Name | Data type | Explain | Example |
|---|---|---|---|---|
| 1 | Bv_id | Character type | Video Number | B V IVW411m7dk (not used as Feature selection) |
| 2 | Title | Textual | Video Title | Children’s brothers argue daily |
| 3 | Intro | Textual | Video Introduction | Bgm: Battle Song – Master Luo av4632774 |
| 4 | Video_link | Character type | Video Link | http://www.bilibili.com/videolav32768770 (Not as Feature selection) |
| 5 | Start_view | Numerical type | Starting video playback volume | 117264 |
| 6 | Up_time | Numerical type | Video upload time (converted to the number of days on the day of data crawling) | 1255 |
| 7 | Like | Numerical type | Likes | 2339 |
| 8 | Collect | Numerical type | Collection volume | 2472 |
| 9 | Coin | Numerical type | Coin quantity | 328 |
| 10 | Trans pond | Numerical type | Forwarding volume | 343 |
| 11 | Comment | Numerical type | Comment volume | 128 |
| 12 | Danmu_num | Numerical type | Barrage quantity | 232 |
| 13 | Up\_id | Character type | UP main name | Children’s nutrition bud cream (not as a Feature selection) |
| 14 | Up_fans | Numerical type | Number of UP main fans | 3565 |
| 15 | Up_submits | Numerical type | Number of UP main submissions | 52 |
| 16 | Up_grand | Numerical type | UP Main Level | 7 |
| 17 | Up_view | Numerical type | Playback volume after 24 hours | 117264 |
There may be non-conforming data in the acquired data, so it has to
be pre-processed by removing weights, missing values and data
normalization. In this paper, equation 1 is used to
normalize the data.
In order to reduce the computational dimension and improve the model
prediction performance, feature selection is used to screen the
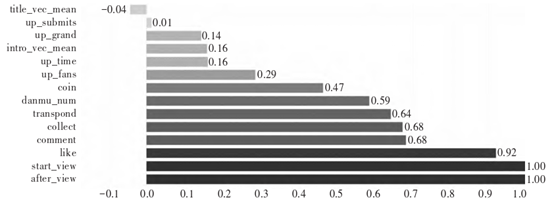
features, this paper adopts the Pearson correlation coefficient for
feature selection, for the feature variables x and y in the data can be
obtained through experimentation for a number of groups of data, denoted
as
where
is an unsupervised machine learning algorithm, which is essentially a
classification and prediction algorithm that builds Bagging integration
and combines stochastic subspace based on decision trees [23]. The basic idea is to use boos
trap sampling method to extract
Where
The XG Boost algorithm is based on the gradient boosting decision
tree to optimize the loss function and feature selection, which can
effectively construct the enhancement tree and run in parallel [24]. The idea of the algorithm is
to use the latter model to correct the error generated by the former
model, and continuously repeat to achieve the purpose of optimizing the
objective function, the overall model and the objective function can be
expressed as:
The LSTM neural network model is a special deformation of the recurrent neural network that improves on its tendency to have vanishing gradients and gradient explosions, allowing the network to achieve better results over longer data sequences [25].
In order to further judge the strength of the model, this paper uses
the goodness-of-fit
In this study, we use five-fold cross-validation to divide the
training set and validation set, and the RF model uses Grid Search CV to
achieve automatic parameter tuning to determine the optimal parameters
of the model are
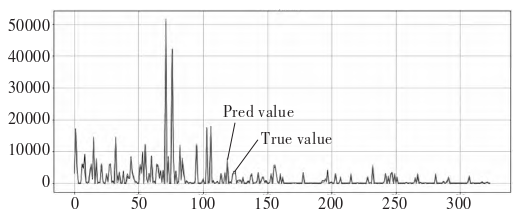
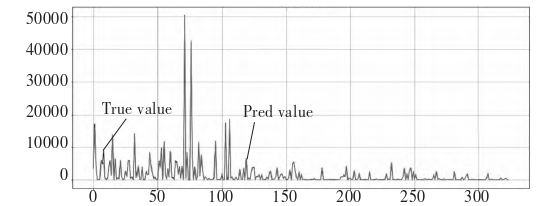
The LSTM neural network model requires more parameters to be adjusted, the target variable is normalized in the input layer according to equation 1, the dropout is set to 0.01 in order to prevent overfitting, MAE is used as the loss function, Adam is used as the optimizer for the model, the data training is set to be performed for 5000 epochs, and each time, 16 training data are used to perform the forward and back propagation, and the model achieves very good results after 80 epochs. The model achieves very good results after 80 epochs and Figure 4 represents the prediction results of the LSTM neural network model on the validation set.
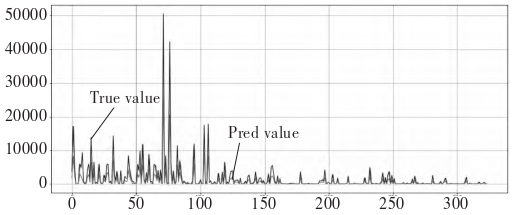
From Figure [f4], [f5] and 4, it can be seen that the curves of the
predicted and true values of the RF model and the XG-Boost model are the
closest to each other, and the error between the prediction result of
the model and the true value is smaller, and the model fitting effect is
better; the error between the prediction value and the true value of the
LSTM neural network model is bigger, and the model fitting effect is
poorer. As shown in Table 1, the RF model has a
| Data set | Model | MAE | |
|---|---|---|---|
| Test | RF | 0.968 | 215.917 |
| XG Boost | 0.953 | 227.608 | |
| LSTM | 0.702 | 883.702 |
On the basis of the RF algorithm for predicting the playback volume of pop-up videos, we select the video features and creator features to predict the video playback volume, and explore whether the video features have the greatest impact on the playback volume by comparing the evaluation indexes; secondly, the feature variables can be divided into numerical and textual features, and we compare the results of the experiments of predicting the playback volume by using the numerical and textual features, and predicting the video playback volume by using all the features. Secondly, the feature variables can also be classified into numerical and textual features, comparing the experimental results of prediction using both numerical and textual features with those using all features, and analyzing whether the textual features of the video can improve the prediction effect and the degree of influence on the video playback. The experimental results of different features are shown in Figure [f7].
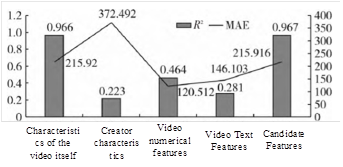
As can be seen from the figure,
Short videos are characterized by instant dissemination, short production cycle, wide range of contents, high netizen participation, free and flexible forms, easy sharing, etc. Carrying out service marketing activities relying on short videos can help to improve the knowledge, accessibility and acceptability of public cultural services, and is thus of great significance to enhancing the accessibility of public cultural services. Relying on the short video marketing “TRUST model” and combining the key elements of short video marketing of public cultural services, this study opens up a new marketing ecological perspective. Specifically, it can be laid out in the following five aspects to realize the whole process of user focusing, linking, attracting, expanding and retaining, and thus enhance the accessibility of public cultural services. and accessibility of public cultural services.
The object of short video marketing of public cultural services is users, and different types of users have different degrees of matching public digital cultural preferences and needs, which, if generalized, will result in the loss of some users or difficulty in attracting users. At the same time, short videos of public cultural services have wide and broad content, but a large number of different types of short videos of public cultural services are piled up, lacking in attributes such as recognition, characterization and specialization, thus making it difficult to attract the target group and maintain user stickiness. Therefore, only by deeply ploughing into the vertical segmentation of short videos of public cultural services and accurately focusing on the target audience can we improve the suitability of video content and users and achieve the goal of focusing on users. The specific measures are mainly divided into the following two aspects: First, customize the exclusive IP for short videos of public cultural services. Creating a number of exclusive IP for short videos on public cultural services, secure both the vertical consistency of a user’s IP and the short video content it publishes, as well as the IP’s focus on a particular niche. For example, “Fan Deng Book”, “Little Zhu History Lesson”, “Culture Reddit”, according to the IP, you can know its specific content, so as to focus on the target users. Second, customization the exclusive content of public cultural service short videos. User demand for public cultural service short videos is broadly divided into information demand, entertainment demand and emotional demand, respectively, for different needs to customization different attributes of public cultural service short video content and continuous output, accurate radiation of different needs of users [26, 27, 28].
The content of the marketing of public cultural services is the prerequisite and foundation for the development of public cultural services, as well as the key to building strong relationships with users. Therefore, the short video marketing of public cultural services needs to create high-quality content, optimize the content production from the perspective of showing the quality of the short video content of public cultural services and enhancing the users’ experience of the short video content of public cultural services, so that the users can realize the transformation from “recognition” to “approval”, thus linking the users. Firstly, show the sense of quality of public cultural service short video content. In the creation of short video content for public cultural services, attention should be paid to returning to the value of the content itself and driving quality with value. From the treasure trove of Chinese cultural resources to refine the subject matter, get inspiration, draw nutrients, the Chinese outstanding traditional culture of useful ideas, artistic value and the characteristics and requirements of the times combined, from a variety of perspectives on the depth of the interpretation of the public cultural content, thick plant the public cultural works of the “cultural content”, and continue to launch a deep, nurturing heart We will also continue to launch a series of short cultural videos with deep content that will cultivate people’s hearts and minds.
The B station pop-up video is selected as the research object, comparing the advantages and disadvantages of traditional machine learning methods and deep learning methods in the prediction of pop-up video playback, and different features are selected for comparative experiments to explore the key factors affecting the video playback. The experimental results show that the RF algorithm is better than the XG Boost algorithm and the LSTM neural network model in predicting on the data base of this study, and the error of the prediction made by the LSTM neural network is relatively large. Using the RF algorithm to select different features for prediction, comparing the experimental results, we found that the features of the pop-up video itself have the greatest impact on the video playback volume, and the video text features only affect the video playback volume to a certain extent and the impact is small. In the subsequent work, we will deeply explore the comment and pop-up contents of videos and perform sentiment analysis on them as feature variables to extend the prediction model, and track and monitor the video playback data within a certain period of time, using time series data and applying the corresponding model to make predictions, so as to deeply explore the influence mechanism of video playback and the prediction algorithm.
This research was supported by the Higher Education of Social Science Research Program, Jiangsu Province, under the project code 2021SJA0552.
1970-2025 CP (Manitoba, Canada) unless otherwise stated.