Cities are highly concentrated areas of human civilization, the contradiction between urban development and resources and environment has become increasingly prominent. Inefficient use of energy and land resources, shortage of water resources, and environmental pollution are threatening the healthy development of cities. In this paper, the signal reconstruction algorithm and measurement matrix design in the compressed sensing theory are mainly studied. Aiming at the problems of green city environmental monitoring and landscape design, signal underestimation or overestimation caused by the fixed selection step in the iterative process of sparse adaptive matching tracking algorithm, The threshold idea is introduced into atomic selection, and a variable step size strategy is proposed based on the change of step size. The experimental results show that the establishment of the green city environment monitoring and landscape design model system dynamically changes the network topology, so that data can be transmitted in the mobile ad hoc network.
The British Industrial Revolution in the 18th century opened modern human life, but the distinctive feature of industrial civilization is that “humans transform nature and conquer nature”. The great development of world industrialization has pushed the activities of transforming and conquering nature to the extreme. A series of global environmental problems and ecological crises show that the earth can no longer support the sustainable development of industrial civilization. Human beings need to create a new form of civilization to continue life and development. This is ecological civilization. The construction of green cities is an important step in the construction of ecological civilization.
IoT technology is based on a variety of sensors, and these sensor terminals will obtain. The significance of data lies not only in the data itself, but also in the deep value rules discovered after data analysis and processing. The construction of a green city depends on the sensor network of the Internet of Things, which will inevitably obtain a large amount of monitoring data. The data collected by the green city ecological monitoring system, after being processed by artificial intelligence technology, can also be used for further research in the direction of human comfort.
In addition to incorporating new technologies and concepts into the green city, we should also attach importance to its core educational function in the design of green city functions. The establishment of a complete green city requires multiple green city smart systems, which can be well integrated into the innovative practice, curriculum design, cognitive practice, scientific and technological innovation, and other practical activities of professionals [1, 2, 3]. Under the educational background of encouraging cities to update their development forms and improving people’s innovation and practical abilities, the construction of green cities should be organically combined with people’s practical and innovative education. In short, green city construction based on new energy and Internet of Things has been in full swing. As for the key issues of green city design, China generally starts from the perspective of technology, and pays less attention to the perspective of education and teaching. Due to the above imbalance in the construction of domestic green cities, and in combination with the development background of vigorously promoting. While serving the learning and living, optimizing the urban operation and management functions, the green city can consider its educational purpose, so that people can form the concept of green development and improve their practical and innovative ability.
The Internet of Things (IOT), which can be understood as the extension of the network to the physical world and is widely used in environmental, military, medical and other fields. Through the cooperation between sensors, it can monitor and collect various physical information in the area and transfer the detailed and complete information to the required users after certain processing of the collected information. Sensor nodes in WSN usually form a network system in the form of self-organization. To reduce costs, sensor nodes usually use batteries to supply power, and do not replace batteries or add additional energy. Therefore, energy limitation is one of the bottlenecks that WSN must face. In addition, the limited resources will also cause the deployment scale and system life of WSN to be limited, resulting in a series of difficulties in use. Considering the shortage of WSN, the traditional WSN is usually optimized to achieve better monitoring effect when establishing an environmental monitoring network.
The green urban environmental monitoring and landscape design based on communication technology and Internet of Things sensing technology, and building relevant models, can improve the problem of high spatial and temporal redundancy between node data, save the cost of WSN establishment and maintenance, promote the construction of environmental monitoring network, and help the city develop faster and better.
It needs to coordinate the stable development of the three subsystems of economy, society, and environment. Many scholars have built an indicator system containing three subsystems based on these three dimensions [4]. Based on the economic, social, and environmental quality, the indicator system of transportation system for sustainable cities is constructed, which is composed of 9 specific indicators [5]. Through the combined dynamic evaluation method, three first level indicators of regional ecological background, urban evolution stage and urban comprehensive status and 24 second level indicators are constructed [6, 7]. The indicator system of urban green development transformation has been established, and the dynamic evaluation of the development process of 286 cities in China from 2005 to 2016 has found that the green transformation of Chinese cities began in a benign state in 2014 [8]. From these three dimensions, a green industry indicator system oriented to SDGs, consisting of nine indicators, has been constructed [9, 10]. For Beijing, a green Beijing indicator system consisting of three primary indicators of green production, green consumption, and ecological environment and 46 secondary indicators has been established.
According to the five subsystems of green environment, green development, green resources, green society and green management, a green city evaluation index system consisting of 29 specific indicators was constructed [11], and 9 prefecture level cities in Fujian Province were evaluated [12]. From the four aspects of building facilities, natural environment, public satisfaction and transportation system, 12 secondary indicators and 18 specific indicators have been established to evaluate the sustainability of the city, including land use intensity, energy efficiency, resource consumption, biodiversity, regional environment, energy environment, health, neighborhood and community, accessibility of equipment, housing affordability, private transportation, public transportation [13]. 88 indicators were constructed from 13 discrete themes, such as economy and population, energy, biodiversity, health, and education [14]. An index system of eco civilized cities has been established, which is composed of five dimensions of system guarantee, ecological human settlement, environmental support, economic operation, and cultural awareness, and 35 indicators.
A low-carbon development evaluation index system consisting of 6 categories and 13 specific indicators including carbon emissions, economic development, social progress, transportation, human settlements, and natural environment has been established [15, 16]. From economic development, social development, quality of life, environmental quality and resource bearing, a comprehensive evaluation, which is composed of 31 indicators [17]. An ecological civilization evaluation index system with 20 indicators has been established for the super large city, including four aspects [18]. A green Xiamen city evaluation index system has been established, which includes 32 indicators of population, resources, environment, and economic development [19]. From the aspects of air, water resources, energy utilization, land use, green buildings, green transportation, and resource waste, 16 urban sustainability indicators have been established through a four-step hierarchical fuzzy multi criteria decision-making method, and the weight coefficients have been allocated through expert scoring [20].
In conclusion, the research on green urban environmental monitoring and landscape design based on communication technology and Internet of Things sensing technology has a strong practical basis.
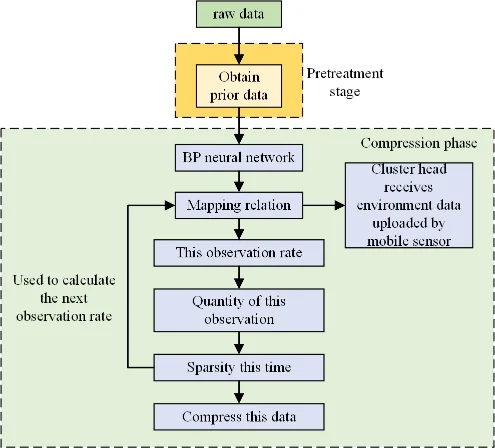
This section proposes a data acquisition algorithm of mobile sensor network based on compressed sensing for green city environmental monitoring and landscape design. This algorithm adjusts the real-time observation rate, and then adjusts the M value of the observation matrix to ensure accurate reconstruction of the original data [21]. In the mobile sensor network, the fixed sensor is the cluster head, which is responsible for compressing the data collected by the mobile sensor. After preprocessing, the mapping relationship among the number of mobile sensor nodes, data sparsity and observation rate are obtained. Then start the compression phase [22, 23]. The cluster head uses CS to compress and upload the received environment data, as shown in Figure 1.
Due to the large size of green city related data packets, the
original data is uploaded to the cluster head for compression. Cluster
heads use traditional compression sensing methods such as DCT transform,
binary sparse random observation matrix and OMP reconstruction algorithm
to calculate data sparsity and observation rate. At present, the objects
of urban environmental information collection are mainly temperature,
humidity and PM2.5. Such data have strong patio-temporal correlation and
change gently in adjacent areas, so it can be sparse by using Fourier
transform or difference matrix. In this chapter, DCT is used to sparse
represent the original data. The random binary sparse matrix is then
used as the observation matrix. Finally, OMP algorithm is selected to
reconstruct the data. The above process is analyzed in detail. Through
DCT transformation, the original data is transformed from time domain to
frequency domain to obtain a group of sparse vector values. For
one-dimensional data, the equation of DCT transformation is:
With the increasing order of green city environmental monitoring and
landscape design models, many positive and negative offsets will occur
when natural signals are projected onto the base. When n=0, the above
equation can be converted to d0=
Similarly, the second coefficient and the third coefficient after
discrete cosine transformation can be obtained, as shown in Eq.
The wireless environmental sensor network of green city environmental monitoring and landscape design model, which can realize the monitoring of environmental indicators. Each environmental sensor is the core of the system, and often has certain information processing capabilities. To adapt to different environmental areas, the sensor nodes used in the actual scene usually adjust in terms of hardware and structure, but usually have five modules, namely power module, embedded software system, processor module, sensor module and wireless communication module. The structure is shown in Figure 2.
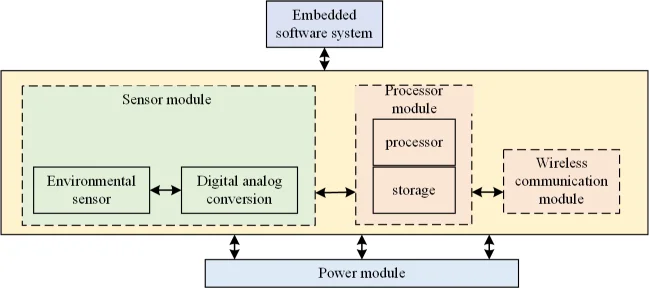
Considering that in the application scenario of green city environmental monitoring, sensor nodes need to be deployed in the target area, and from the perspective of cost, it is difficult to charge the deployed sensor nodes. Therefore, the power supply, sensor, communication, and other modules in the system are required to have good reliability and be able to maintain good cooperative characteristics in a complex and changing environment.
In addition, the green city environmental sensor network is usually composed of four parts: environmental sensor node, basic communication network, sink node and remote management terminal. Its structure is shown in Figure 3. The environmental sensor node is usually responsible for signal acquisition, processing, and transmission, and uses self-organization to form a network. The data in the sensor network can also be transmitted to the sink node via multi hop routing, which is also called Sink node. Compared with sensor nodes, sink node has more abundant resources, can achieve data aggregation and integration, and can connect with the Internet to send the collected data to the remote server. On the contrary, the end user can also send instructions to control the work of the network, master the level of environmental indicators in the target area in real time, and make corresponding judgments in time.

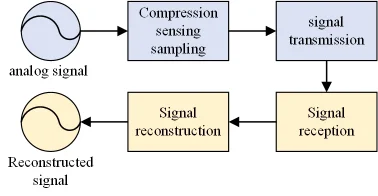
The principle of compressed sensing sampling for green city environmental monitoring and landscape design model is shown in Figure 4. On the premise of sparse original signals, first sparse representation is performed, then low-speed sampling is performed, and the signal dimension is reduced through the designed measurement matrix to obtain measurement values. The signal in the transmission and reception process is already a reduced dimension signal, so the process requires less hardware. If the compressed signal is to be used, the signal can be accurately recovered through signal reconstruction. This process effectively reduces the sampling rate requirements in the sampling process and has a wide application space.
The measurement matrix usually has the following forms, such as Eq.
According to the above description, the reconstruction problem of the
original signal can be converted into the optimization problem of the
norm, as shown in Eq.
In a word, the process flow of compressed sensing of green city environmental monitoring and landscape design model is as follows: first, convert the original signal into a sparse form, as shown in Figure 5.

In the previous comparative studies on the standard system of green ecological urbanization, there were many international comparative studies on the evaluation standards of “green buildings” at the micro scale, while the international comparative studies on the evaluation standards of urban areas, blocks and communities at the mesa scale were very limited, and most of the few pairwise comparative studies were limited to the specific contents of the evaluation standards. However, our research reveals that the construction of green ecological cities is a complex systematic project. To improve the research methods and theoretical tools of green eco city, this paper applies the concepts, theories, viewpoints and methods of systems science and systems engineering to build a “green eco city system model” from three dimensions of “goal criteria”, “structure organization” and “operation mechanism”. Based on this, the author designed a set of summer experiments to study the impact of different residential facade colors, whether there is vertical greening on the west side of the building, roads with different materials, whether there is sunshade, and different greening combinations on the thermal comfort of residential blocks. The test plan Table 1 is as follows:
| Test No | Test name | Test object | Test purpose |
| 1 | Contrast test of climate suitability of different color residential building facades | Dark facade Light color facade | Influence of different color residential building facades on thermal comfort of residential blocks |
| 2 | Contrast tests the climate suitability of building west wall with or without shading and greening | Sunshade greening on the west wall The west wall is green without shading | Influence of West Wall Sunshade on Thermal Comfort of Residential Block |
| 3 | Contrast tests the climate suitability of different pavement materials |
asphalt pavement Granite pavement
concrete pavement Brick pavement Permeable grass planting pavement Wooden pavement Greenland |
Influence of different road surfaces on thermal comfort of residential blocks |
| 4 | Comparative test of climate suitability of different greening combinations | Greenland Green space shrubs | Influence of Different Greening Combinations on Thermal Comfort of Residential Blocks |
| 5 | Contrast tests the climate suitability of the parking space with or without shading facilities |
Green space+shrub+arbor Sunshade is set in parking space
The parking space is not provided with sunshade |
Influence of Parking Space Covered Canopy on Thermal Comfort of Residential Block |
Based on the connotation of green city and the principle of indicator construction, from the perspective of green production, green life and environmental quality, The three subsystems are further decomposed into 11 secondary indicators, as shown in Table [2].
| Level I indicators | Secondary indicators | Third level indicators | Indicator code | Company |
| Green production | resource utilization | Water consumption per unit GDP (-) |
|
M3/10000 yuan |
| Economic output of construction land per unit area (+) |
|
10000 yuan/km2 | ||
| CO2 emissions per unit GDP (-) |
|
T CO2/10000 yuan | ||
| Utilization rate of unconventional water resources (+) |
|
percentage | ||
| pollution control | Ammonia nitrogen emission per unit GDP (-) |
|
Kg/10000 yuan | |
| Emission of COD per unit GDP (-) |
|
Kg/10000 yuan | ||
| NOx emissions per unit GDP (-) |
|
Kg/10000 yuan | ||
| Sulfur dioxide emission per unit GDP (-) |
|
Kg/10000 yuan | ||
| Industrial solid waste output per unit GDP (-) |
|
T/10000 yuan | ||
| Hazardous waste disposal rate (+) |
|
percentage | ||
| Domestic garbage harmless treatment rate (+) |
|
percentage | ||
| Green traffic | Public transport vehicle parc per 10000 people (+) |
|
Standard unit/10000 people | |
| Coverage of public transport stops within 500m (+) |
|
percentage | ||
| Road network density in built-up area of central urban area (+) |
|
Km/km2 | ||
| biodiversity | Biological abundance index (+) |
|
percentage | |
| Proportion of natural reserve area (+) |
|
/ | ||
| atmospheric environment | Days of good air quality (+) |
|
day | |
| Acoustic environment | Average value of traffic trunk noise (-) |
|
Decibel | |
| Urban form | Compactness (+) |
|
/ |
In the green production subsystem, 12 quantitative indicators are selected from the two key directions of urban resource utilization and pollution control. Among them, there are six indicators representing resource utilization, namely, water consumption per unit GDP. The indicators of this dimension are mostly combined with the gross regional product of the city, so as to more truly and objectively reflect the green production level of the city.
In addition, the outdoor air and water quality sensor node has no interrupt request part in the workflow, which is relatively simple. Taking the air monitoring system as an example, its workflow is shown in Figure 6. The sensor node mainly completes the data collection, processing and sending, and enters the data collection after joining the network. The processing process requires adding temperature compensation to the sensor, it is necessary to encapsulate the data, that is, add the ID information of the sensor node. When there is data in the sending buffer, query whether the status flag bit is 1.
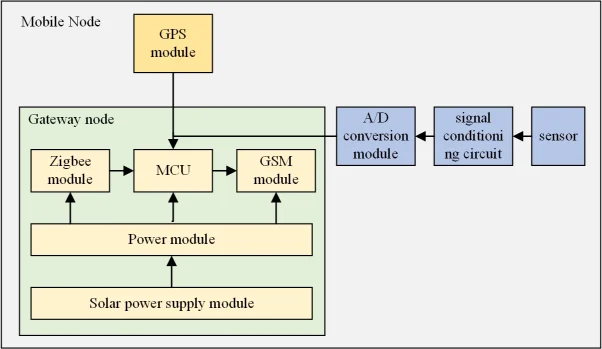
After the whole system of green city environmental monitoring and landscape design is powered on, the gateway node initializes and establishes a star topology network, waiting for the sensor node to join the network. Like the sensor node, the gateway node is also divided into monitoring mode and control mode. Under normal circumstances, the controller of the gateway node receives the monitoring data transmitted by the wireless communication module, processes it and forwards, the controller considers that an interrupt request has been generated. At this time, the controller module stops receiving the data transmitted by the wireless communication module, responds to the interrupt request and executes the corresponding interrupt service program. The controller sends the control signal to the wireless communication module, and then to the sensor node corresponding to the ID.
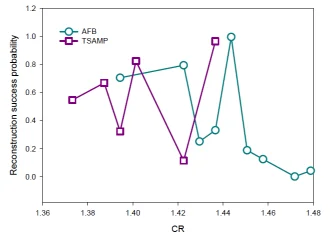
To fully verify the correctness and effectiveness of the reconstruction of the improved algorithm of green city environmental monitoring and landscape design model, two groups of experiments will be carried out, which are the comparison between TSAMP algorithm and classical algorithm, as well as the effect of the improved algorithm in recent years. The signal shall be one-dimensional random signal with a length of 256. The principle of control variable method shall be followed, the measurement number length is 128. When the measurement number changes, the sparsity is set as 20. The measurement matrix is Gaussian matrix and Bernoulli matrix. First, compare the effectiveness of TSAMP algorithm with OMP algorithm, Stomp algorithm, SAMP algorithm and SP algorithm, and use different measurement matrices. The success probability under the condition of sparsity change is shown in Figure 7. Each algorithm reconstructs 1000 times, and the calculation method of success probability is: number of successful reconstructions/1000.
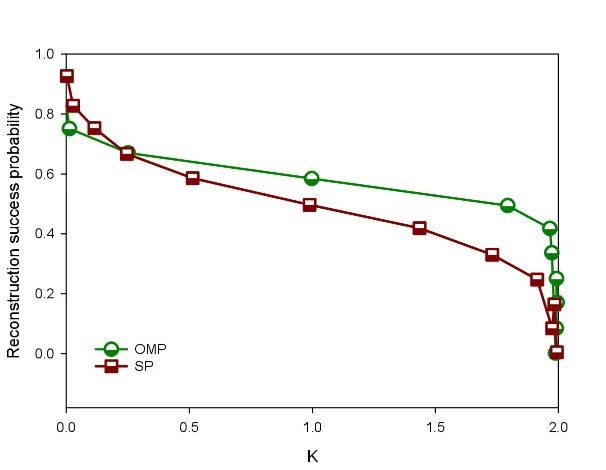
When K
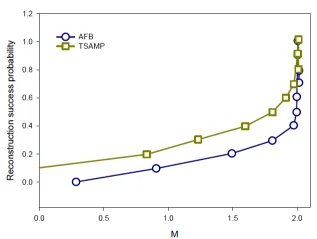
Figure 9 is the relative error of the five algorithms
is minimal because the order of magnitude of the relative error is
Suppose that there are 100 green city monitoring areas, each of which is measured by the same 100 mobile sensor nodes, and the result error value and RMSE can be obtained. The following is the comparison chart of experimental results. The error curve of SM algorithm has obvious fluctuations compared with the calibration algorithm proposed in this chapter and the Network Graph Model calibration algorithm. The more mobile sensors participate in the calibration of SM algorithm, the better the accuracy of sensor data calibration can be. In SM algorithm, the absolute value of most errors is more than 0.5, and some errors are more than 2. The error of the calibration algorithm in this chapter is about 0.0749, and the error of the SM algorithm is 0.7689. Because the error of the Network Graph Model calibration algorithm is about 0.1104, the calibration algorithm in this chapter should be more accurate, as shown in Table 3.
| Average Error value | Average RMSE | Average number of mobile nodes | |
|---|---|---|---|
| Our Calibration model-d | 0.0749 | 0.1015 | 9.85 |
| SM model | 0.7689 | 0.8754 | 9.85 |
| Network Graph model | 0.1105 | 0.1283 | 6.95 |
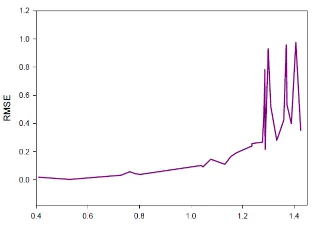
Figure 10 shows the trend of RMSE as the number of areas increases, which the root mean square error curve of SM algorithm is quite different from the calibration algorithm proposed in this chapter and the Network Graph Model calibration algorithm, indicating that the stability of the latter two algorithms is better than SM algorithm. The root means square error of the calibration algorithm proposed in this chapter and the Network Graph Model calibration algorithm is less than 0.2, the calibration algorithm in this chapter is still more stable than the SM algorithm. In conclusion [24], the calibration algorithm proposed in this chapter is superior to SM algorithm and Network Graph Model algorithm, that the average number of mobile sensor nodes selected by the calibration algorithm proposed in this chapter in the preprocessing stage is about 9.8 in 100 regions, while the number of network graph models is about 6.9.
Suppose that there are 100 monitoring areas in the green city, and each area is measured by an indefinite. The result is shown in Figure 9. It can be seen from Table 4 and Table 5 that the average number of mobile sensor nodes selected by SM algorithm and the calibration algorithm in this paper in the preprocessing stage of 100 regions is about 10.6, while that of the Network Graph model is about 6.9.
| Average Error value | Average RMSE | Average number of mobile nodes | |
|---|---|---|---|
| Our Calibration model-d | 0.1024 | 0.1204 | 10.57 |
| SM model | 0.7452 | 0.8572 | 10.57 |
| Network Graph model | 0.1105 | 0.1283 | 6.95 |
| Node | Temperature( |
Humidity(%) | PM2.5 |
||
|---|---|---|---|---|---|
| 1 | 10.2 | 27.5 | 144 | 621 | 89 |
| 2 | 11.1 | 29.1 | 195 | 651 | 89 |
| 3 | 10.6 | 27.6 | 156 | 611 | 91 |
| 4 | 10.7 | 28.1 | 183 | 641 | 89 |
Table 6 describes the calculation in the calibration dynamic region and the static region, where the purple represents, as shown in Figure 10
| region | Mobile Node | Total nodes | region | Mobile Node | Total nodes | region | Mobile Node | Total nodes | region | Mobile Node | Total nodes |
| 1 | 10 | 98 | 2 | 9 | 99 | 3 | 10 | 92 | 4 | 12 | 91 |
| 5 | 12 | 95 | 6 | 8 | 91 | 7 | 9 | 98 | 8 | 9 | 97 |
| 9 | 14 | 92 | 10 | 13 | 96 | 11 | 12 | 95 | 12 | 7 | 97 |
| 13 | 10 | 91 | 14 | 11 | 99 | 15 | 10 | 91 | 16 | 6 | 95 |
| 17 | 12 | 99 | 18 | 9 | 98 | 19 | 12 | 99 | 20 | 11 | 91 |
| 21 | 9 | 99 | 22 | 8 | 98 | 23 | 9 | 99 | 24 | 11 | 97 |
| 25 | 16 | 91 | 26 | 9 | 95 | 27 | 9 | 90 | 28 | 13 | 98 |
| 29 | 8 | 95 | 30 | 9 | 99 | 31 | 6 | 97 | 32 | 15 | 96 |
| 33 | 14 | 97 | 34 | 14 | 96 | 35 | 13 | 93 | 36 | 10 | 98 |
| 37 | 7 | 97 | 38 | 7 | 98 | 39 | 14 | 91 | 40 | 13 | 99 |
| 41 | 13 | 93 | 42 | 14 | 97 | 43 | 14 | 94 | 44 | 11 | 91 |
| 45 | 15 | 93 | 46 | 10 | 93 | 47 | 8 | 97 | 48 | 11 | 92 |
| 49 | 5 | 96 | 50 | 11 | 99 | 51 | 8 | 99 | 52 | 15 | 95 |
| 53 | 19 | 99 | 54 | 8 | 99 | 55 | 3 | 91 | 56 | 15 | 95 |
| 57 | 6 | 96 | 58 | 11 | 97 | 59 | 7 | 99 | 60 | 21 | 96 |
| 61 | 13 | 93 | 62 | 20 | 96 | 63 | 5 | 91 | 64 | 16 | 92 |
| 65 | 9 | 98 | 66 | 6 | 99 | 67 | 9 | 96 | 68 | 12 | 99 |
| 69 | 11 | 97 | 70 | 13 | 93 | 71 | 7 | 93 | 72 | 11 | 95 |
| 73 | 16 | 95 | 74 | 10 | 97 | 75 | 3 | 95 | 76 | 13 | 93 |
| 77 | 14 | 100 | 78 | 7 | 95 | 79 | 16 | 95 | 80 | 12 | 97 |
| 81 | 9 | 99 | 82 | 9 | 99 | 83 | 9 | 93 | 84 | 10 | 99 |
| 85 | 5 | 100 | 86 | 13 | 91 | 87 | 10 | 93 | 88 | 15 | 94 |
| 89 | 9 | 91 | 90 | 15 | 90 | 91 | 11 | 93 | 92 | 10 | 99 |
Green urban design is the inevitable trend and direction of urban development. As an important part of the city, residential block design under the concept of green urban design is particularly important. Aiming at the application of green city environmental monitoring and landscape design, this paper combines wireless sensor networks with compressed sensing technology, and proposes an environmental grid data reconstruction algorithm, which can reconstruct the complete environmental signals in the region through a limited number of random location sensors, improve the life of the system, and help promote the promotion and popularization of environmental monitoring systems.
Fund project: Local innovation teams with industry-leading talents of “Haiyou Plan”. Project source: The People’s Government of Jinan Municipality. Project Name: Exploration of Park City Planning Paths in the Context of Big Data and New Technologies. Project No.: Jinan Municipal Government [2023] No. 8
The authors declare no conflict of interests.
1970-2025 CP (Manitoba, Canada) unless otherwise stated.