Low efficiency and poor accuracy are caused by missing data in traditional 3D reconstruction methods. This study suggests a new 3D point cloud recognition technique for substation equipment based on 3D laser scanning point clouds, which combines the k-nearest neighbour (KNN) classification algorithm and particle swarm optimisation (PSO) algorithm, to address these issues. The particle swarm optimisation algorithm optimises the coefficient weights of each subspace feature. The k-nearest neighbour classification algorithm is then used to finish the classification. To confirm the superiority and accuracy of the suggested approach, the impact of the point cloud subspace’s size and loss rate on the recognition effect is examined experimentally and contrasted with the enhanced iterative nearest point algorithm. With an average recognition time of 0.19 seconds and a recognition accuracy of over 95\%, the experimental results demonstrate the method’s good performance in terms of efficiency and accuracy, opening up a wide range of potential applications.
The development of laser scanning technology has made 3D point clouds a crucial tool for gathering real-world scenes. Nonetheless, a popular topic in recent research is how to effectively use 3D point cloud data for equipment management and identification [1, 2, 3]. The high requirements for data integrity in traditional 3D reconstruction methods make it difficult to achieve ideal results in real scenes, which hinders their widespread application in power systems [4].
The safe and steady operation of the substation’s equipment is essential to the dependability of the entire power grid because it is a vital link in the power system that facilitates the transmission and distribution of electric energy. The quantity and complexity of substation equipment are growing along with the power system’s scale. The manual inspection method used in the traditional equipment management approach has numerous drawbacks, such as low efficiency, high cost, ease of miss-take, etc.
Researchers both domestically and internationally are currently devoting a great deal of time to studying substation equipment’s 3D identification technology. suggested an algorithm that employs a 3D laser to gather point cloud data about the equipment, improves the Ada Boost algorithm with a support vector machine for identification, and simulates the results to confirm the algorithm’s superiority. The findings demonstrate that there is good recognition accuracy with training and testing accuracy of over 98%. In order to identify device point cloud data, [5] suggested a Hough voting algorithm. To determine the targets’ similarity, the distance histograms in the model library were compared. The similarity threshold is used to determine the initial recognition results. [6] describes how to use a panoramic camera and a 3D scanning system to get multi-angle scene photos and point cloud data of outdoor equipment and substations. Using Autodesk 3d-Max tools, the substation equipment, buildings, and the surrounding terrain environment are modelled in a 3D scene in accordance with predetermined modelling standards. [7] suggested an early warning system that uses UAVs and laser scanning to detect the surroundings of substations intelligently.
Nonetheless, there are still certain obstacles to be solved in the field of 3D point cloud recognition of substation equipment. One such issue is missing data, where the actual 3D point cloud data that have been collected are frequently absent, particularly in some intricate areas of the equipment surface. It is imperative that the missing data be handled and the model’s ability to adjust to partial data be improved . Due to the variety of device shapes and materials, one of the difficulties in designing a generic and accurate recognition model is recognition accuracy. Targeted processing might be necessary for various equipment types and conditions. Real-time requirements: It’s crucial to monitor equipment status in real-time in power systems. More effective algorithms and models are required because traditional approaches might not be able to meet the demand for quick response to equipment changes [8].
In this paper, we propose a PSO algorithm combined with kNN classification algorithm for 3D point cloud recognition of substation equipment, aiming to solve the issues in traditional methods based on 3D laser scanning point clouds. To increase classification accuracy, we optimise the coefficient weights of every subspace feature in the point cloud data by implementing the particle swarm optimisation algorithm.
The following are some benefits of the 3D point cloud recognition technique presented in this paper, which is based on the kNN classification algorithm and PSO algorithm:
Efficiency: The point cloud data’s features are optimised through the introduction of the PSO algorithm, which raises the classification’s accuracy and efficiency.
Generality: The model can be customised to fit various kinds and shapes of equipment thanks to the combination of the kNN classification algorithm.
Experimental evidence: Based on numerous experiments, the approach suggested in this paper outperforms the conventional iterative nearest point algorithm in terms of efficiency and recognition accuracy.
The subspace feature of the point cloud is the cosine value of the angle between the centre of mass of the entire point cloud and the line connecting the centres of mass of each subspace point cloud with respect to the positive direction of the Z-axis. This allows for the identification of the 3D point cloud of substation equipment. The subspace is divided according to the point features, and the features of the subspace are extracted to form the feature vector. The PSO algorithm is used to optimise the coefficient weights of each subspace feature, and the kNN is used to obtain the classification results.
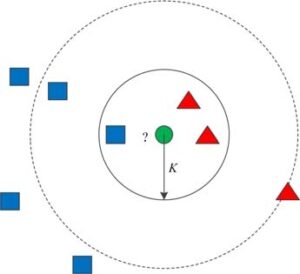
The kNN algorithm’s basic idea is that a sample is included in a
category if it has
The kNN algorithm’s classification is influenced by the value of

The test data is input and the distance between the features of the
test data and the features of the template is calculated to find the
Calculate the distance d between the test data T and the template data MT, and choose the Euclidean distance as shown in Eq. (1), [12]:
Sorting by distance, with
Determine how often each of the
In the test data’s predicted classification, the
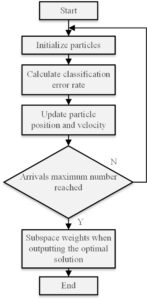
PSO is a global evolutionary heuristic algorithm for multi-objective, nonlinear, and multivariate problems that is based on group intelligence [1]. To find the optimal solution, the PSO algorithm iterates over the initial particles, updates the particle positions and velocities, and tracks the optimal particles in the space. Usually, reaching the desired number of iterations is the criterion for ending the iteration.PSO’s benefits of simple programming, quick convergence, and great accuracy make it a popular choice. The PSO algorithm is used in this paper to optimise the feature weights within each subspace. In Figure 2, the flowchart is displayed.

Modifying the coefficient weights of each subspace feature improves the recognition and classification accuracy of features. The classification error rate is defined as a fitness function when employing PSO to optimise the feature weights, and the final positions of the particles represent the weights occupied by the corresponding features. The following is the procedure for implementing an algorithm:
Set the particle’s initial position and speed.
Update the particle’s position and velocity in accordance with Eqs (2), (3) and (4), [14].
Calculate the fitness function according to Eq. (4).
Both global and individual optimality are being updated.
When the number of iterations is reached, you should stop and output the parameters [15]. Repeat steps 2) through 4) until the maximum number of iterations is reached if the number of iterations has not been reached.
Following the creation of the template feature library, the kNN algorithm is used to classify the devices and the PSO algorithm is used to optimise the weights of the coefficients of each subspace feature in order to increase the accuracy of classification and recognition. The computer has an 8GB RAM and an i5-2450m CPU. Matlab 2014 is the software for image processing.
100 test data points are the maximum number of iterations that the PSO algorithm can run. Circuit breakers (CB), current transformers (CT), disconnect switches (DS), earth switches (ES), lightning arresters (LA), voltage transformers (PT), traps (LT), etc. are among the substation equipment dimensions that are statistically displayed in Table 1, [2].
| Device Type | Length/m | Wide/m | High/m |
|---|---|---|---|
| 1.457 | 5.124 | 6.245 | |
| 1.326 | 1.368 | 6.128 | |
| 1.478 | 13.456 | 8.256 | |
| 1.568 | 3.856 | 5.678 | |
| 1.824 | 1.534 | 6.538 | |
| 0.985 | 1.002 | 6.035 | |
| 2.215 | 2.231 | 6.854 |
Three factors are examined in order to confirm the algorithm’s superiority: 1) the impact of the point cloud subspace’s size on recognition outcomes; 2) the impact of the point cloud’s absence on recognition outcomes; and 3) a comparison with the enhanced ICP algorithm.
In theory, the number of subspaces within the point cloud indicates the higher the dimension of the feature vector; conversely, the smaller the subspace of the point cloud, the smaller the side lengths of the subspace. In comparison to standard devices, the results of classification and recognition are more accurate, and vice versa [6].
The following describes how edge length affects various subspaces.
The point cloud data was normalised and all point clouds were scaled
using a
| Side length | Number | Before optimization | After PSO optimization | ||
|---|---|---|---|---|---|
| 1.01 | 55 | 70.03 | 0.065 | 83.25 | 33.02 |
| 0.9 | 126 | 79.32 | 0.035 | 88.26 | 45.01 |
| 0.6 | 252 | 79.85 | 0.025 | 88.25 | 62.08 |
| 0.5 | 432 | 78.06 | 0.028 | 88.06 | 91.85 |
| 0.4 | 960 | 88.12 | 0.032 | 95.34 | 120.18 |
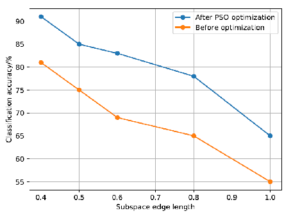
Before and after PSO optimisation, Table 2 computes the classification accuracy and time for various subspace sizes. Figure 3 displays the accuracy of classification both before and after PSO optimisation for various subspace edge lengths, illustrating the impact of subspace size on the classification outcomes.

Figure 3 demonstrate the notable improvement in classification accuracy following PSO optimisation. Although the PSO algorithm’s iterative process requires time, it can be utilised to optimise subspace feature weights and increase classification accuracy within a reasonable time frame. It is easier to have a “dimensional catastrophe” the shorter the edge length, the more subspaces there are overall, and the larger the feature vector dimensions.
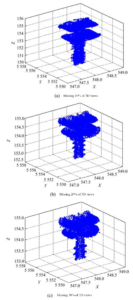
The paper analyses the point cloud missing performance of the identification methods. Ideal point cloud data is acquired by the substation apparatus. Using a circuit breaker as an example, the text states that 10%, 20%, and 30% of cloud data are lost at random points in time. As seen in Figure 4, the aforementioned three cases are recognised and categorised using the identification technique described in the paper. It can be correctly identified when 10% or 20% of the data are missing, and incorrectly identified when 30% of the data are missing.

The point cloud was missing too much to be satisfactorily identified, and the method used to conduct the missing test for all test data resulted in an average identifiable missing rate of 13%. All test data has a minimum identifiable missing of 10%, with the majority falling within the 10%–13% range. Consequently, low point cloud missing occasions can be handled by the recognition method described in this paper.
The algorithm in the paper is compared with the enhanced Iterative Closet Points (ICP) algorithm to further demonstrate the algorithm’s efficacy. Based on the traditional ICP algorithm’s higher alignment accuracy, the improved ICP algorithm makes use of the projected contour pre-selection model, which drastically cuts down on recognition time and is currently one of the more effective recognition techniques available. Table 3 displays the recognition results. The subspace has a side length of 0.4 and requires the recognition of 100 point cloud devices.
| Device name | Improve ICP | Method in the text | ||
|---|---|---|---|---|
| Yes | 82.05 | Yes | 0.15 | |
| Yes | 56.67 | Yes | 0.18 | |
| Yes | 150.86 | Yes | 0.22 | |
| Yes | 130.54 | Yes | 0.25 | |
| Yes | 92.56 | Yes | 0.19 | |
| Yes | 71.25 | Yes | 0.22 | |
| Yes | 126.85 | Yes | 0.20 | |
| … | … | … | … | … |
| Accuracy | Average | Accuracy | Average | |
| 98.25% | 85.32% | 97.21% | 0.20 | |
Asshown in Table 3, out of the 100 point cloud devices that needed to be identified, 98 were correctly identified by the improved ICP identification method, with only 2 incorrectly identified. With an accuracy of 97.00%, the paper correctly identified 97 devices and incorrectly identified 3. Regarding the algorithm’s recognition time, the suggested method takes one second, while the enhanced ICP takes more than a minute. The suggested method has a faster and more accurate recognition rate, making it perfect for real-world applications.
This study proposes a 3D point cloud recognition method for substation equipment based on the particle swarm optimisation algorithm and the k-nearest neighbour classification algorithm. The method performs better in experiments than the conventional iterative nearest point algorithm, with higher recognition accuracy and faster processing speed. This approach has potential applications in the real world and can help advance power system equipment management. In order to better meet the needs of power system equipment management, future research can further optimise the algorithm, expand the scenarios that are applicable, and improve real-time performance. However, the challenges of handling complex scenarios and improving data robustness still need to be solved in practical applications.
This paper is sponsored by Science and Technology Project of State Grid Shandong Electric Power Company“ Research and application of key technologies for panoramic operation and maintenance of digital twin substation” (520626220009).
The authors declare no conflict of interests.
1970-2025 CP (Manitoba, Canada) unless otherwise stated.