
With the continuous popularization of computers and networks, electronic office has become a common phenomenon. my country’s electronic bills were born as early as November 2009. At the same time, the country is also continuously implementing the electronic management of financial bills [1]. There are many defects in traditional paper bills. For example, there are fake and cloned tickets that are difficult to identify. Special personnel are required to deposit, deliver, and collect tickets [2]. At the same time, the information on bills is scattered and difficult to manage and monitor. Under many problems, the advantages of electronic bills are obvious. which is conducive to preventing risks in the bill market and improving the efficiency of bill transactions. For enterprises and individuals, it is also convenient for the storage and arrangement of bills and rapid retrieval [3]. However, since its birth, electronic bills are still in the development stage, and paper bills still occupy the vast majority of the market. With the popularization of online office, online billing and other workflows, the demand for electronic paper bills is growing [4]. But at present, this kind of work is still being processed manually, which requires the staff to manually input the information on the paper invoices into the computer to do the follow-up work. This is an extremely labor-intensive and boring process. The work is replaced by artificial intelligence, that is, using computer technology to intelligently perform structured identification of bills, use cameras, scanners, etc. to obtain bill images, intelligently extract bill text information in the image, and filter out the available information according to needs. , is the difficulty in solving this problem, and requires the help of image processing, OCR text recognition, table structure analysis and other technologies [5,6].
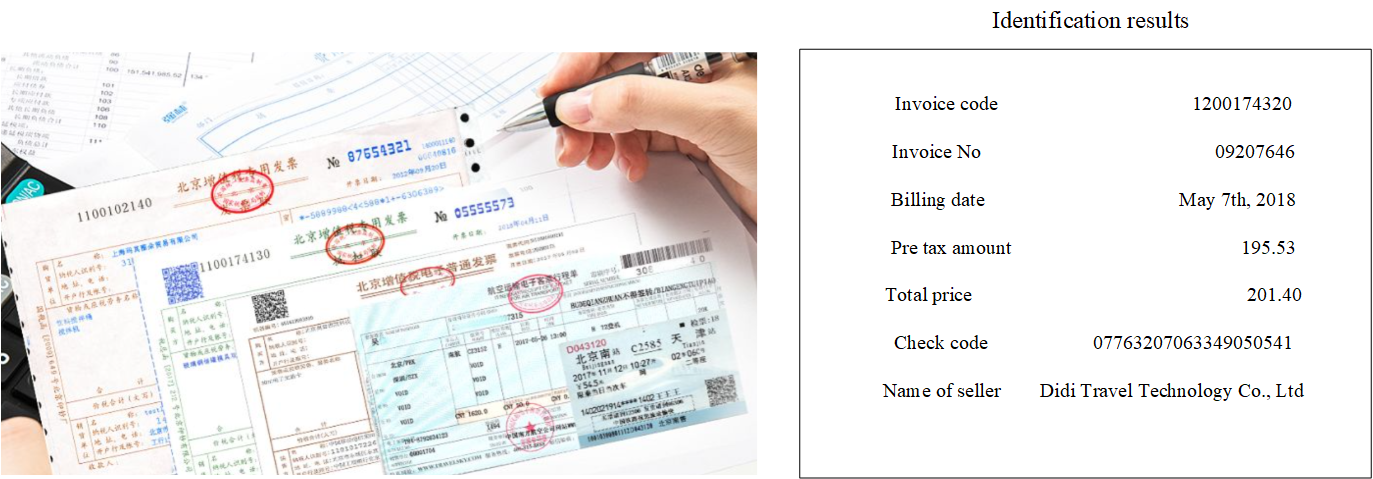
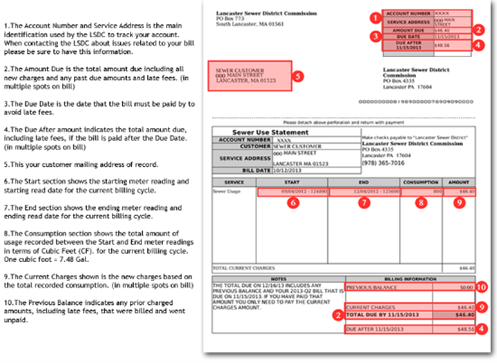
Structural recognition of bills refers to the process of converting paper invoices into text images through optical devices such as scanners or cameras, extracting text information from these images, establishing structural relationships between texts, and extracting the required key information [7,8]. The realization of this task is based on OCR technology, which converts image information into text information through OCR technology, but its special feature is that the text in the bill contains unique structural information, such as different attributes such as header, unit, and seal. different table items also have their corresponding text content [9,10]. The structural recognition of bills requires structured analysis of the bill format, including the spatial layout and logical layout of the text. For the starting place, date, name, etc., the invoice code, invoice number, invoice date, etc. in the VAT invoice (as shown in Figure1). In the industrial world, ABBYY, Tesseract, etc. abroad contain similar document analysis functions. Domestic companies such as Alibaba, Tencent, Baidu and some start-ups can provide cloud services for bill recognition, including train ticket recognition, VAT invoice recognition, itinerary recognition, single recognition, custom template recognition and other services. In the academic world, ICDAR2019 has added a competition on scanning receipt OCR and information extraction, which shows that this demand has attracted more and more attention.
This paper focus on mainly VAT invoices, VAT electronic ordinary invoices, general machine-printed invoices, roll-type invoices, fixed-value invoices, unified sales invoices for motor vehicles, data invoices supervised by the provincial Ministry of Finance, Passenger service tickets, etc. In recent years, the constraints of these bills have become more and more standardized, and most of them are issued by machine.
On the whole, the layout of the ticket can be regarded as two parts, one part is the fixed information field, that is, some standard printing meta-information; the other part is the variable information field, which is usually printed by machine inkjet, or directly. It is written by the relevant business party [5]. Most of the bills to be identified are tabular bills, and the valid information area is delineated by some table frame lines. The organization of the information is not fixed. There are also a few bills of simple key-value pair type, which are generally strip-shaped, and a very small number of card-type bills, which have a large degree of layout freedom and no explicit frame line constraints.
In addition to the above feature information, there are some additional auxiliary information on the bill page, which is very helpful for information extraction and type identification, such as two-dimensional code, barcode, seal, etc [11]. Two-dimensional codes and barcodes themselves carry some information. Generally, the codes on the layout of the bills with a relatively short issuance time can still identify a lot of useful information. On the contrary, if the issuance time is relatively long, it is necessary to conduct optical analysis for a lot of layout content information. In terms of content information, each type of bill has some key field attributes that need to be extracted, such as the serial number of the VAT invoice, the buyer’s company or personal name, details of goods or taxable labor services, unit price, total amount, tax amount, sales Party company or personal name, payee, biller, etc. Enterprises need to extract this part of the information and store it in a structured database to facilitate future business queries and financial data aggregation analysis [12,13].
The content information of the bill page is generally many and complex. For corporate finance, two types of data are mainly treated differently: amount data and non-amount data [14,15]. Non-amount data, such as transaction detail field data, usually do not have excessive requirements, and a small amount of text errors can be tolerated, as long as the overall understanding and recognition are not affected, the requirements can be met. The amount data is relatively more rigorous. The formulation of the company’s balance sheet is usually based on these financial documents. If there is an imbalance of assets and liabilities, it is necessary to re-check and enter the relevant amount transaction fields in order to achieve loan purpose of balance.
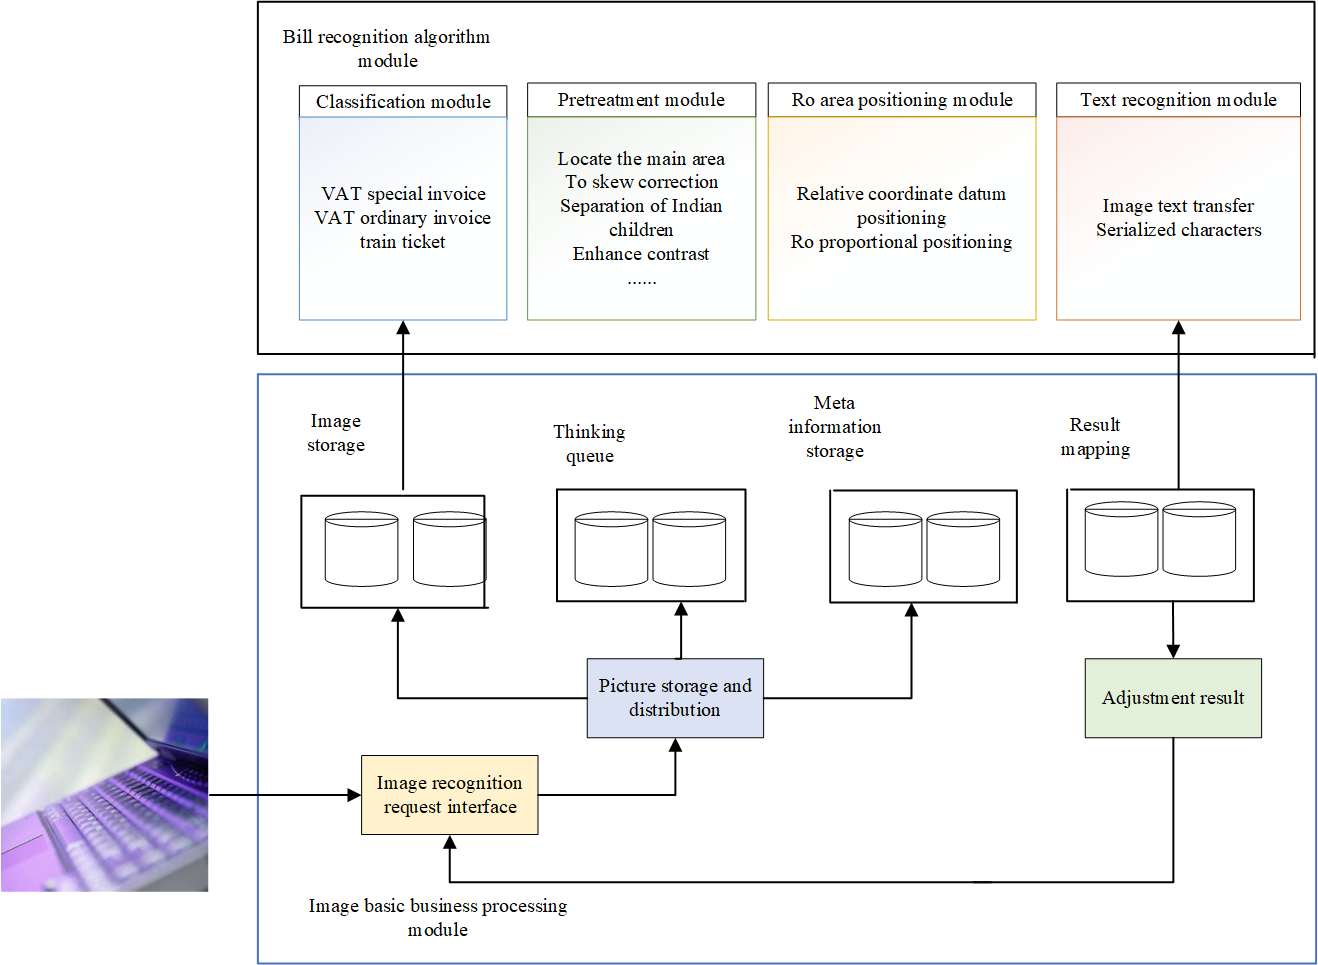
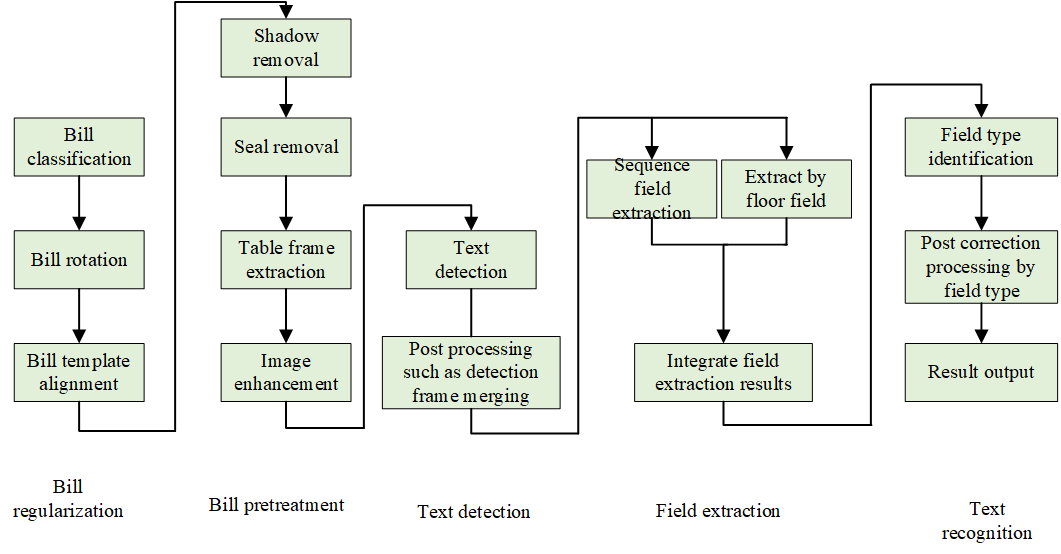
For the identification of financial bills, the overall framework proposed in this paper is shown in Figure2.
Whether it is a picture taken by a camera or a picture scanned by a scanner, there is a common problem, that is, there are many irregular blank parts outside the border of the bill, and this part of the blank is not useful for identification [16,17]. Therefore, this part needs to be left blank, leaving only the main part of the note. To achieve the purpose of removing white space and retaining key areas, you can follow the following four steps: find the edge contour of the image, filter the extracted contour to obtain the maximum covering contour, and calculate the coordinates of the four vertices of the maximum covering contour, Perspective transformation. Connecting these four steps in series can obtain the “minimum wrapping rectangle” of the ticket image, that is, the main area of the ticket.
Before extracting edge contour lines, it is necessary to perform grayscale processing and Gaussian filtering processing on the image. Grayscale processing is used to reduce the amount of information processing and focus on morphological features. The calculation method adopted is usually the weighted average method. The Gaussian filtering process is mainly to remove some Gaussian noise on the image, which is mostly caused by the lighting and other reasons when taking pictures. When filtering out noise, a two-dimensional Gaussian filter function is often used. In the actual processing process, first determine the Gaussian convolution kernel that conforms to the characteristics of the Gaussian filter function in the above formula 1, and then use the pixel value of the input image as a weight to perform a convolution and addition operation. After binarizing the image and Gaussian filtering, the Canny edge detection can be performed on the image.
The Sobel operator is used here to first calculate the gradient value of a pixel on \({{G_x}}\) and \({{G_y}}\) ,A more fine-grained bearing value is then calculated from these two values \(\theta\).
\[\label{e1} \theta = arctam\left( {\frac{{{G_y}}}{{{G_x}}}} \right).\tag{1}\]
The second step is to filter non-maximum values. After Gaussian blurring of the image, the edge will be enlarged. At this time, some non-edge points need to be filtered out to make the edge width as one pixel unit as possible. Since the edge gradient direction has been calculated above, now only need the gradient value of the pixels in the neighborhood range in the gradient direction. In the third step, upper and lower thresholds are specified to detect edges [18]. The third step is essentially a supplement to the second step. In practical applications, it is more desirable to be able to determine two upper and lower thresholds, so that the pixel values higher than the upper threshold are directly determined as edge pixels, and the pixels lower than the lower threshold are directly determined as edge pixels. It is directly judged as a non-edge pixel, and the judgment standard between the upper and lower thresholds is to judge whether it is adjacent to the edge pixel. If so, it is still judged as an edge point, otherwise it is a non-edge point.
So far, the valid wrapping contour point set of the bill image is obtained, and then the coordinates of the four vertices of the wrapping bill image need to be found. Here, the Hough transform is firstly performed to detect the straight line, and then the exclusion and screening are carried out according to the criteria of intersection, not too adjacent, and quadrilateral formation, and finally the coordinate information of the four vertices that meet the constraints is obtained.
Finally, a coarse-grained ticket constraint image can be obtained through perspective transformation. Perspective transformation is not like general rigid body similarity transformation or affine transformation, and its transformation degree is greater. First of all, let’s briefly understand the principle of affine transformation. Usually, affine transformation can be regarded as the superposition of linear transformation and translation transformation. Expressing the above expression in matrix form is:
\[\label{e2} \left[\begin{array}{l} u \\ v \end{array}\right]=\left[\begin{array}{l} a_1 b_1 \\ a_2 b_2 \end{array}\right]\left[\begin{array}{l} x \\ y \end{array}\right]+\left[\begin{array}{l} c_1 \\ c_2 \end{array}\right].\tag{2}\]
\[\label{e3} R=\left[\begin{array}{l} a_1 b_1 \\ a_2 b_2 \end{array}\right], t=\left[\begin{array}{l} c_1 \\ c_2 \end{array}\right], T=\left[\begin{array}{l} R \\ t \end{array}\right].\tag{3}\]
Among them, \(R\) is the linear transformation matrix, \(t\) is the translation matrix, \(T\) is the affine transformation matrix. It can also be seen from the coordinate mapping expression that the affine transformation is a standard linear transformation. The transformed graphic line is still a straight line, and the relative positional relationship between the lines remains unchanged. The transformation degree of freedom is the linear transformation degree of freedom plus translation transformation. degrees of freedom, a total of 6 transformation degrees of freedom.
In contrast, perspective transformation, its transformation process is to first project a two-dimensional image onto a 3D plane, and then convert the image of the 3D plane to 2D coordinates. Similarly, the above expression is expressed in matrix form as:
\[\label{e4} \left[\begin{array}{l} X \\ Y \\ Z \end{array}\right]=\left[\begin{array}{l} a_1 b_1 c_1 \\ a_2 b_2 c_2 \cdot \\ a_3 b_3 c_3 \end{array}\right]\left[\begin{array}{l} x \\ y \\ 1 \end{array}\right].\tag{4}\]
The matrix representing the perspective transformation characteristics is \(\left[ {{a_3}{b_3}{c_3}} \right]\),The rest of the transformation matrices are still composed of linear transformation and translation transformation. It can also be seen that the dimension of perspective transformation is higher than that of affine transformation [19]. Next, you only need to convert the expression in three-dimensional space back to two-dimensional coordinates.
From this, the corrected image after perspective transformation can be obtained. Perspective transformation can generate a new quadrilateral, but it is not necessarily a parallelogram. It has a total of 8 degrees of freedom. Affine transformation can be regarded as a subset of perspective transformation. Let’s take a look at the performance of perspective transformation in actual document processing.
There are many reasons why the bill image is blurry and difficult to identify. Therefore, it is necessary to perform high-pass filtering or other inverse operations on the image to enhance the edge of the image information area. It is to make the image more recognizable and distinguishable.
For high-pass filtering, it is mainly to use a suitable spatial domain sharpening filter to sharpen the original image. Spatial filtering can be briefly defined as \(M \times N\). The sliding convolution operation is performed on the image \(f\) using the filter of \(m \times n\). The meaning of the above expression is still similar to the convolution, the filter \({w_1}\) slides on the image \(f\), the overlapping part uses the filter coefficient and the original image pixel to multiply, then the corresponding bits are added, and finally the value is assigned to the center coincident position.
The Laplacian operator can just meet the above filter selection requirements. It is an isotropic filter with rotation invariance, which can enhance the edge region of the grayscale mutation in the image, generate a grayscale mutation image, and finally A sharpened image can be obtained by superimposing the obtained grayscale mutation image with the original image.
Observing the discrete transformation expression, it can be found that the processing process is still simple addition and subtraction operations using the pixel values in the neighborhood, so this expression can be used to abstract the filter kernel that conforms to the characteristics of the expression, and finally the image space domain volume is performed. Product filtering.
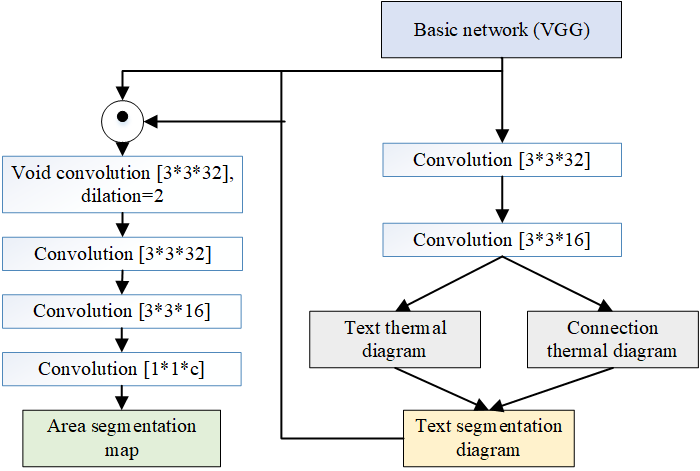
Based on the above text detection methods, this paper proposes a DL-based bill recognition method, which performs text detection and bill recognition in an end-to-end manner, which is more concise and intuitive. Because the text distribution of the same kind of bills has a certain regularity, and the differences between different bill types are large [20]. The type of bill recognition branch uses the feature extraction ability of the text detection model and the text detection heat map to learn the distribution law of key regions, assigns attribute labels to each pixel in the image, and obtains segmentation maps of different key regions. The network is in Figure 3, where the basic network and the text detection branch are common to all types of bills, and the left area segmentation part combines the text segmentation map with the feature layer that fuses multi-scale information, through 1 layer of hole convolution with a hole rate of 2, and 2, finally a convolutional layer with a convolution kernel of 1 to obtain a region segmentation map, where C is related to the number of key regions contained in the ticket.
Due to the great differences in shape and other characteristics between different languages, in order to make the text detection model suitable for this scene, it needs to be trained on the Chinese data set. This paper uses SynthTextHl3, a classic scene text synthesis method Annotated Chinese dataset. The difficulty of synthesizing text and images in a scene is how to better integrate the text and the scene, which needs to be based on the understanding of the image scene. Because the text appearing in the scene is usually in a complete area, so first use gob. The UCMn21 method obtains the semantic information in the image, obtains the segmentation map belonging to the same semantic area in the image, limits the synthesized text to the same semantic range, and then uses the scene depth estimation method to judge the distance of each pixel in the scene image, because the real the direction and shape of the text appearing in the scene are related to the surface objects. By estimating the depth of the scene graph, the RANSAC algorithm is used to fit the normal vector of each semantic segmentation area, so that the text and the scene can be guaranteed when the text is filled in the corresponding area. The angle transformation relative to the camera remains consistent. The Chinese dataset generated in this way not only has character-level annotation information, but also ensures the requirement of the neural network for the amount of annotated data.
In the part of the ticket recognition model, a total of 392 train ticket datasets are constructed in this paper, of which about 262 are training sets and 130 are test sets. First, use the text detection model to obtain the feature extraction results and text detection results, and then assign category information to each text box in the text detection through manual annotation, that is, the category information of all pixels in the text box, for text that does not belong to key fields The pixels in the frame area and the background area, in order to balance the category imbalance, this paper assigns these two types of pixels to different categories, so the DL results contain a total of 8 categories. For the input information of the extraction model, that is, the intermediate layer results of the detection model, this paper zeroes all the background features in the detection results, and suppresses the sure non-critical areas to ensure better DL results.
The bill recognition method based on DL comes from the improvement of the text detection method, and a new branch is added on the basis of the text detection model, so this paper adopts a progressive training method. Since the text detection part of the entire network structure is a common structure for various types of bills, this paper firstly trains the text detection model separately, and obtains the text detection model suitable for Chinese through the character-level Chinese synthetic data set introduced in the previous chapter in a supervised learning way. The detected text detection model, its loss function is as Eq.5.
\(S_r^*\) and \(S_a^*\) represent the value of each pixel on the real text area heatmap and text connection heatmap, respectively, \({S_r}\) and \({S_a}\) represent the two results predicted by the model, and \({S_c}\) represents the confidence of each pixel, when supervised learning Its value is fixed at 1.
\[\label{e5} L = {\sum _p}{S_c}\left( p \right) \cdot \left( {||{S_r}\left( p \right) – S_r^*\left( p \right)||\frac{2}{2} + ||{S_a}\left( p \right) – S_a^*\left( p \right)||\frac{2}{2}} \right).\tag{5}\]
After the text detection model is obtained, the second step is to train the bill type-sensitive bill identification model. The input of the bill identification model depends on the feature extraction results of the text detection model and the text area detection results. To do fusion, filter the features of non-text areas, and then continue to send the intermediate results of the text detection model into the bill recognition branch. The information is the classification result of the pixel level, and each pixel is given its regional attribute. Since the number of pixels belonging to different regions in the image is very different, in order to overcome this imbalance of samples, this paper uses a special cross entropy loss. As the loss function of the network, a certain weight is given to the pixel according to the attributes and area of the area to which the pixel belongs. The specific calculation is as shown in formula 5, that is, the ratio of the area to which the pixel belongs to the total image is counted. The smaller the number of pixels in a certain category, the greater the weight of its loss function, so that the model learning is more focused on the key field area with a smaller proportion.
\[\label{e6} {w_i} = \frac{s}{{{B_i}}},{B_i} = {\sum _{x \in {i^x}}}.\tag{6}\]
The overall loss function of the model is:
\[\label{e7} L\left( {{x_i}} \right) = – {w_i}\log {f_i}\left( {{x_i}} \right) = – {w_i}*\log \frac{{{e^{xi}}}}{{{\sum _{j{e^{xj}}}}}} = – {w_i}*\left( {{x_i} + \log {\sum _{j{e^{xj}}}}} \right).\tag{7}\]
For the text detection model, the dataset is a synthetic 800,000 scene text images containing Chinese characters, the training image size is set to 768*768, the training optimizer adopts the Adam optimizer, the learning rate adopts the step size decay strategy, and the initial value is 0.0001 and decays by 0.8 every 10,000 steps of training. For the ticket recognition branch, this paper uses the same dataset as the previous section for training. For the train ticket image, the image size is unified to 800*500, as shown in Table 1.
| OS | Ubuntu 16.04 |
|---|---|
| CPU model | Inter Xeon (R) cpue5-2620 dual core processor |
| CPU model | 2.2GHz |
| System memory | 128G |
| CPU | NVIDIA Quadro P5000 |
| GPU memory | 16G |
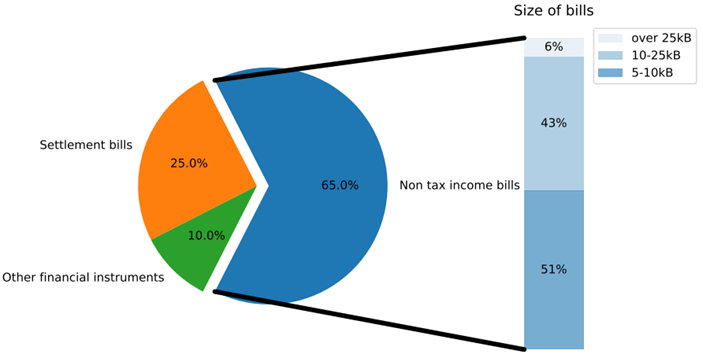
Further, we give the detailed information of the analyzed bill data, as shown in Figure 4.
The method in this chapter is based on the principle of DL, but the ultimate goal is to identify the text area. To facilitate the comparison between methods, this paper uses the pixel-level classification results to classify text regions by counting voting. First of all, all text regions have been obtained in the text detection model. In these determined text regions, this paper counts the categories of all pixels in the region, and takes the category with the most pixels as the category of the text box, using such the method converts the DL results into the bill recognition results in the same format as the method described in the previous chapter, so the final result evaluation index is still the same as the previous chapter. Table 2 and Figure 5 shows the results of the DL-based ticket recognition method on the train ticket data and the comparison results of the ticket recognition recall rate of 6 key fields on the train ticket image.
| Training set | Test set | |
|---|---|---|
| Recall rate | 92.07% | 89.35% |
| Precision rate | 91.56% | 89.35% |
Figure 6 shows some visualization results of the middle feature layer shared by the text detection model and the bill recognition model (there are 32 feature layers in the experiment). It can be seen that different feature layers reflect completely different image features of the image, and the receptive field is relatively. The feature abstraction of the global text distribution is larger when it is large, and there are also character-level feature abstractions that focus on local.
It can be seen from the above results that although the results of the train ticket data based on the DL method are worse than that of the sequence model, it is still much higher than the fixed template matching method. It occupies a large weight, resulting in a high recall rate and a low accuracy rate of the positive class in the experimental results, and it is easy to judge the non-critical area as the key area. It can be seen that the loss function adopted by the bill recognition model is not very reasonable, and there are still ways to optimize. Due to the limitation of the training data set, the fitting ability of the model that is too small is insufficient, and the model that is too large leads to the phenomenon of over-fitting.
Table 3 shows the comparison results of the overall accuracy and efficiency of the two bill recognition methods proposed in this paper. The overall accuracy rate is that all key field areas in a ticket image are detected, that is, the recall rate is 1 as the standard. Compared with the sequence model-based ticket identification method described in Chapter 3, the DL-based ticket recognition method. The accuracy of the recognition method is relatively low, but due to the computational advantages of the convolutional neural network structure over the recurrent neural network structure, the segmentation model performs better in terms of efficiency, and its speed is about 2 times that of the sequence model.
| Whole sheet accuracy | Time (each) | |
|---|---|---|
| Sequence model | 365/393 | 0.0285s |
| Segmentation model | 326/393 | 0.0142s |
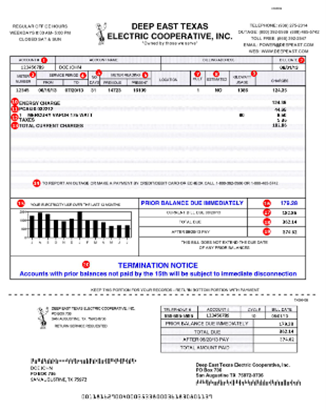
In this paper, the 479 VAT invoices in the collected invoice data set are structured to mark the invoice information, that is, the final text information corresponding to each key field. These invoices include two types of scanning and shooting. Carry out experimental verification. The above chapters mainly introduce and experimentally demonstrate the key parts of the bill structuring method, and Figure 7 shows the overall flow chart of the bill structuring method implemented in this paper (in the two bill recognition methods introduced in the above chapters respectively) The first sequence model method is used here), which includes five steps: bill regularization, bill preprocessing, text detection, field extraction and text recognition. This paper implements a complete bill structure recognition process. Since the text recognition method is not studied in this paper. Figure 8 shows the recognition results of some VAT invoices, in which the area in the red box represents the recognized key text area, and the text under the red box is the key text information in the invoice obtained by text recognition. Table 4 shows the accuracy results of invoice structure recognition for 8 key fields on 479 VAT invoices.
| Price | Name of seller | Seller identification number | Buyer’s name | Date | Invoice No | Invoice No | Check code | |
| Accuracy | 92.84% | 88.96% | 96.68% | 93.94% | 96.11% | 97.74% | 86.02% | 73.45% |
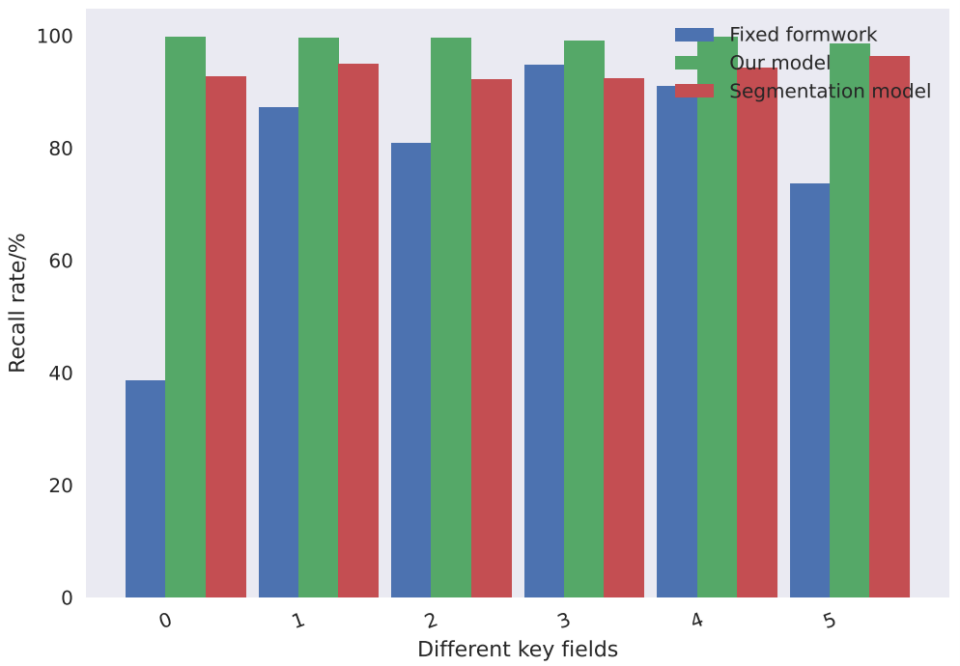
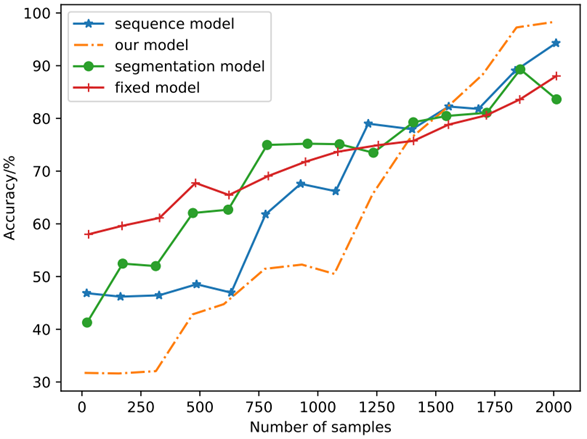
We further analyzed the accuracy difference between our deep learning model and other models in bill recognition. The specific results are shown in Figure 9. It can be seen that with the increase of training samples, the accuracy improvement of our model has significant changes, and finally the optimal performance is achieved.
In view of the above situation, this paper proposes a document recognition method based on DL. Through the preliminary information of the feasibility of feature extraction of the text analysis model and the text segmentation diagram, the tool is recognized from the perspective of text control. On the basis of text testing, a document recognition branch is added, which performs the task of text detection and extraction in the model. Through experiments, text modeling and document recognition are gradually trained, which shows the effectiveness of this method, and a complete structured document recognition process is carried out on the basis of self-adjusting data set.
This work was supported by 2022 Social Science Planning Project of Shandong Province. (Project Title:Research on government innovation subsidy promoting innovation quality improvement of Shandong enterprises under the background of digital economy; Project Number: 22CGLJ33).