
In recent years, in order to promote the construction of green infrastructure in cities and to assess the perception of green spaces, the visual green index has become one of the standard indicators for evaluating urban green spaces, which is used to guide the planning and design of green spaces such as urban parks and streets[1]. The concept of green index was first introduced by Japanese scholar Yoji Aoki and is defined as “the proportion of green in a person’s field of vision”[2]. It is an indicator that allows people to visualise the level of greenery in a city, as it is closely related to the visual and psychological perception of people[3]. As one of the regular criteria in the evaluation system of urban green landscape gardening, studies have been conducted on the factors influencing the green ratio and its impact on street landscape gardening, environmental comfort and human psychological perception[4].
In the practical application of green sight rate, some problems have gradually emerged. As the green sight rate is measured based on the field of view plane, its vegetation percentage does not reflect the real level of visible green in the space surrounded by human eyes[5]. At the same time, indicators such as the shooting angle and lens focal length of the photographs on which the statistical green sight rate is based are subjective and uncertain, which can have a certain influence on the assessment results[6].
Panoramic photography, which has emerged in recent years, is a photographic technique that uses specific equipment or software to obtain a panoramic view of the landscape, capturing a 360° panoramic image around the camera and giving the viewer an immersive effect. Panoramic images are usually obtained directly by using a multi-lens camera, or by post-processing ordinary cameras to create a panoramic image, and are now widely used in areas such as web landscape gardening services, panoramic VR and photographic displays[7]. Panoramic images have become a new source of data in the study of green view rate. [8]obtained landscape garden images from Tencent Map through a web crawler, and for each point, acquired flat images in four directions, front, back, left and right, to evaluate the green view rate and obtain the average value.[9] used a Python script to call the map API to download images in batches, and downloaded the landscape garden images in the four directions of the front, back, left and right of the sampling points, and converted the landscape garden images into HSV colour space, extracting the green parts of them for green view rate calculation[10].
However, current research has used landscape garden maps to analyse indicators such as the amount of greenery in urban streets, mainly by intercepting the range of views along the street from the landscape garden panorama. Such methods are still essentially based on a two-dimensional view plane, rather than a full panoramic spherical extent[11]. Therefore, this study proposes to start with the analysis of the complete panoramic image and to achieve direct identification and measurement of the panorama by means of an isoprojective transformation. The calculation of the green view is usually carried out using the grid method, where vegetated areas in the image are artificially identified and their ratio to the grid area is calculated[12]. The corresponding panoramic green percentage is obtained by calculating the number of squares occupied by green plants as a percentage of the total number of squares. This method is simple and easy to use for small amounts of data, but there is a certain amount of subjectivity due to manual intervention and it is difficult to process quickly when faced with large amounts of data. In recent years some researchers have proposed new ideas for the calculation of the green view rate[13-15].
Deep learning (DL) refers to learning the intrinsic laws and levels of representation of sample data so that machines can have the same analytical learning ability as humans and can recognise data such as text, images and sound[16]. At present, deep learning has gained wider application in the field of artificial intelligence technology[17]. With the development of deep learning techniques in recent years, a series of open source convolutional neural network (CNN) models for semantic segmentation of images have emerged. This study analyses and compares existing CNN models commonly used in landscape gardening to identify vegetation parts in panoramic images to automate the calculation of green view rate[18].
Based on the panoramic image, this study proposes a methodological step to calculate the panoramic green view rate, including panoramic image acquisition, panoramic image projection transformation, visible vegetation area calculation.
Panoramic images can be acquired in 2 ways: by conventional cameras and by multi-lens panoramic cameras.
A conventional camera is used to photograph each sample point and take pictures at the same angle every other time along the horizontal direction, so that the preliminary images are combined with multiple visual angles of the sample point. In other words, the photos are combined according to the visual characteristics[19]. However, this method is complicated and requires post-processing.
Using panoramic filming equipment, such as multi-lens panoramic cameras, to obtain panoramic images directly. With the development of VR and the video industry, panoramic equipment is becoming more and more widely used and direct filming with panoramic cameras will be a future trend[20].
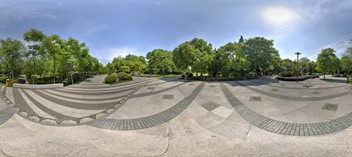
The panoramic image obtained by a panoramic camera or associated equipment is generally an equirectangular projection. The projection spread is a 2:1 rectangular image. In an equirectangular projection, areas with equal projected areas do not have equal true areas[21]. In order to make the area of the panoramic image measurable, it is necessary to convert it into a cylindrical equal-area projection for calculation. This is done by first converting the original equidistant cylindrical projection to spherical coordinates and then converting the spherical coordinates to the equivalent cylindrical projection [22].
An equidistant cylindrical projection is a projection in which the cylindrical projection plane is parallel to the earth’s axis, and a network of warp and weft lines is projected onto the cylindrical plane under the condition that the length of the warp lines remains constant, and then dissected and flattened along one of the bus bars. These projections have latitudinal and longitudinal intervals equal to the field, and the meridians and latitudes are shown as equidistant parallel lines perpendicular to each other [23] (Figure 1).
Equation for converting isometric cylindrical projections to spherical latitude and longitude coordinates:
\[\label{e1} \lambda = {x_1}/\left( {\cos {\phi _1}} \right) + {\lambda _0},\tag{1}\]
\[\label{e2} \phi = {y_1} + {\phi _1},\tag{2}\] where \(\lambda\) is the longitude of the location of the fixed point in spherical coordinates, \(\phi\) is the latitude of the location of the fixed point in spherical coordinates, \({\phi _1}\) is the standard latitude line in spherical coordinates, \({\lambda _0}\) is the central longitude line in spherical coordinates, \({x_1}\) is the horizontal coordinate of the equidistant cylindrical projection position, and \({y_1}\) is the vertical coordinate of the equidistant cylindrical projection position.
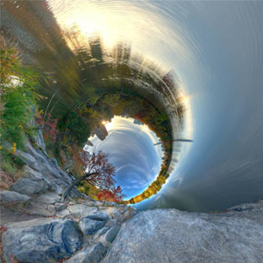
The isometric cylindrical projection is transformed to produce a panoramic sphere (Figure 2).
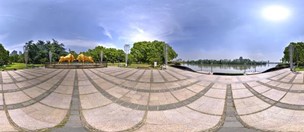
The equiprojected cylindrical projection is a projection on a cylinder tangent to the equator of the panoramic sphere under the condition of equal area, where the meridians are equidistant parallel lines and the latitude lines are parallel lines perpendicular to the meridians and at intervals that decrease in spacing with increasing latitude (Figure 3).
Equation for converting a panoramic sphere to an equiprobable cylindrical projection.
\[\label{e3} {x_2} = \left( {\lambda – {\lambda _0}} \right)\cos {\lambda _0},\tag{3}\]
\[\label{e4} {y_2} = \sin \phi /\cos {\lambda _0},\tag{4}\] where \(\lambda\) is the longitude of the location of the panoramic sphere, \(\phi\) is the latitude of the location of the panoramic sphere, \({\lambda _0}\) is the central meridian of the panoramic sphere, \({x_2}\) is the horizontal coordinate of the equiprojected cylindrical position, and \({y_2}\) is the vertical coordinate of the equiprojected cylindrical position.
Once the panoramic image has been converted into an isometric cylindrical projection, the relative area of its parts can be obtained by directly measuring their projected areas. The panoramic green percentage is calculated from the ratio of the vegetation area in the equiprojected image and is given by.
\[\label{e5} \text{panoramic green view} = \left(\frac{\text{area of vegetation in the isoprojected image}}{\text{total area of the isoprojected image}}\right) \times 100\%.\tag{5}\]
Vegetation area in projected images is usually calculated using the grid method, but it is time-consuming when faced with large amounts of data. In order to achieve automatic recognition of green view, some studies have used image processing software such as GNU Image Manipulation Program and Adobe Photoshop to set thresholds based on RGB or HSL channels and filter and extract their green pixel information for calculation as the vegetation part [24]. However, due to differences in lighting conditions, the presence of non-green areas such as plant stems, and interference from other green items, relying solely on colour information is often not an accurate representation of the plant range. This study attempts to use a neural network model based on semantic segmentation to automatically identify vegetation areas in panoramic images in order to achieve an objective and accurate batch calculation of green extent. The results are also compared and analysed with the traditional manual discrimination method for calculating the green view rate [25].
Neural network models are mathematical models that analyse, learn and parse data by simulating the way human brain neurons process information. CNN are a type of feedforward neural network and are widely used in image recognition, usually consisting of a fully connected layer at the top, one or more convolutional layers and a pooling layer [26].
Neural networks for image processing need to go through five major steps: image pre-processing, image compression, image feature extraction, image segmentation and image recognition [27], and have the following characteristics: fast processing speed; strong adaptive ability; can build mathematical models to analyse image information; can handle non-linear problems in images; can pre-process noise or impurity data in images, etc [28].
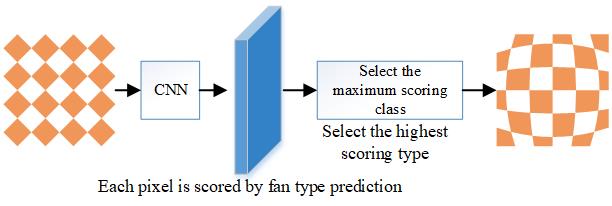
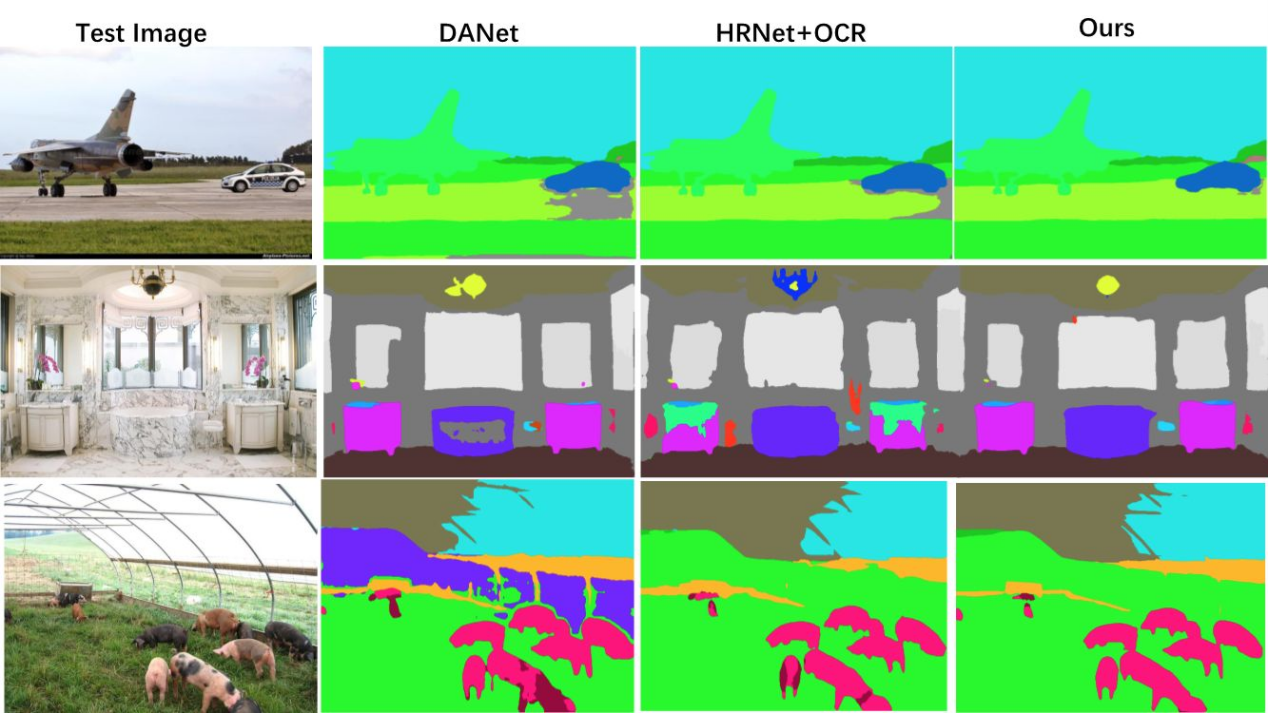
Semantic segmentation is a common operation in image analysis, describing the process of associating each pixel of an image with a type of label (e.g. flower, person, road, etc.) (Figure 4), which is commonly used in areas such as autonomous driving, industrial monitoring, remote sensing image classification, and medical image analysis.
SegNet’s semantic segmentation architecture preserves the index of the pooling layer when the encoder portion of the image is downscaled, allowing the integrity of high frequency details to be maintained in the segmentation[29]. Compared to other semantic segmentation networks, this architecture is trained by convolutional operations and is a lightweight network with fewer parameters. In this paper, we train a semantic segmentation model of riverfront images based on the SegNet network structure for the riverfront greenway landscape garden, and classify the riverfront greenway landscape garden labels into 13 categories, namely grass, trees, water bodies, sky, barge, landscape garden structures, roads, vehicles, buildings, guardrails, bridges, people, and others (litter bins, warning signs, miscellaneous objects, etc.).
The flow of the image semantic segmentation (Figure 5) is as follows:
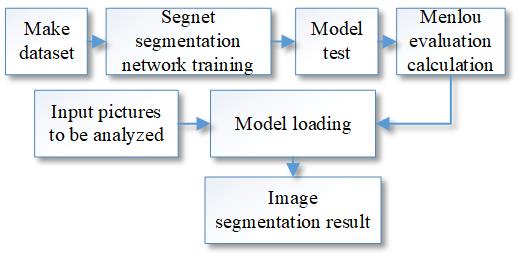
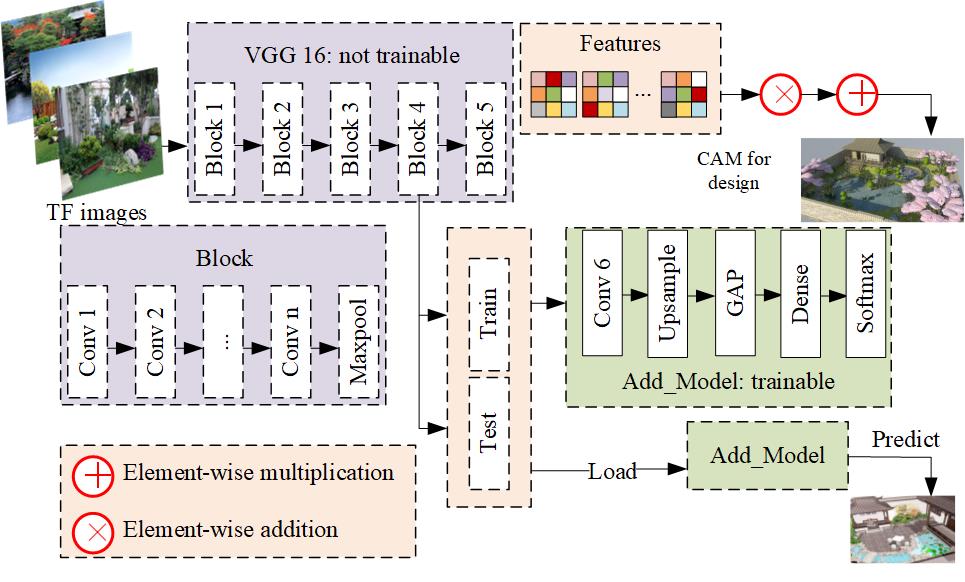
The model in this paper is shown in Figure 6, where the pixel points are classified and labelled. A dataset was generated by selecting 90 panoramic images of the riverfront and labelling them in matlab with 13 types of landscape garden element labels. The dataset was trained with SegNet segmentation network. After 100 generations of training, the accuracy of the model was verified according to Eq. (6) to (9), and the model was loaded to generate image segmentation results on the basis of the accuracy achieved.
\[\label{e6} {A_i} = \frac{{{P_{ii}}}}{{{P_{ij}}}}.\tag{6}\]
\[\label{e7} {\operatorname{IoU} _i} = \frac{{{P_{ii}}}}{{{P_{ij}} + {P_{ji}} – {P_{ii}}}}.\tag{7}\]
\[\label{e8} {\text{PA}} = \frac{{\sum\limits_{i = 0}^k {{P_{ii}}} }}{{\sum\limits_{i = 0}^k {\sum\limits_{j = 0}^k {{P_{ij}}} } }}.\tag{8}\]
\[\label{e9} {\text{MIoU}} = \frac{1}{{k + 1}}\sum\limits_{i = 0}^k {\frac{{{P_{ii}}}}{{\sum\limits_{j = 0}^k {{P_{ij}}} + \sum\limits_{j = 0}^k {{P_{ji}}} – {P_{ii}}}}} ,\tag{9}\] where, k is the total number of landscape garden tag categories, \({A_i}\) is the accuracy of true pixel category i, \({\operatorname{IoU} _i}\) is the total number of pixels of true pixel category i predicted\({{P_{ii}}}\)to category i, \({{P_{ij}}}\) is the total number of pixels of true pixel category i predicted to category j, \({{P_{ji}}}\) is the total number of pixels of true pixel category j predicted to category i, PA is the overall pixel accuracy, and is the average intersection ratio.
In planning guidance studies, multiple linear regression models are used to determine the closeness of relationships between multiple variables and hence the correlation[30]. Based on the results of selected landscape garden features and visual perception measures of the waterfront greenway, a multiple linear regression analysis model (Eq. (9) was constructed using the statsmodel software package in python to test the correlations between the ten evaluation criteria and the visual perception scores to investigate the extent to which each criterion influenced the visual perception results and the correlations between different landscape garden features and visual perception. The correlations between different landscape features and visual perception were investigated. On this basis, the data on the landscape gardens of the waterfront greenways of Beijing’s second ring water system were visualized in ArcGIS to analyze the spatial distribution characteristics of the riverfront landscape gardens and to propose future development suggestions.
\[\label{e10} y = {\beta _0} + {\beta _1}{x_1} + \cdots + {\beta _n}{x_n} + \varepsilon ,\tag{10}\] where, y is the visual perception score, \({\beta _0},{\beta _1}, \cdots ,{\beta _n}\) is the regression parameter, x is the impact factor and \(\varepsilon\)is the residual.
In this study, the five convolutional neural network models provided by the Wolfram Neural Net Repository were selected for MXNet-based encapsulation to recognize and classify different objects in panoramic images, and the recognition results of each model were compared for vegetation.
On March 6, 2019, panoramic images were taken on campus using the Garmin VIRB 360 panoramic camera and analysed for recognition by each of the above-mentioned convolutional neural networks, resulting in a full image resolution of \(5,640 * 2,820\) pixels. To improve the speed and efficiency of recognition, the images were compressed to a resolution of \(1 600 * 800\) pixels and converted to an isometric cylindrical projection image for recognition. To quantitatively assess the accuracy of each model’s recognition, the vegetation extent of the isoproduct panorama was manually identified and converted to a binary image for analysis using image editing software (Figure 7).
In general, for the identification of tree parts, the relevant neural network identifies all the area occupied by tree branches as vegetation parts, and does not classify the pores between branches and leaves, which results in a 5%-15% higher green view rate for each model than the manually calibrated data according to the traditional green view area discrimination method for panoramas with a large number of branch pores. However, the fact that the neural network does not recognise the smaller gaps in the vegetation reduces the effect of changes in leaf number, colour and morphology between seasons, thus maintaining consistency in recognition and assessment results between seasons.
The differences between the different models are mainly in the recognition of the near-field lawn and the top cover space; Ademxapp Model A1 is not accurate in the recognition of the far-field vegetation; Dilated ResNet-22 has a large error in the recognition of the vegetation in the cover space and incorrectly identifies some of the surface paving as vegetation, Multi- scale Context Aggregation Net model was not accurate enough to identify vegetation in the landscape and cover space. In order to quantitatively evaluate the accuracy of the calculation results of each neural network, the IoU of the green areas identified by each neural network was calculated using the manually identified vegetation areas as the standard data (ground truth).
Based on the results of the m IoU calculation (Table 1), the accuracy of each model in descending order was: Dilated ResNet-105>Dilated ResNet-38>Multi-scale Context Aggregation Net>Ademxapp Model A1>Dilated ResNet-22. Therefore, this study uses Dilated ResNet-105 to conduct an empirical study of green ratings measurement.
| Name of neural network | IoU-1 | IoU-2 | IoU-3 | IoU-4 | mIoU |
|---|---|---|---|---|---|
| Adem xapp Model Al | 67 | 67.96 | 71.64 | 59.33 | 66.48 |
| Dilated Resnet-22 | 58.72 | 62.52 | 72.88 | 64.92 | 64.76 |
| Dilated Resnet-38 | 69.04 | 67.48 | 75.04 | 66.83 | 69.6 |
| Dilated Resnet-105 | 69.49 | 68.42 | 75.75 | 65.98 | 69.91 |
| Multi-scale context Aggregation Net | 70.88 | 61.48 | 77.5 | 64.99 | 68.71 |
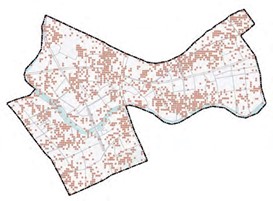
Based on the aforementioned method of assessing panoramic greenery, Ziyang Park in Wuhan was selected to measure and assess the panoramic greenery of the park at all levels of the park paths and activity plazas. Ziyang Park is a comprehensive park located in Wuhan’s Wuchang District, named after Ziyang Lake. The park covers an area of approximately 28.0 h\({m^2}\), of which approximately 11.7 h/\({m^2}\)is water and 16.3 h\({m^2}\) is land.
The panoramic image was taken on Tuesday 12 March 2019 from 09:30-15:30, during which time there were fewer visitors, which reduced the interference of visitors to the measurement during the shooting. The average temperature on the day of the shooting was 16°C, the lighting conditions were good, and the deciduous trees in the park were still in the budding stage, the branches were not yet very dense and the depression was low.
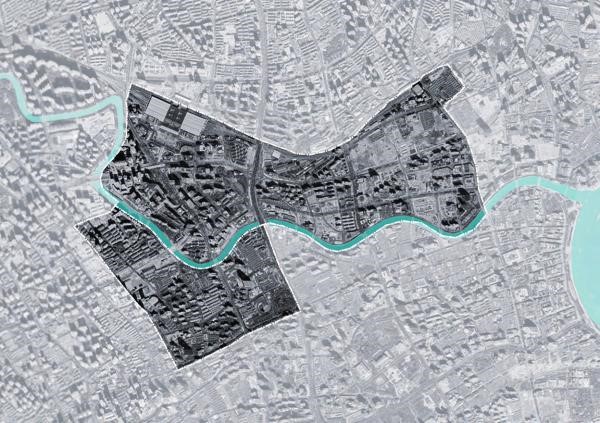
Points were selected at equal distances based on areas accessible to visitors to Ziyang Park. Photographs were taken at 30 m intervals along the centreline of the paths, road intersections and squares at all levels to obtain a panoramic view of the greenery in the different activity areas. Areas within the site that are not accessible to visitors, such as the water and the interior of the planting areas, were not photographed. Due to the closure of the lake island and the central section of Ziyang Lake during the shooting period, access was not possible. A total of 126 filming locations were obtained (Figure 8>).
The panorama is taken with the Garmin VIRB 360 panoramic camera, with a resolution of \(5,640 * 2,820\) pixels for composite panoramic images. The camera comes with a GPS+GLONASS satellite positioning system, which automatically records the geographical coordinates of the captured images. The height of the camera is set according to the average height of Chinese adults of both sexes, published by the National Health Commission in 2015, which is 1.6m.
After obtaining the image data, the isometric cylindrical projection of the original image was converted to an isoprojected cylindrical projection, and the green vegetation portion of the panoramic image was identified and calculated using the Dilated ResNet-105 convolutional neural network (Table 2).
| Type | Green vision rate % | Total number of samples | Average green vision rate % |
| Activity square | 56.26 | 5 | 36.8 |
| Primary Garden Road | 36.25 | 62 | 41.93 |
| Secondary Garden Road | 32.2 | 42 | 54.5 |
| Tertiary Garden Road | 85.15 | 14 | 66.32 |
| Garden entrance | 50.01 | 3 | 47.91 |
Based on the Dilated ResNet-105 convolutional neural network, the panoramic green view of the entrances and exits of Ziyang Park, the paths at all levels and the activity plaza were identified and calculated (Figure 9). The average panoramic green view rate of the park’s visitable areas was calculated to be 51.18% based on a combination of sample points across the park. In terms of the spatial distribution of panoramic greenery, there is little variation in greenery across the paths. The highest average panoramic greenery is found on the tertiary roads, the lowest on the activity plaza, the highest on the northern and southern sections of the main park road, and slightly lower on the southeastern and northwestern sections. The average greenery in the area is, in descending order, Tertiary Road > Secondary Road > Park Entrance > Primary Road > Activity Square. In terms of the park as a whole, the highest greenery rate is 85.42% and the lowest 21.19%. The highest greenery rate is on Level 3 Road, which is a paved walk on a large lawn with tall trees and high top vegetation cover.
The lowest point of green vision is located on a secondary road, surrounded by a large area of water, with vegetation far from the camera lens. Therefore, the proportion of green vegetation is low during the recognition of the images.
The existing open source SegNet image semantic recognition technology has shortcomings for image recognition of riverfront landscape gardens. This paper draws on the method of using landscape garden maps and SegNet to process images for landscape garden feature analysis in the study of street landscape gardens, and combines the image semantic segmentation techniques in deep learning algorithms to train a panoramic image segmentation model applicable to riverfront greenways, with an accuracy of 0.93 and an MIoU of 0.74, which is accurate for batch processing of urban riverfront greenway images and has universal applicability. The image segmentation results can provide designers, planners, public environment researchers and other experts in the field with effective methods for quantifying riverine landscapes, and provide strong support for human-scale riverine landscape planning, design and multi-stakeholder research.
This study uses panoramic images from the viewpoint of visitors, develops an evaluation index system based on the measurable content of image semantic recognition, and determines five categories of factors that have a significant impact on visual perception through regression models. Among them, the green view rate and the natural openness of the riverfront are positively correlated; the blue view index, the disturbance factor index and the ratio of trees to grass are negatively correlated. Therefore, this paper proposes various strategies to improve the visual perception quality of small and medium scale canalised waterfront greenways in other regions, based on the five indicators with significant influence, and weighing them according to the strength of their influence.
The results of the study show that GVI and WO have a positive impact on the visual quality of the landscape, but in the actual scenario, the enhancement of GVI may reduce WO due to the shading of tree canopies, and in order to balance the positive impact of both, the enhancement of visual perception can be improved both horizontally and vertically:
horizontally, the openness of the sky and sight lines on the waterfront side of the riverwalk should be ensured as much as possible. In the gently flowing section, the existing gently sloping hard barge should be softened by ecological barge construction techniques, and the green space on the waterfront side should be planted mainly with trees and grasses and herbs; the plant richness and planting levels on the far water side should be enriched, and the proportion of hard elements should be reduced, and the far water side should be planted with a combination of trees and grasses and coniferous broad-leaved trees, with trees and shrubs planted at the back to enrich the undulation of the forest canopy line The planting of trees and shrubs in the back of the stand will enrich the undulation of the canopy line and enhance the proportion of plants in the view.
In the vertical direction, when the retaining wall does not have functions such as seating (above 0.5 m), the greenery can be enhanced by greening the front of the wall, adding narrow planting strips and vertical greening to visually break the continuous hard effect of horizontal and vertical penetration(see Figure 10).
This study still has some limitations, mainly in the following aspects:
At this stage, the study is mainly applicable to image semantic segmentation and landscape garden feature analysis of canalised urban rivers, and is not applicable to nearly naturalised urban rivers, which needs further research.
On the collection of visual perception scoring data, the data in this study is based on the judgement of expert groups, and there may be some deviation between the visual perception of the public. Future research can expand the scale and diversity of the assessors, analyse the similarities and differences of the visual perception of different groups, and eliminate the visual perception errors of specific groups.
On the analysis and processing of data, more deep learning data processing techniques can be explored in the future to generate prediction models that automatically score images of the riverfront greenway, and to carry out uninvolved prediction of the rating of the current state of the site and prediction of the rating of the visual effects of the renovation to improve design efficiency.