
The rapid growth of China’s smart optical cable monitoring industry has sparked a demand for efficient infrastructure management solutions. An integral part of this infrastructure is the network of optical cables, vital for communication and data transmission across industries, including cable monitoring facilities [1-3]. Traditionally, managing these networks has been labor-intensive, relying on manual inspections and periodic maintenance. However, the emergence of smart optical cable monitoring systems presents an opportunity to revolutionize network management [4,5].
These systems leverage edge computing and sensors deployed along optical cable routes to provide real-time insights into network health and performance [6,7]. By processing data at the network edge, they reduce latency, enabling swift responses to anomalies and potential failures, critical in industries like cable monitoring facilities where downtime poses significant risks [8]. Moreover, proactive maintenance and predictive analytics capabilities allow operators to detect early signs of degradation or damage, facilitating timely intervention and preventive measures.
While these systems offer numerous advantages, challenges such as integrating heterogeneous data sources and ensuring data security must be addressed. Nonetheless, their potential to enhance operational efficiency, reduce downtime, and improve safety and reliability makes them invaluable assets in infrastructure management[9].
In this paper, we delve into the design, implementation, and optimization of smart optical cable monitoring systems based on edge computing. We explore their components and highlight the integration of edge computing technologies to enhance system efficiency and performance. Through an analysis of existing approaches, we aim to provide insights into developing robust and reliable smart optical cable monitoring solutions for various industries.
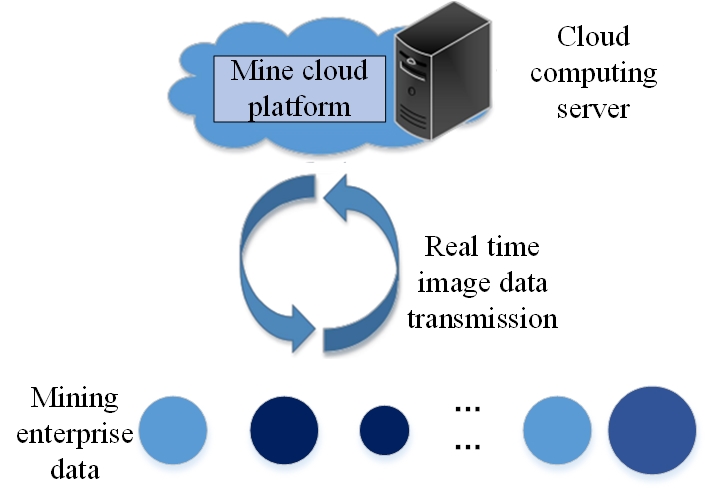
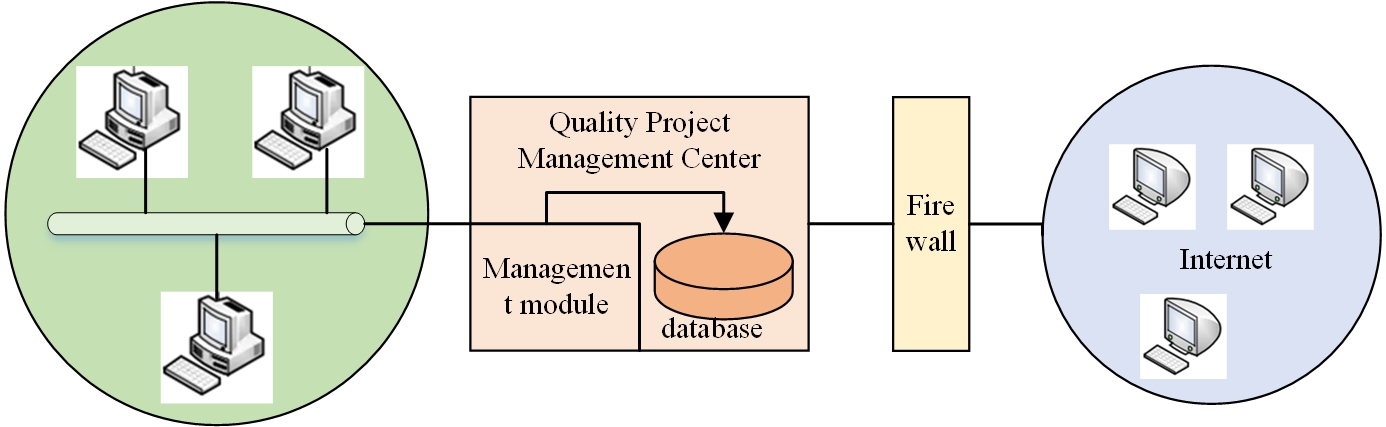
The cable monitoring information system takes the cable monitoring enterprises as an example to study the detection, early warning and data processing of the safe production environment in this system in order to try to build a complete set of enterprise safe production environment monitoring mechanism [10,11], realize the monitoring of the enterprise safe production environment in many aspects, and meet the requirements of remote monitoring, monitoring data storage and analysis, And it can generate a multi-functional and perfect monitoring system such as automatic alarm mechanism [12]. The development of this system should not only have the above perfect functions, but also generate report analysis suitable for all kinds of people according to the difference of basic quality of operators and implement the human-computer integration concept into the development of the system, as shown in Figure 1.
In addition, this system is also a product of the trend of modern development. It covers the shortcomings of the previous safety environment monitoring system, improves the problems of the monitoring system in practice, and is an upgraded version of the modern enterprise safety production environment monitoring system [13]. It can quickly process the monitored information, upload the monitoring video and automatically identify it. It has a powerful data storage function, which is convenient for the operator to read the historical records, It can give timely and accurate early warning, find problems and sensitively trigger the alarm mechanism, quickly conduct the next step of data processing and intelligent analysis and comparison, support the remote monitoring function, have GPS positioning, PDA remote law enforcement and other cutting-edge technologies, and pay attention to the confidentiality and security of information, identity authentication and other functions [14].
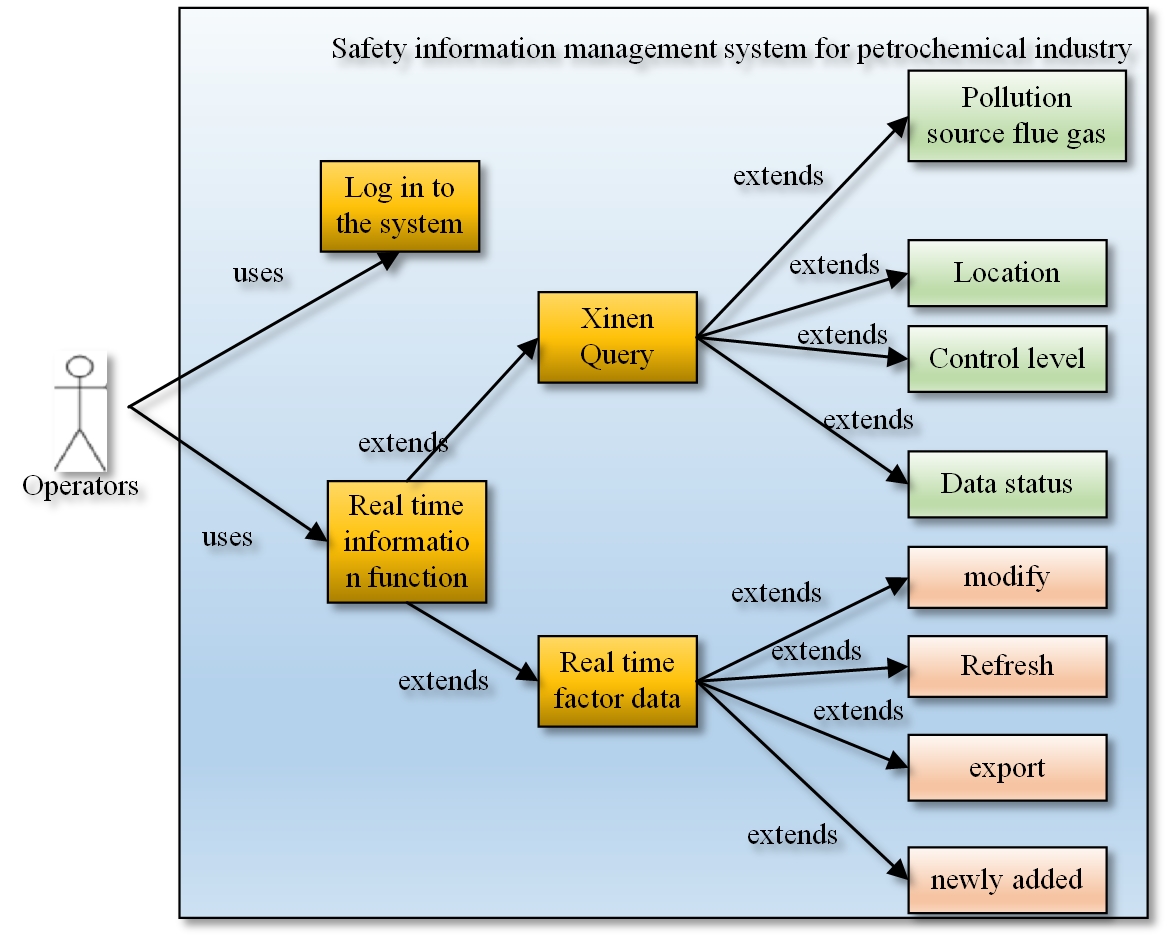
The real-time information function module of cable monitoring information system is one of the important modules of the safety production environment monitoring of the entire enterprise. Its main functions include real-time automatic detection of the data collected in various regions. This module can display these data and carry out automatic monitoring and control. The data here refers to the data of sulfur dioxide, nitrogen oxides, smoke and dust and their converted amount, oxygen content, smoke temperature, pressure, gas flow rate and flow rate collected by the system in various regions and cities [15]. Based on these data, operators can systematically classify the safety production environment of monitored enterprises in various cities and regions and serve as the basis for whether the safety production environment of enterprises is qualified. The system will also call basic information such as the source and enterprise type of the data to be viewed according to the operator’s needs. The system also adds advanced query function, acceptance query function, networking status monitoring function, data type classification function, etc. The operator use case diagram is shown in Figure 2.
In this cable monitoring information system, the safety production environment management system of cable monitoring enterprises is divided into several parts according to different functions, mainly including real-time data collection, data analysis and processing, factor data presentation, etc. Among them, the latter refers to data addition, real-time data refresh and data modification. The operation of this module can filter all monitored enterprises by category. For example, you can select to view only the sewage discharge enterprises, or the data monitoring of the enterprises that generate waste gas, or query the specific regions, security control level enterprises, or by industry category through the system [16].
In addition, the advanced data query function has been updated, and the data status monitoring function, the acceptance status query function, the networking status monitoring function, the data type classification function, have been added. The monitoring of the data networking function will be classified according to whether the enterprise data is networked, and the enterprises that are not networked according to the requirements will be grayed out. In addition, this module will also intelligently distinguish the value of data [17]. Valid data will be recorded, and invalid data will be automatically distinguished, so that the operator can observe the changes of data at any time. The operator can also set a data security line in the cable monitoring information system in advance. When the data exceeds the security range, the system can automatically give an alarm. Some enterprises whose data does not meet the requirements, or whose quality control does not meet the requirements, as well as enterprises whose fault data and exceptions cannot be determined, will be classified, and distinguished by different colors, as shown in Figure 3.
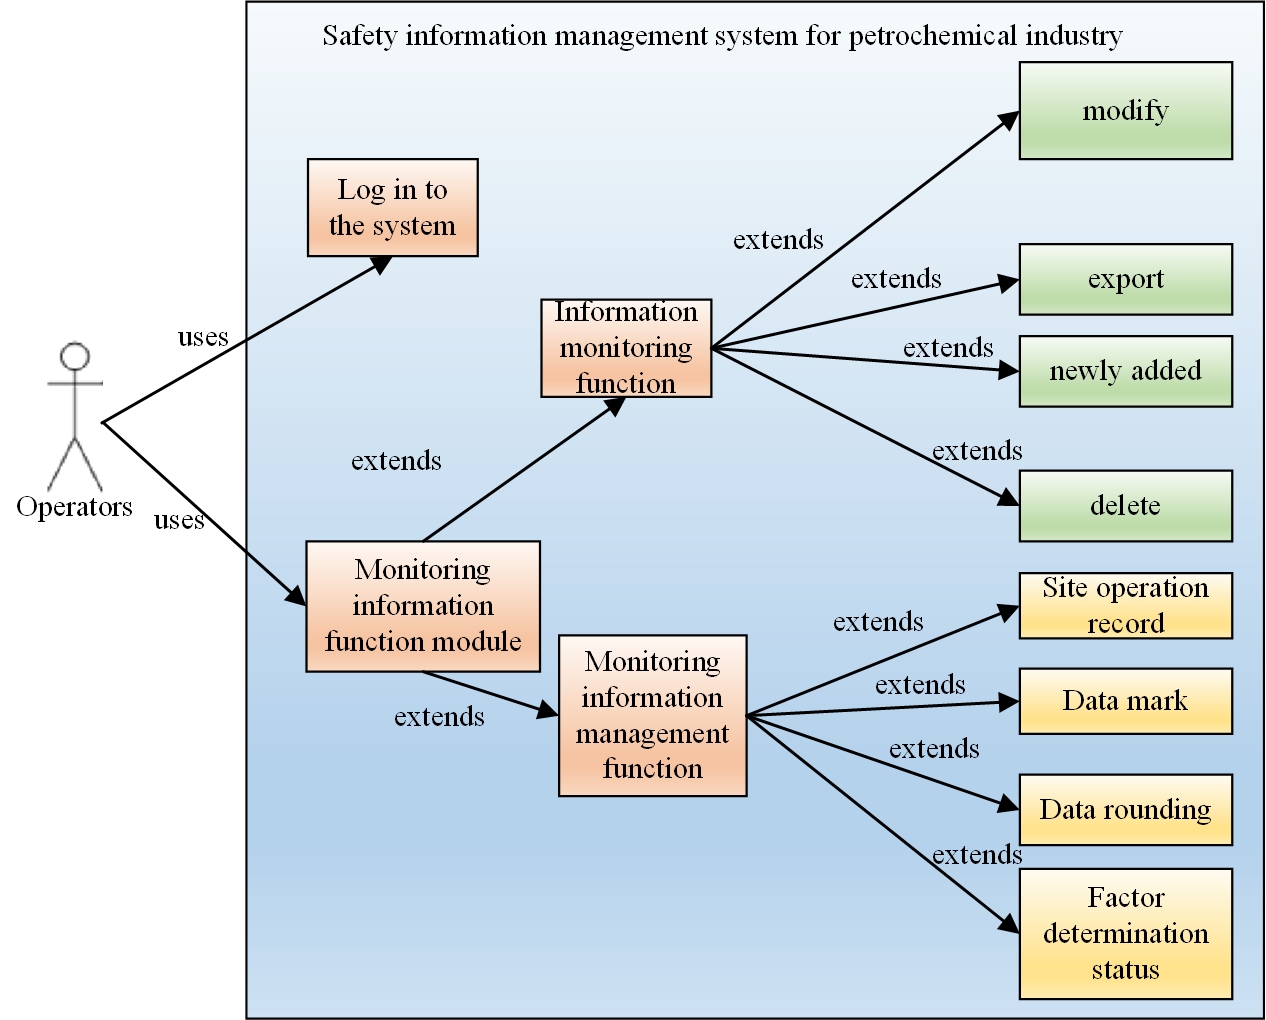
Figure 4 describes the range can be expressed as \(\left[ {{b_{1k}},{b_{2k}}} \right]\), at the same time, this section assumes that the tasks of each IIoT device have no dependencies, so the tasks can be divided into any size. The two are expressed as \(\alpha _k^0{\text{ }}and{\text{ }}\alpha _k^m\) respectively. The specific expression is shown in Eq. (1):
\[\label{eq1} \alpha _k^0 + \sum\limits_{m = 1}^M {\alpha _k^m} = 1.\tag{1}\] To ensure integrity, each task should be completely processed, as given by Eq. (2) and (3): \[\label{eq2} t_{comp}^k = \frac{{\alpha _k^{\text{u}}{l_k}}}{{{\gamma _k}}},\tag{2}\] \[\label{eq3} {\text{ }}e_{comp}^k = P_{comp}^k\frac{{\alpha _k^0{l_k}}}{{{\gamma _k}}}.\tag{3}\] On the other hand, if \(\alpha _k^m\) is not zero, the task will be processed in the m-th CAP. According to Shannon’s theory, will be expressed as Eq. (4)-(7): \[\label{eq4} C_k^m = B_{{\text{total }}}^m\beta _k^m{\log _2}\left( {1 + \frac{{P_{{\text{trans }}}^{k,m}{{\left| {h_k^m} \right|}^2}}}{{\sigma _m^2}}} \right),\tag{4}\] \[\label{eq5} {\text{s}}{\text{.t}}{\text{. }}{{\text{C}}_1}:\beta _k^m \in [0,1],\forall k,m,\tag{5}\] \[\label{eq6} {{\text{C}}_2}:\sum\limits_{m = 1}^M {\beta _k^m} = 1,\tag{6}\] \[\label{eq7} {{\text{C}}_3}:P_{{\text{trans }}}^{k,m} \leqslant P_{{\text{trans }}}^{\max }.\tag{7}\]
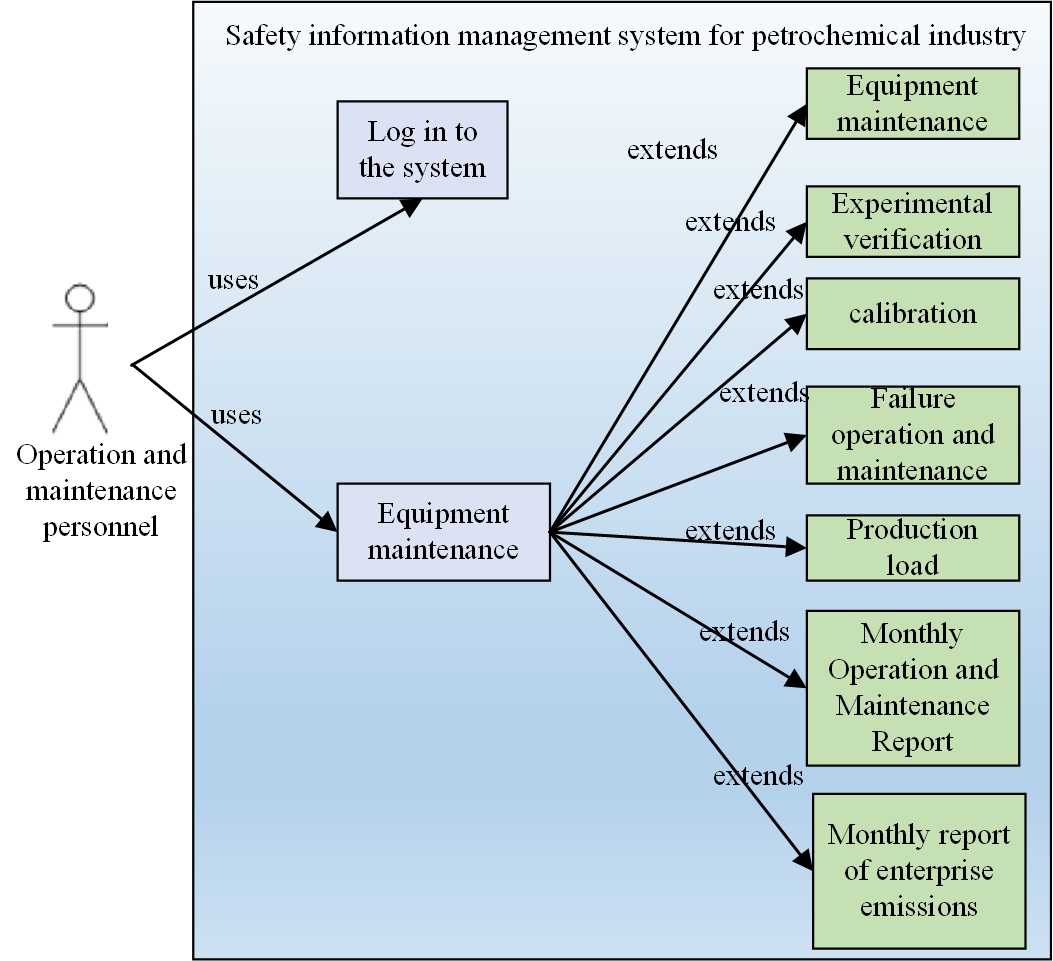
The transmission delay of cable monitoring information system is first given by Eq. (8)\[\label{eq8} t_{{\text{trans }}}^{k,m} = \frac{{\alpha _k^m{l_k}}}{{C_k^m}}.\tag{8}\] The relevant transmission energy consumption can be expressed as Eq. (9): \[\label{eq9} e_{{\text{trans }}}^{k,m} = P_{{\text{trans }}}^{k,m}\frac{{\alpha _k^m{l_k}}}{{C_k^m}}.\tag{9}\] The daily overhaul and maintenance of production equipment, the preparation of enterprise production management reports and pollutant emission reports and other businesses. The operator of the operation and maintenance module enters the corresponding data into the system through the equipment maintenance module in the system, and the system will automatically count the validity of these data for 10 days; At the same time, the operation and maintenance system operators can check the quality control verification records. The specific functions of the operation and maintenance module are shown in Figure 5.
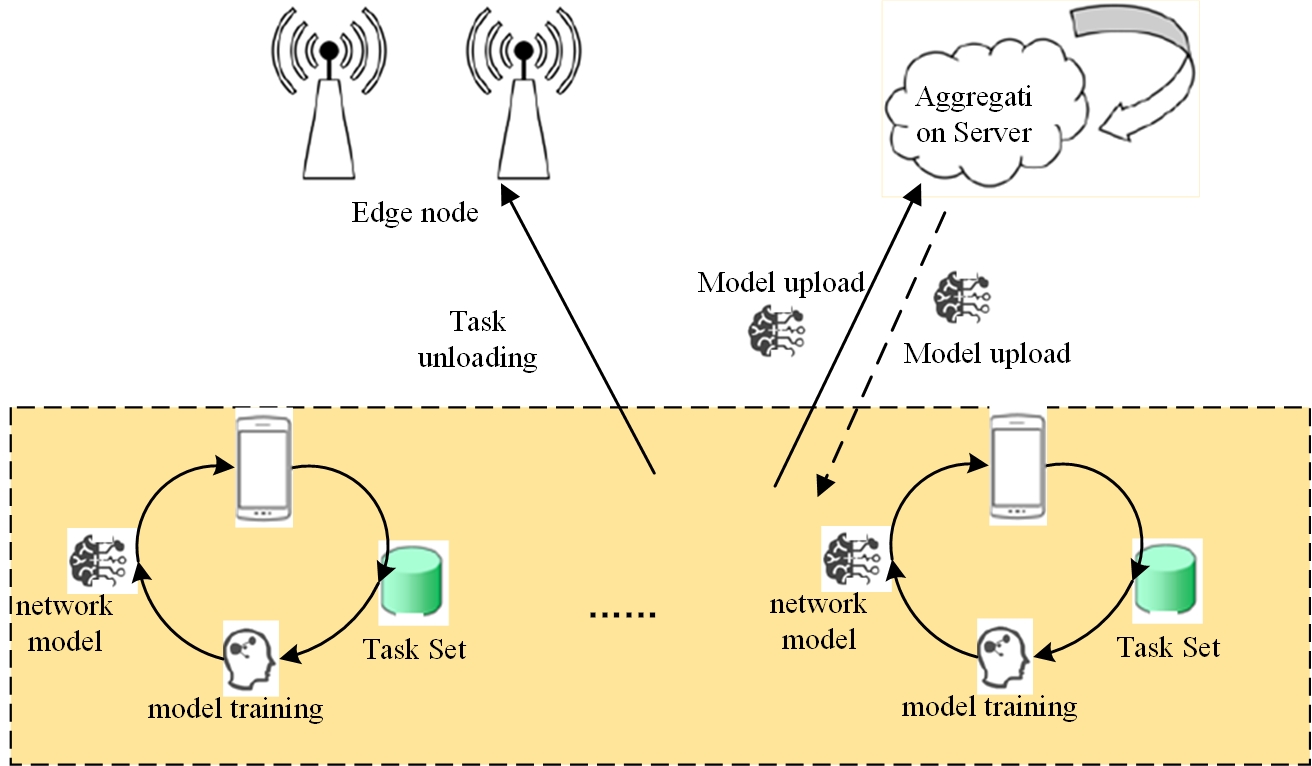
In this module, in the vertical federation learning in mobile edge computing, we need to align the samples in different mobile edge nodes to find the common sample ID among participants, as shown in Figure 6. Besides the common ID, mobile edge nodes cannot disclose other sample IDs to each other, so we need an encrypted sample ID alignment method.
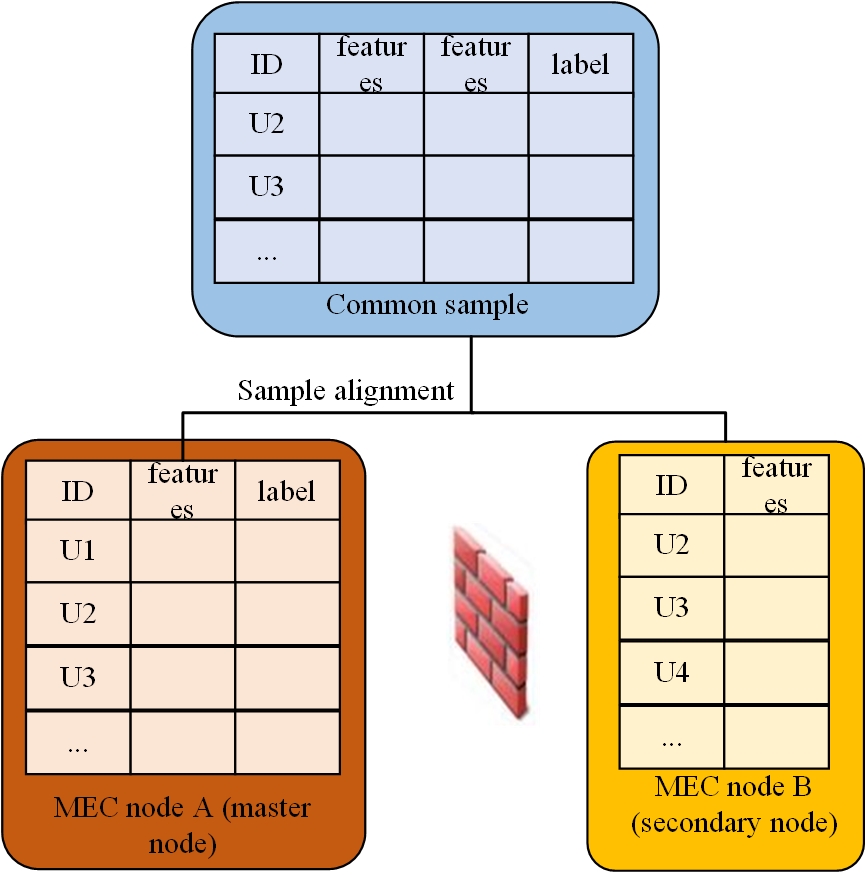
In this study, we use an encryption sample ID alignment method based on hash algorithm and RSA encryption algorithm. This scheme uses the bijection feature of RSA encryption algorithm. Here we do not consider random filling of plaintext, so plaintext and ciphertext are one-to-one. We call the node with the sample label the primary node, and the node without the sample label the secondary node. We use \(\left\{ {{s_1},{s_2},{s_3}, \cdots ,{s_v}} \right\}\) to represent the collection of sample IDs owned by the master node, \(\left\{ {{c_1},{c_2},{c_3}, \cdots ,{c_w}} \right\}\) represents the set of sample IDs owned by the secondary node. \(e,d,n\) represents the public key, private key and modulus of the RSA encryption system.
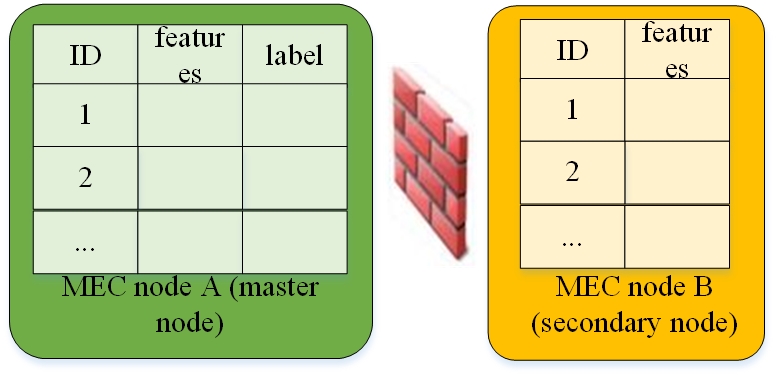
As shown in Figure 7, we assume that there are two mobile edge nodes, MEC node A and MEC node B. They want to train an NGBoost model together. For data privacy and security considerations, they cannot directly exchange sample data. They have their own data and sample alignment has been completed between their datasets. MEC node A has part of the features and labels of the sample, which we call the primary node, while MEC node B only has part of the features of the sample, which we call the secondary node.
The standard number and measuring instrument number in the standard entity of cable monitoring product measurement management are primary keys, and the measuring instrument number is a foreign key. The system E-R diagram is shown in Figure 8.
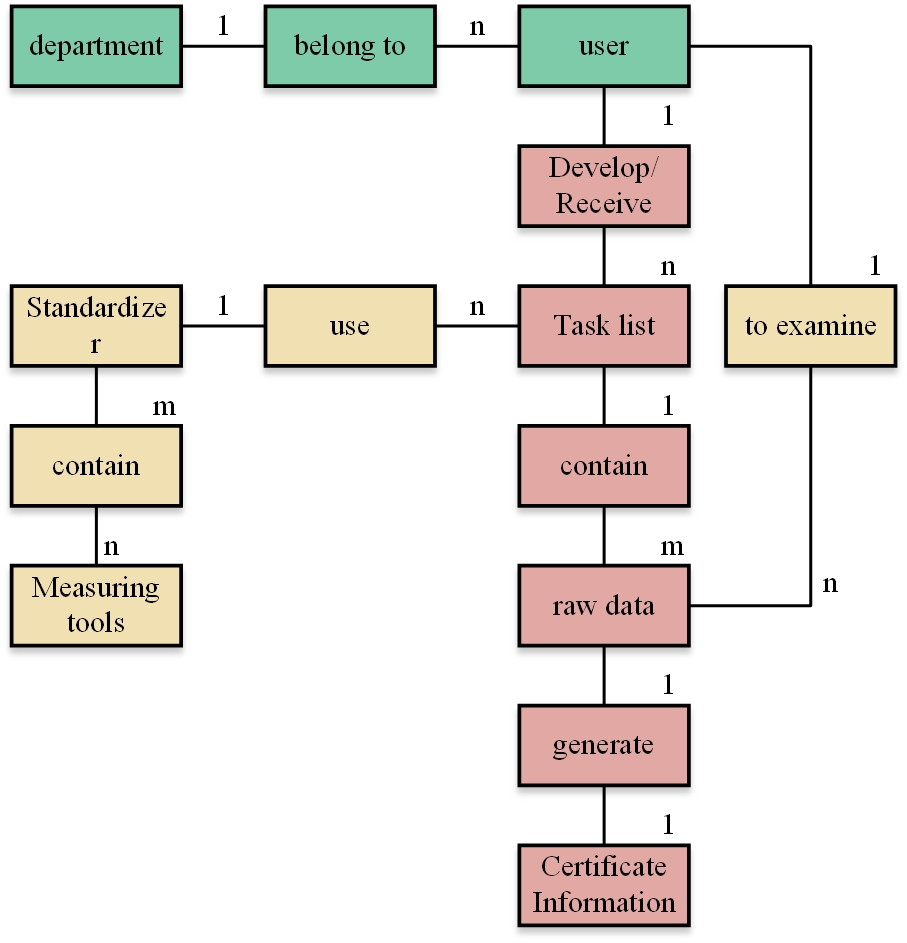
The codes of each entity are based on the conversion principles and the previously designed E-R diagram to explain the conversion methods of the centralized relationship in this system that belong to different conversion types: 1: N For example, there is a many to one relationship between users and departments, the primary key of the department table (department ID, department name, responsible person) is the department ID, and the primary key of users (name, number, password, department ID) is the number, A person can only have one department number, and one department number can belong to different users. Therefore, the department ID attribute is added to the user table in the design table to achieve a one-to-many relationship. N: M For example, the standard (No., name, type) number is the primary key, and the measuring instrument (tool No., name, next verification date) structure table (standard number, measuring tool), Several measuring instruments together form a measuring standard. Different measuring standards may have the same measuring instrument, so they are N: M relationships. Create a new measuring instrument structure table to realize the many to many relationships.
In addition, the design of database table is the basis of system software development. Based on the conceptual design of the database, the E-R diagram is transformed into a data table by using the entity attribute diagram, entity relationship diagram and data table design principles, as shown in Table 1.
| Data item name | Field Name | data type | length | Primary key | Nonempty |
|---|---|---|---|---|---|
| number | Login ID | Int | 5 | yes | yes |
| full name | Login name | Nvarchar | 21 | – | yes |
| Login password | Login Pwd | Nvarchar | 9 | – | yes |
| Department No | Dept ID | Int | 5 | – | yes |
Today’s information systems are mostly based on C/S mode or B/S mode. The C/S mode includes two layers of software structure, which are server system and client system. The client combines business logic and presentation layer and connects the database server through the network. It mainly includes middleware, client application program and server management program. The B/S mode extends the C/S mode, in which the user can complete the work through the browser. On the client side, the user sends a request to the Web [18]. The server will convert the request sent by the client into SQL statements to perform the relevant operations of the database server. This mode allows users to easily access the system around the world. In the B/S structure, the business logic processing is realized through the application server, which is separated from the original client system of C/S mode, so that the business logic is completed separately through the server; The database server completes the data processing function, as shown in Figure 9.
The system supports Internet and Lan networks. Users of the internal network of CNOOC Second Construction can directly access the system, and the system can assign system permissions through IP based identification; For external network users, the username and password mechanism are used to prevent illegal entry and other illegal acts.
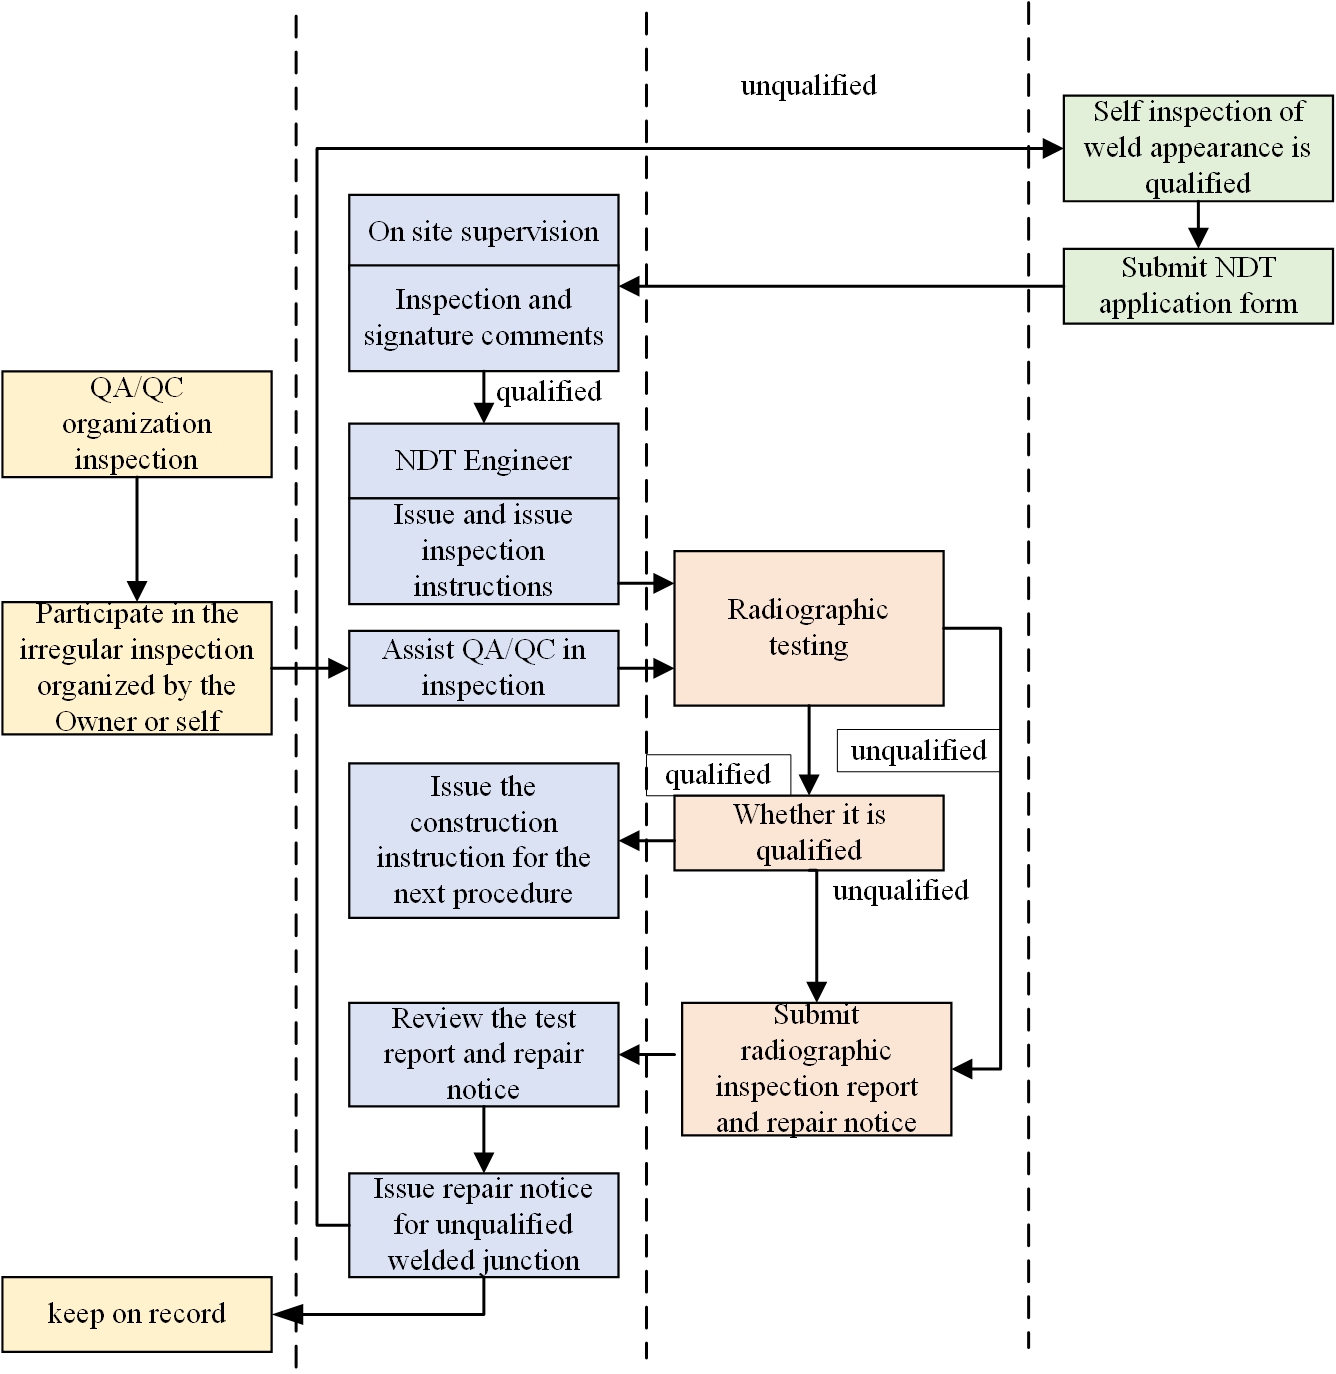
The cable monitoring NDT unite shall submit the original NDT report (stamped with the special seal for NDT) and the original NDT repair notice to the NDT engineer of the Construction Supervision Department every week. After receiving the original NDT report and being reviewed and confirmed, the Supervision Engineer of the Supervision Department shall issue the next procedure repair instruction for construction, as shown in Figure 10.
To sum up, the system can provide a more comprehensive information input window and establish a cable monitoring operator’s basic information registration form, including the cable monitoring operator’s certificate holding situation and the corresponding weldable joint form, operation position limit, operation material limit and the expiration date of the certificate, information summary, query and update input. For the actual operation status of cable monitoring operators, the pass rate and repair rate of one operation on different pipeline numbers at different stages of each cable monitoring operator, as well as the quality penalty records, are summarized from different perspectives of priming and covering. The report forms under different management requirements are also provided to reflect the operation status data of cable monitoring operators in a timely manner and provide decision-making adjustment basis for resource regulation and quality regulation for various purposes.
The cable monitoring information system adopts a top-down design approach to establish corresponding data tables and queries around six functional modules: basic platform reinforcement (including client), boundary defense, authentication and authorization, data encryption and integrity verification, security audit, and early warning and emergency response, including 92 data tables and 500 queries. The establishment of the database must be related to the data production system, related to the data service system, capable of supporting the mapping application of spatial data, capable of database extension and update, standardized, high quality, unified planning, and application-oriented. In addition, the coordinate system of the spatial data must be unified before entering the database. The main fields of some data tables are shown in Table 2, 3 and 4.
| number | Field Name | data type | Is it empty | explain |
|---|---|---|---|---|
| 1 | Ygbh | varchar(20) | no | Employee No. (Primary Key) |
| 2 | Xm | char(20) | no | full name |
| 3 | Bm | char(20) | no | department |
| 4 | Gz | varchar(20) | no | Type of work |
| 5 | Czlx | varchar(40) | no | Certificate type |
| 6 | Khjtxs | char(20) | no | Weldable joint type |
| 7 | Khwz | char(20) | no | Weldable position |
| 8 | Khcz | varchar(40) | no | Weldable materials |
| 9 | Czjzrq | varchar(40) | no | Deadline for certificate holding |
| 10 | Hjtgl | varchar(40) | yes | Pass rate of welding |
| 11 | Fxl | varchar(40) | yes | Repair rate |
| 12 | Bljl | varchar(40) | yes | Bad records |
| number | Field Name | data type | Is it empty | explain |
|---|---|---|---|---|
| 1 | Hfbh | varchar(20) | no | Weld No. (primary key) |
| 2 | Hfrq | varchar(20) | yes | Welding date |
| 3 | Hflx | varchar(20) | no | Weld type |
| 4 | Hfwz | varchar(20) | no | Weld position |
| 5 | Ygbh | varchar(20) | yes | Welder No |
| 6 | Gxbh | varchar(20) | yes | Line No |
| 7 | Gdbh | varchar(20) | no | Pipe section No |
| 8 | Hfpx | varchar(20) | no | Weld sequencing |
| 9 | Cz | varchar(20) | no | texture of material |
| 10 | Hjcl | varchar(20) | yes | welding material |
| 11 | Hjff | varchar(20) | yes | welding method |
| 12 | Hjwd | varchar(20) | yes | ambient temperature |
| 13 | Wsjc | varchar(20) | yes | NDT |
| 14 | Rcl | varchar(20) | yes | Heat treatment report |
| 15 | Fxkt | varchar(20) | yes | Repair and expansion |
| number | Field Name | data type | Is it empty | explain |
|---|---|---|---|---|
| 1 | Gxbh | varchar(20) | yes | Line No. (primary key) |
| 2 | Syrq | varchar(20) | yes | Pressure test date |
| 3 | Syjg | varchar(20) | yes | Pressure test results |
| 4 | Syzz | varchar(20) | yes | Pressure test team leader |
| 5 | Pidbh | varchar(20) | yes | P&ID Drawing No |
| 6 | Sjyl | varchar(20) | no | Design pressure |
| 7 | Sjwd | varchar(20) | no | Design temperature |
| 8 | Ylsy | varchar(20) | yes | Pressure test |
| 9 | Sybbh | varchar(20) | no | Pressure test package No |
| 10 | Xmbh | varchar(20) | no | Item No |
Some experiments are performance of the proposed scheme, and the average channel gain from secondary user to cable monitoring monitoring point, are shown in Figure 11(The X-axis of Figure 11 is the number of users and the Y-axis is the communication and computation spend.).
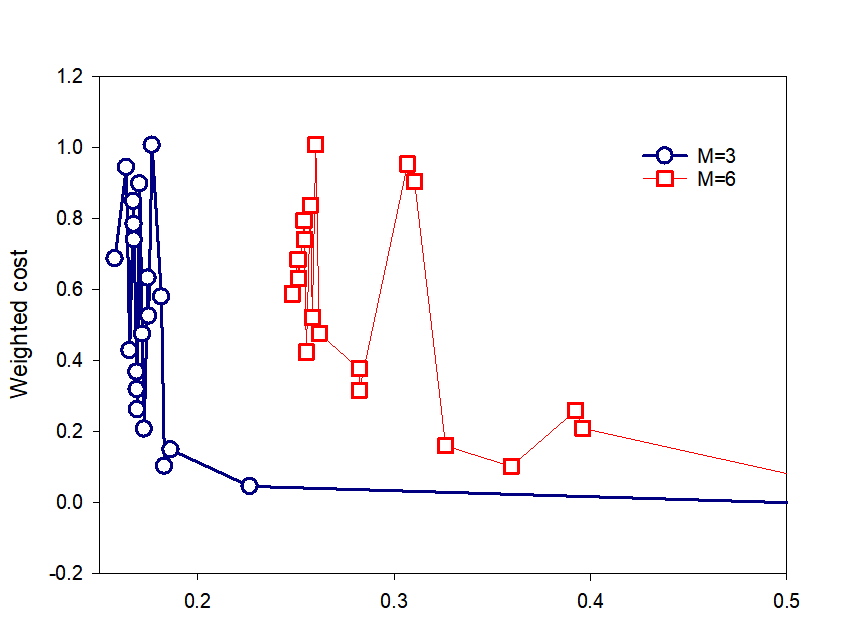
In addition, the weighted cost when=6 fluctuates in the fifth and sixth training rounds, because the increasing number of users increases the burden of communication and computing, resulting in increased costs. Therefore, Figure 11 proves that under Standard I, the proposed method can help different numbers of users effectively reduce system costs.
After training the federated multimodal data classification models based on AlexNet network and VGGNet network. The results are shown in Table 5.
| Accuracy | Precision | Recall | F1-score | |
|---|---|---|---|---|
| AlexNet | 0.722223 | 0.733362 | 0.718776 | 0.722939 |
| Vggnet | 0.716821 | 0.731301 | 0.711366 | 0.719448 |
The construction of advanced information system can enable cable monitoring enterprises to realize the overall optimization of production and operation process, enhance the competitiveness of enterprises and achieve better economic benefits. In the process of building the information system of cable monitoring enterprises, attention should be paid to the advanced experience at home and abroad, and the overall strategy of the enterprise should be formulated from the height of internationalization, standardization, marketization and advancement, and the problems in the production and management of the enterprise and its information solutions should be proposed, and realized by advanced information technology such as advanced control, supply chain optimization and ERP. In short, only by vigorously promoting enterprise informatization can we improve the comprehensive competitiveness of cable monitoring enterprises and achieve the desired benefits.
This work was supported by State Grid Jiangsu Electric Power Co., Ltd. provincial management of industrial units of science and technology project funding(Project No.: JC2024002).
The authors declare no conflict of interests.