
The discourse on optimizing higher education for innovation and entrepreneurship is paramount in today’s rapidly evolving landscape. As we traverse the information age, the realm of universal entrepreneurship within contemporary higher education institutions has grown increasingly intricate[1]. This complexity not only diversifies entrepreneurial paths but also escalates associated risks. Enhancing entrepreneurial prowess among higher education cohorts directly correlates with bolstering entrepreneurship success rates[2,3]. This, in turn, mitigates prevailing employment challenges faced by university graduates, fostering robust self-assurance in both employment and entrepreneurship endeavors.
The omnipresence of big data technology in society heralds profound advantages for aspiring entrepreneurs within higher education domains. By enriching the entrepreneurial mindset of contemporary graduates, big data analytics engenders strategic foresight, steering entrepreneurial thinking toward long-term developmental trajectories[4,5]. Through meticulous data analysis, individuals discern industry-specific entrepreneurial paradigms, optimizing the timing and modality of business ventures. Moreover, the integration of big data technology aligns entrepreneurial ideation with internet and digital realms, facilitating comprehensive analyses of entrepreneurial trajectories. Such endeavors embolden individuals to pursue employment aspirations and entrepreneurial ambitions while ensuring the viability and developmental potential of their chosen paths, thereby galvanizing holistic market economy advancement[6].
Incorporating talent cultivation initiatives into this narrative amplifies its resonance and impact[7]. Higher education institutions, cognizant of their pivotal role, must foster environments conducive to talent development. By nurturing creativity, resilience, and adaptability, universities empower students to navigate the complexities of entrepreneurship with aplomb. Through interdisciplinary collaboration, mentorship programs, and experiential learning opportunities, aspiring entrepreneurs harness their innate potential, transforming theoretical knowledge into practical innovation[8,9].
In essence, optimizing higher education for innovation and entrepreneurship transcends theoretical discourse; it embodies a paradigm shift in educational philosophy. By embracing technological advancements, cultivating talent, and fostering entrepreneurial ecosystems, universities become catalysts for societal transformation and economic revitalization. As we venture forth into uncharted terrain, the journey towards educational optimization for innovation and entrepreneurship beckons—a journey teeming with promise, potential, and boundless opportunity.
The elements of innovation ability should include innovation consciousness, innovation thinking, innovation personality, and the accumulation of relevant knowledge, knowledge foundation[10]. The basic components of innovative ability are summary here as the accumulation of knowledge, the ability to transfer knowledge, the ability to classify and integrate knowledge, the ability to think and imagine, the ability to operate in practice and the ability to control mentally (willpower and executive power)[11]. The linear space is described as follows: R6 knowledge formation and accumulation, knowledge transfer ability, knowledge classification and integration management ability, thinking and imagination, practical operation ability, and mental control ability), which is a 6-dimensional linear vector space, and it is necessary to test whether each dimension is independent of the other[12].
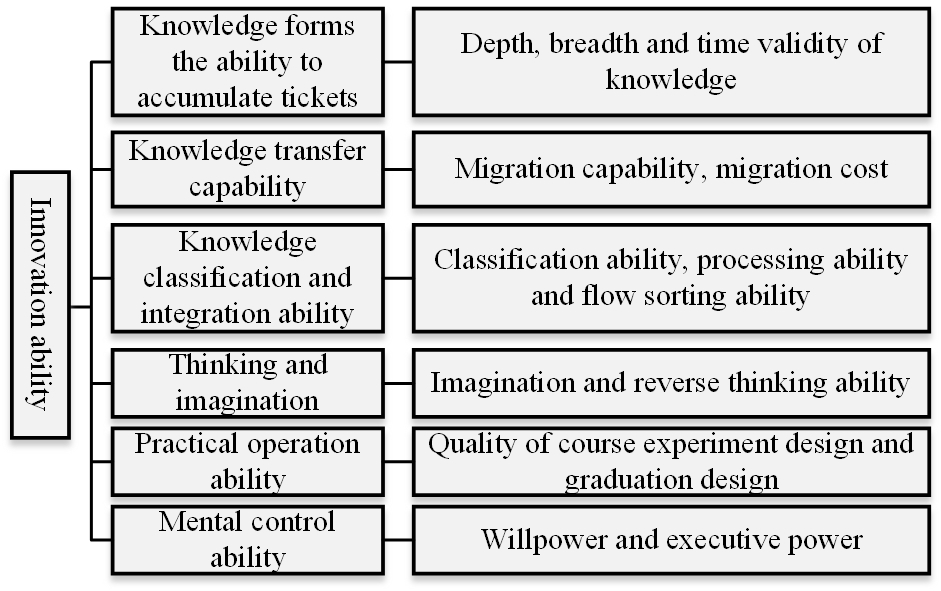
For the basic components of innovation ability assumed in Figure f1, a scale can be designed to measure the ability to accumulate knowledge (depth, breadth and temporal validity of knowledge), the ability to transfer knowledge (transfer ability, transfer cost), the ability to classify and integrate knowledge and manage it (knowledge classification ability, management ability, deductive reasoning ability), the ability to think and imagine (imagination, reverse thinking ability), the ability to operate in practice (course The students were asked to answer a certain number of multiple-choice questions in each of the six areas (quality of experimental design, quality of graduation design), and the scores of these areas were counted by asking the students to answer the questions.
For the connotation of entrepreneurial competencies, a more scientific and systematic expression of the connotation of entrepreneurial competencies was given by combining case studies and questionnaires, the seven dimensions of relational competence, innovation and creativity, entrepreneurial perseverance, opportunity grasping, etc. to express the composition of entrepreneurial competencies for all [10]. The calculation of its elemental components can be designed with a certain number of multiple-choice questions, and by asking students to answer the questions to count their scores in these dimensions, and then convert the scores into relative probabilities to measure the weighting relationship of each component, and then test their correlation by factor analysis[13,14]. (See Table 1)
| Serial number | Element dimension | Connotation / Evaluation score |
| 1 | Relationship Competency | Ability to establish and maintain interaction between individuals, individuals and organizations |
| 2 | Innovative creativity | Innovatively solve various problems in the process of entrepreneurship |
| 3 | Entrepreneurial perseverance | The ability to persist without giving up in the face of difficulties and setbacks in entrepreneurship |
| 4 | Grasp the opportunity | Ability to identify, evaluate and capture market opportunities through various methods |
| 5 | Motivation of entrepreneurship | Expectation and pursuit of entrepreneurial lifestyle and its achievements |
| 6 | Resource integration | Ability to integrate human, financial, material and technical resources inside and outside the organization |
| 7 | Practical learning ability | The ability to continuously learn the knowledge and skills required for entrepreneurship |
Assuming that our previous hypothesis is valid, we can obtain R6 knowledge formation accumulation, knowledge transfer ability, knowledge classification and integration management ability, thinking imagination, practical operation ability, and mental control ability) a set of innovative ability base vectors[15]. Similarly, \({T^7}\) (Relational Competence, Opportunity Grasp, Innovation and Creativity, Resource Integration, Entrepreneurial Motivation, Entrepreneurial Perseverance, and Learning by Doing) can be obtained as another set of basis vectors. Finally, the coefficients of these two sets of basis vectors and the weights of the components of innovation and entrepreneurship can be determined[16]. How to determine the weights? Take innovation capability as an example: let there be m attributes for the evaluation of the innovation and entrepreneurship capability of all people. i.e. \({c_1},{c_2},…,{c_m}\) takes this part of the attributes as the basis for determining the weights. The weight refers to the degree of influence of an indicator factor on the innovation and entrepreneurship of all people. The size of the weight is usually positively correlated with the degree of influence, with weights ranging from 0 to 1, and the sum of the weights of the evaluation factors being 1.
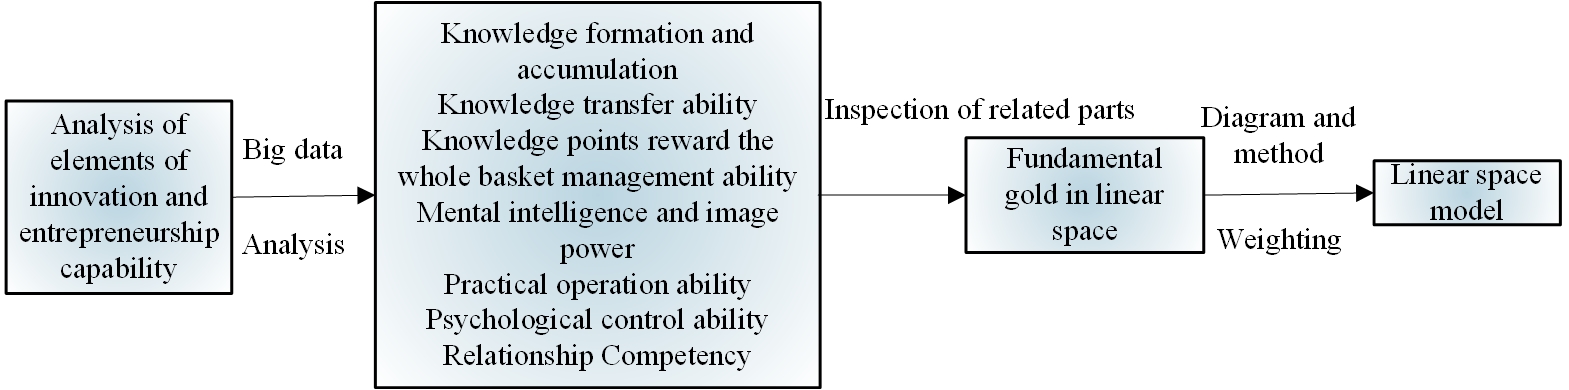
After determining the constituents of innovation and entrepreneurship, the correlation and independence of each basic constituent are tested, the similarity of the 2 base vectors and the correlation detection of each vector metric are carried out, and then the base vectors of the linear space of unified innovation ability are constructed, and then the weights of each base vector are determined by the topologic theory, from which the linear space model of innovation and entrepreneurship ability can be constructed \(C = \left( {{\xi _1},{\xi _2},…,{\xi _n}} \right),n \leqslant 11\) , \({\xi _1}\) Here \(n\) is the linear space dimension (See Figure 2).
As the linear space of innovation capability is abstract, it is not easy to observe and measure, therefore, it is necessary to transform this abstract value into an observed quantity. The ability to accumulate knowledge can be observed in terms of the depth and breadth of knowledge and its temporal validity[17]; the ability to transfer knowledge can be measured in terms of the ability to transfer knowledge and the cost of transfer; the ability to classify, integrate and manage knowledge can be measured in terms of the ability to classify knowledge, the ability to manage and the ability to reason deductively; the ability to think and imagine can be observed in terms of the ability to imagine and the ability to think in reverse[18]; the ability to operate in practice can be calculated in terms of the quality of the course Mental control can be measured by observing willpower and executive ability ; relational competence can be measured by actively keeping in touch with new friends and establishing friendships with strangers ; opportunity grasp can be measured by trying to assess the feasibility of business opportunities and finding ways to assess the value of some business opportunities. To do this, two tasks are required: first, constructing a mapping between the basis vectors in linear space and the observable measures; and constructing a scale for the observable measures. Next, statistical calculations are made and the evaluation model is derived, i.e. \(C = \left( {{\xi _1},{\xi _2},…,{\xi _n}} \right) \to \left( {{f_1}{{\left( \psi \right)}_1},{f_2}{{\left( \psi \right)}_2},…,{f_n}{{\left( \psi \right)}_n}} \right)\) where is the mapping function relationship and is the observable measure.
Since the calculated value of \(C = \left( {{f_1}{{\left( \psi \right)}_1},{f_2}{{\left( \psi \right)}_2},…,{f_n}{{\left( \psi \right)}_n}} \right)\) reflects \(C = \left( {{\xi _1},{\xi _2},…,{\xi _n}} \right)\) , the magnitude of the vector base of the linear space in which innovation and entrepreneurship are expressed.
Step 1: we can start by measuring the linear spatial vector value of the innovative entrepreneurial ability of a known successful person and use this value as a reference standard value.
Step 2: compare the difference or variance value of the base vector between a certain sex measure and the standard value and identify the corresponding basic components.
\[\label{e1} {\xi _{iK}} = \frac{{{{\min }_i}{{\min }_k}\left| {{X_{ok}} – {X_{ik}}} \right| + \rho {{\max }_i}{{\max }_k}\left| {{X_{ak}} – {X_{ik}}} \right|}}{{\left| {{X_{ok}} – {X_{ik}}} \right| + \rho {{\max }_i}{{\max }_k}\left| {{X_{ok}} – {X_{ik}}} \right|}}({\text{i}} = 1,2, \ldots ,m:k = 1,2,…,n). \tag{1}\]
Step 3: Targeted enhancement of the identified basic components of innovation and entrepreneurship capacity \({\text{E = }}\left( {{\Delta _1},{\Delta _2},…,{\Delta _i}} \right)\left( {\Delta > {\Delta _0}{\text{,i < n,}}{\Delta _0}{\text{Is threshold}}} \right)\) .
Based on the formula for calculating the grey correlation coefficient
\[\begin{aligned} \label{e2} &{\xi _{iK}} = \frac{{{{\min }_i}{{\min }_k}\left| {{X_{ok}} – {X_{ik}}} \right| + \rho {{\max }_i}{{\max }_k}\left| {{X_{ak}} – {X_{ik}}} \right|}}{{\left| {{X_{ok}} – {X_{ik}}} \right| + \rho {{\max }_i}{{\max }_k}\left| {{X_{ok}} – {X_{ik}}} \right|}},\;\;\;\;\;\;\left( {i = 1,2,…,6;k = 1,2,…,11} \right). \end{aligned} \tag{2}\]
From Table 1, it is possible to know the weights of the different indicators at each level, i.e. \({W_{AB}},{W_{B1C}},{W_{B2C}},{W_{B3C}},{W_{B4C}},{W_{B5C}}\) Using the formula: \(R = {\left( {{r_i}} \right)_{1 \times m}} = \left( {{r_1},{r_2},…,{r_m}} \right)\) the degree of correlation of the indicators at each level is calculated.
\[ \label{e4} {R_{BI}} = {W_{B1C}} \times E_{BIC}^T = (0.0077,0.0148,0.0212,0.0125,0.0609,0.0764,0.0793,0.0152), \tag{3}\] \[\label{e5} {R_{B2}} = {W_{B2C}} \times E_{B2C}^T = (0.0049,0.0114,0.0153,0.0073,0.0386,0.0222,0.0575,0.0103{\text{ )}},\tag{4}\] \[\label{e6} {R_{B3}} = {W_{B3C}} \times E_{B3C}^T = (0.0084,0.0168,0.0140,0.0116,0.0471,0.0695{\text{, }}0.1100,0.0166{\text{ )}},\tag{5}\] \[\label{e7} {R_{BA}} = {W_{BAC}} \times {E^T}_{BAC} = (0.0396,0.0546,0.0534,0.0607,0.5058,0.2044{\text{, }}0.3583,0.0602{\text{ )}},\tag{6}\] \[\label{e8} {R_{BS}} = {W_{B5C}} \times E_{BSC}^T = (0.0125,0.0264,0.0260,0.0165,0.1308,0.0545{\text{, }}0.1026,0.0206{\text{ )}}. \tag{7}\]
In the above Eqs \({E_{B1C}},{E_{B2C}},{E_{B3C}},{E_{B4C}},{E_{B5C}}\) is the matrix consisting of the corresponding data in the table of correlation coefficient values, respectively. The final correlation for the target layer – indicator \(R\) is calculated as \({R_A} = \left( {{r_1},{r_2},{r_3},{r_4},{r_4}} \right) = {W_{AB}}\left( {{R_{Bb}}{R_{B2}},{R_{B3}},{R_{BA}},{R_{BS}}} \right)(0.0262,0.0389,0.0388,0.0397,0.3177,0.1408,0.2411,0.0411)\) . Based on the magnitude of the correlations in \({R_A}\) , the order of correlations for the quality of innovation and entrepreneurship education for all of the eight institutions can be determined as follows: \(E > G > F > H > D > B > C > A\).
Among the 8 colleges and universities surveyed, the highest value of association with the ideal college and university is \(E\) for all, with a value of 0.3177. \(E\) for all has the most excellent college and university innovation and entrepreneurship education; college \(G\) (association of 0.2411), college \(F\) (association of 0.1408) and college \(H\) (association of 0.0411) belong to the second level. The correlation degree of these four universities is significantly higher than that of the four undergraduate institutions, namely, university \(D\) (correlation degree of 0.0397), university \(B\) (correlation degree of 0.0389), university \(C\) (correlation degree of 0.0388) and university \(A\) (correlation degree of 0.0262), all of which belong to the third level. (See Table 2)
| 64.55Evaluation index system of innovation and entrepreneurship education for college students | First-level indicators | Secondary indicatorsweight | School A | School B | School C | School D | School E | School F | School G | School H | |
| Innovation and entrepreneurship courses and activities | Number of innovation and entrepreneurship courses | 0.02 | 60.01 | 69.62 | 71.82 | 67.82 | 74.71 | 72.40 | 76.95 | 68.92 | |
| – | – | Innovation and entrepreneurship course content | 0.02 | 61.17 | 70.78 | 73.67 | 68.45 | 70.55 | 74.09 | 76.55 | 69.67 |
| – | – | Innovation and entrepreneurship lecture | 0.03 | 61.78 | 69.22 | 70.78 | 68.34 | 72.91 | 75.16 | 76.17 | 68.95 |
| – | – | Innovation and entrepreneurship activities | 0.05 | 64.13 | 70.02 | 72.35 | 68.77 | 74.71 | 76.23 | 75.54 | 70.05 |
| Innovation and entrepreneurship education conditions | Teachers of innovation and entrepreneurship education | 0.02 | 67.02 | 72.68 | 76.35 | 71.88 | 76.49 | 76.21 | 77.32 | 73.07 | |
| – | – | Innovation and entrepreneurship education system | 0.03 | 61.72 | 72.68 | 76.55 | 72.87 | 76.44 | 75.69 | 76.93 | 72.75 |
| – | – | Innovation and entrepreneurship books | 0.02 | 68.83 | 72.68 | 76.67 | 70.45 | 76.49 | 75.69 | 76.93 | 72.45 |
| – | – | Construction of innovation and entrepreneurship sites and facilities | 0.02 | 66.48 | 71.56 | 68.72 | 69.82 | 75.89 | 75.12 | 78.09 | 72.42 |
| – | – | Innovation and entrepreneurship atmosphere | 0.02 | 64.72 | 72.33 | 73.18 | 69.35 | 74.72 | 75.16 | 76.56 | 72.32 |
| Innovation and entrepreneurship education channels | Access to education information | 0.04 | 64.77 | 70.38 | 69.49 | 68.02 | 74.13 | 73.52 | 77.32 | 71.49 | |
| – | – | Convenience of access to education services | 0.05 | 64.12 | 70.39 | 70.02 | 68.45 | 75.96 | 75.65 | 76.19 | 70.95 |
| – | – | Feedback on demand channels for innovation and entrepreneurship education | 0.05 | 65.32 | 71.56 | 60.49 | 67.89 | 74.72 | 75.69 | 75.78 | 70.45 |
| Self-innovation and entrepreneurship | Establishment of innovation and entrepreneurship awareness | 0.15 | 60.01 | 65.38 | 67.62 | 67.08 | 75.56 | 71.36 | 73.85 | 65.49 | |
| – | – | Evaluation on the mastery of innovation and entrepreneurship knowledge | 0.08 | 53.54 | 60.02 | 58.42 | 60.14 | 66.25 | 68.14 | 68.07 | 62.65 |
| – | – | Evaluation of innovation and entrepreneurship ability | 0.12 | 64.13 | 71.95 | 72.12 | 69.12 | 77.08 | 73.52 | 73.07 | 62.65 |
| – | – | Tendency evaluation of innovation and entrepreneurship choice | 0.16 | 65.89 | 65.16 | 64.49 | 68.41 | 76.49 | 72.47 | 68.02 | 63.52 |
| – | – | Self-innovation and entrepreneurship achievements evaluation | 0.10 | 53.54 | 60.02 | 58.45 | 60.12 | 68.25 | 76.45 | 72.41 | 74.22 |
| Achievements of innovation and entrepreneurship education in colleges and universities | Theoretical innovation of innovation and entrepreneurship education in colleges and universities | 0.04 | 64.12 | 71.93 | 72.12 | 69.11 | 77.05 | 73.32 | 75.02 | 62.45 | |
| – | – | Innovation and entrepreneurship education in colleges and universities Practice innovation | 0.02 | 66.49 | 71.55 | 71.59 | 69.22 | 78.25 | 74.61 | 75.02 | 71.49 |
| – | – | Innovation and entrepreneurship education and management innovation in colleges and universities | 0.04 | 64.72 | 74.25 | 71.51 | 69.12 | 77.05 | 74.02 | 76.94 | 71.59 |
| – | – | Achievements of innovation and entrepreneurship education in colleges and universities | 0.05 | 68.27 | 72.35 | 73.41 | 69.82 | 76.45 | 76.49 | 76.44 | 72.22 |
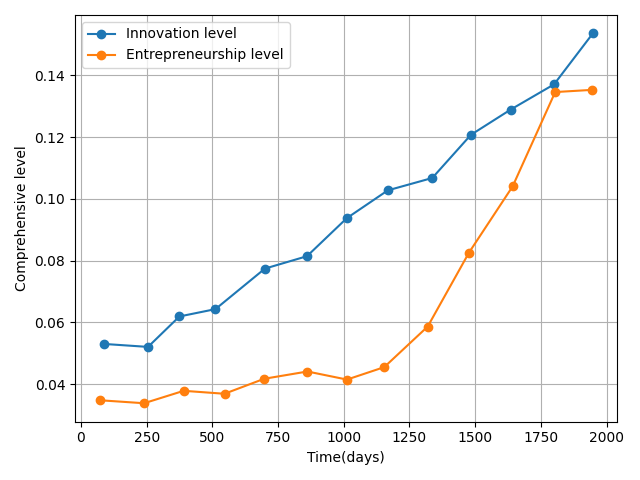
A comprehensive evaluation of the level of innovation and entrepreneurship in each province was conducted using the TOPSIS model based on the entropy value method, and the results are shown in Figure 3, 4 and Table 3. From Figure 3, it can be seen that:1. from 2006 to 2018, the national average innovation and entrepreneurship level shows a continuous increasing trend, and the two time series characteristics show an obvious positive correlation;2. the national regional innovation level shows a linear increasing trend, but the regional entrepreneurship level shows an obvious three-stage characteristic, the entrepreneurship development level from 2006 to 2013 shows a slow increasing trend, from 2014 to 2017 shows a rapid increasing, and a slowing trend from 2017 to 2018[19]. In recent years, China’s innovation performance and efficiency, the number of innovation clusters and their competitiveness, the number and scale of entrepreneurial enterprises, and the performance and competitiveness of entrepreneurship have all been at the forefront of the international arena.
As can be seen from Table 3, there are large differences in regional innovation and entrepreneurship levels in China, with economically developed regions having higher levels of innovation and entrepreneurship. From the perspective of the three major zones, the regional innovation and entrepreneurship levels in the east, central and western regions have all continued to improve. From a chronological perspective, the eastern region has the highest average innovation and entrepreneurship levels and is higher than the national average; followed by the central and western regions, both of which are lower than the national average. From a provincial perspective, the regions with the highest national innovation levels in 2006 were Beijing, Guangdong and Jiangsu, and the lowest regions were Hainan, Xinjiang and Tibet; by 2018 the regions with the highest innovation levels were Guangdong, Beijing and Jiangsu, and the lowest regions were Hainan, Qinghai and Tibet[20].
| Zone | Region | Regional innovation water/2006 | Regional innovation water/2010 | Regional innovation water/2014 | Regional innovation water/2018 | Regional entrepreneurship water/2006 | Regional entrepreneurship water/2010 | Regional entrepreneurship water/2014 | Regional entrepreneurship water/2018 |
| Eastern region | Beijing | 0.1638 | 0.2577 | 0.4166 | 0.5726 | 0.0936 | 0.1205 | 0.2974 | 0.5324 |
| Tianjin | 0.0456 | 0.0552 | 0.0902 | 0.1297 | 0.0314 | 0.037 | 0.0788 | 0.1805 | |
| Hebei | 0.0378 | 0.0506 | 0.074 | 0.1095 | 0.0287 | 0.0274 | 0.0445 | 0.1532 | |
| Liaoning | 0.0574 | 0.0806 | 0.0974 | 0.1185 | 0.0406 | 0.0469 | 0.0521 | 0.0897 | |
| Shanghai | 0.0885 | 0.1335 | 0.1674 | 0.2685 | 0.0702 | 0.1112 | 0.1865 | 0.414 | |
| Jiangsu | 0.1128 | 0.2488 | 0.3567 | 0.4877 | 0.0882 | 0.128 | 0.1649 | 0.3185 | |
| Zhejiang | 0.0935 | 0.1855 | 0.2697 | 0.26 | 0.0489 | 0.1026 | 0.0871 | 0.2287 | |
| Fujian | 0.034 | 0.0526 | 0.0838 | 0.1497 | 0.0405 | 0.049 | 0.057 | 0.1045 | |
| Shandong | 0.0722 | 0.128 | 0.1926 | 0.28 | 0.0487 | 0.1024 | 000874 | 0.2289 | |
| Guangdong | 0.1482 | 0.2612 | 0.3637 | 0.6398 | 0.1145 | 0.1648 | 0.2435 | 0.578 | |
| Hainan | 0.0187 | 0.0328 | 0.0297 | 0.0196 | 0.0138 | 0.0132 | 0.0147 | 0.0278 | |
| Mean value | 0.0796 | 0.1352 | 0.1947 | 0.2865 | 0.0572 | 0.0789 | 0.1214 | 0.2598 | |
| Central region | Shanxi | 0.0365 | 0.0367 | 0.0442 | 0.0512 | 0.0245 | 0.0244 | 0.0207 | 0.0302 |
| Jilin | 0.0378 | 0.0445 | 0.0507 | 0.0689 | 0.0205 | 0.0226 | 0.0202 | 0.0306 | |
| Heilongjiang | 0.0421 | 0.0569 | 0.0601 | 0.0668 | 0.023 | 0.03 | 0.0228 | 0.0915 | |
| Anhui | 0.0349 | 0.0557 | 0.0986 | 0.1496 | 0.028 | 0.0246 | 0.0335 | 0.088 | |
| Jiangxi | 0.0281 | 0.0377 | 0.0487 | 0.0933 | 0.0239 | 0.0236 | 0.0285 | 0.0529 | |
| Henan | 0.0448 | 0.0635 | 0.098 | 0.1398 | 0.0248 | 0.0279 | 0.0485 | 0.1518 | |
| Hubei | 0.0596 | 0.0828 | 0.1294 | 0.2165 | 0.0268 | 0.0338 | 0.0686 | 0.1935 | |
| Hunan | 0.0418 | 0.0625 | 0.0877 | 0.1214 | 0.0 | 258 | 0.0223 | 0.0299 | |
| Mean value | 0.0407 | 0.0549 | 0.0772 | 0.1147 | 0.0249 | 0.0252 | 0.0342 | 0.0908 | |
| Western region | Inner Mongolia | 0.0187 | 0.0237 | 0.0295 | 0.0304 | 0.0172 | 0.0155 | 0.0174 | 0.0253 |
| Guangxi | 0.0265 | 0.0339 | 0.0454 | 0.054 | 0.0198 | 0.0166 | 0.0238 | 0.0572 | |
| Chongqing | 0.0247 | 0.0386 | 0.0582 | 0.0936 | 0.0248 | 0.0312 | 0.0496 | 0.01602 | |
| Sichuan | 0.0545 | 0.785 | 0.1128 | 0.2047 | 0.0249 | 0.0316 | 0.0495 | 0.1600 | |
| Guizhou | 0.0212 | 0.0244 | 0.0306 | 0.0478 | 0.0162 | 0.0135 | 0.0216 | 0.0346 | |
| Yunnan | 0.0336 | 0.0336 | 0.0426 | 0.0541 | 0.015 | 0.0163 | 0.0238 | 0.0385 | |
| Tibet | 0.0087 | 0.0144 | 0.0423 | 0.0102 | 0.0135 | 0.0139 | 0.0055 | 0.0093 | |
| Shaanxi | 0.0596 | 0.0698 | 0.1175 | 0.1779 | 0.0205 | 0.0338 | 0.0306 | 0.0879 | |
| Gansu | 0.0384 | 0.032 | 0.0356 | 0.0412 | 0.0156 | 0.0129 | 0.0145 | 0.0198 | |
| Qinghai | 0.0268 | 0.0188 | 0.0217 | 0.0166 | 0.015 | 0.0096 | 0.0084 | 0.0112 | |
| Ningxia | 0.0158 | 0.0063 | 0.0205 | 0.0177 | 0.0169 | 0.0113 | 0.0127 | 0.0223 | |
| Xinjiang | 0.0296 | 0.0178 | 0.0258 | 0.0296 | 0.0154 | 0.0126 | 0.0128 | 0.0225 | |
| Mean value | 0.0502 | 0.0326 | 0.0487 | 0.0649 | 0.0183 | 0.0177 | 0.0212 | 0.0479 |
According to the regional innovation and entrepreneurship coupling coordination degree evaluation model, the results of the regional innovation and entrepreneurship coupling coordination degree were calculated Table 4. From Table 3 and Table 4, it can be seen that the coupling coordination degree of innovation and entrepreneurship in all provinces and regions of the country as a whole has increased to a greater extent, but there are obvious differences between different regions. From the perspective of coupling coordination and ranking, the coupling coordination of innovation and entrepreneurship levels in the country’s provinces shows a more obvious east-west difference, from 2006 to 2018, the coupling coordination and its ranking in Beijing, Shanghai, Jiangsu, Zhejiang and Guangdong are consistently higher, while Tibet, Qinghai and Ningxia are consistently lower; from the perspective of growth rate, it also shows a pattern of “high in the east and low in the west “From 2006 to 2018, Hubei and Sichuan provinces had the fastest growth rates, with average annual growth rates greater than 1, followed by Guangdong, Beijing, Henan, Zhejiang, Shanghai, Shandong, Tianjin, Jiangsu, Hebei, Chongqing, Anhui, Shanxi and Fujian, whose growth rates were greater than the national average; in addition, Qinghai, Ningxia, Tibet and other regions had The growth rate of coupling coordination is negative and has an overall decreasing trend from 2006 to 2018 .
In the context of “mass innovation, mass entrepreneurship”, innovation and entrepreneurship are developing rapidly in all provinces and regions with high levels of innovation and entrepreneurship development are concentrated in areas with high levels of economic development and Urbanization, such as Beijing, the core city of Beijing-Tianjin-Hebei, Shanghai, Jiangsu and Zhejiang in the Yangtze River Delta, Guangdong, Hubei in the middle reaches of the Yangtze River and Sichuan in the Chengdu-Chongqing region.
| Zone | Region | 2006 | Stage | 2010 | Stage | 2014 | Stage | 2018 | Stage | Growth rate |
| Eastern region | Beijing | 0.3523 | 4 | 0.4195 | 3 | 0.5932 | 3 | 0.7433 | 2 | 0.0926 |
| Tianjin | 0.1946 | 5 | 0.2114 | 4 | 0.2902 | 4 | 0.3914 | 4 | 0.0846 | |
| Hebei | 0.1820 | 5 | 0.1936 | 5 | 0.2381 | 4 | 0.3598 | 4 | 0.0812 | |
| Liaoning | 0.2199 | 4 | 0.2472 | 4 | 0.2672 | 4 | 0.3216 | 4 | 0.0386 | |
| Shanghai | 0.2814 | 4 | 0.3496 | 4 | 0.4204 | 3 | 0.5766 | 3 | 0.0877 | |
| Jiangsu | 0.3162 | 4 | 0.4231 | 3 | 0.4923 | 3 | 0.5515 | 2 | 0.0825 | |
| Zhejiang | 0.2689 | 4 | 0.2241 | 4 | 0.4102 | 3 | 0.3532 | 3 | 0.0878 | |
| Fujian | 0.1912 | 5 | 0.1449 | 4 | 0.2653 | 4 | 0.4985 | 4 | 0.0705 | |
| Shandong | 0.2437 | 4 | 0.3042 | 4 | 0.3600 | 4 | 0.7765 | 3 | 0.0874 | |
| Guangdong | 0.3608 | 4 | 0.1726 | 3 | 0.5452 | 3 | 0.1518 | 2 | 0.0962 | |
| Hainan | 0.1268 | 5 | 0.1781 | 5 | 0.1445 | 5 | 0.4869 | 5 | 0.0166 | |
| Mean value | 0.2489 | 4 | 0.1835 | 4 | 0.3662 | 4 | 0.2281 | 3 | 0.0752 | |
| Central region | Shanxi | 0.1722 | 5 | 0.1922 | 5 | 0.1736 | 5 | 0.2142 | 4 | 0.0274 |
| Jilin | 0.1674 | 5 | 0.1725 | 5 | 0.1798 | 5 | 0.2798 | 4 | 0.0236 | |
| Heilongjiang | 0.1746 | 5 | 0.2047 | 5 | 0.192 | 15 | 0.3366 | 4 | 0.0502 | |
| Anhui | 0.1608 | 5 | 0.2302 | 5 | 0.2402 | 4 | 0.2648 | 4 | 0.0741 | |
| Jiangxi | 0.1825 | 5 | 0.1928 | 5 | 0.1932 | 5 | 0.3815 | 5 | 0.0539 | |
| Henan | 0.2000 | 5 | 0.1908 | 4 | 0.2614 | 4 | 0.4522 | 4 | 0.0906 | |
| Hubei | 0.1816 | 4 | 0.2304 | 4 | 0.3069 | 4 | 0.3078 | 3 | 0.1052 | |
| Hunan | 0.1772 | 5 | 0.1926 | 5 | 0.2258 | 4 | 0.3082 | 4 | 0.0907 | |
| Mean value | 0.1336 | 5 | 0.1912 | 5 | 0.2214 | 4 | 0.3085 | 4 | 0.0582 | |
| Western region | Inner Mongolia | 0.1332 | 5 | 0.1378 | 5 | 0.1496 | 5 | 0.1672 | 5 | 0.0208 |
| Guangxi | 0.1512 | 5 | 0.1539 | 5 | 0.1812 | 5 | 0.2349 | 5 | 0.0462 | |
| Chongqing | 0.1585 | 5 | 0.1802 | 5 | 0.2086 | 4 | 0.3062 | 4 | 0.0778 | |
| Sichuan | 0.1911 | 5 | 0.2228 | 4 | 0.2733 | 4 | 0.4255 | 3 | 0.1023 | |
| Guizhou | 0.1359 | 5 | 0.1356 | 5 | 0.1612 | 5 | 0.2014 | 4 | 0.0401 | |
| Yunnan | 0.1523 | 5 | 0.1524 | 5 | 0.1778 | 5 | 0.2136 | 4 | 0.0337 | |
| Tibet | 0.1039 | 5 | 0.1185 | 5 | 0.1225 | 5 | 0.0982 | 5 | -0.0215 | |
| Shaanxi | 0.1877 | 5 | 0.2201 | 4 | 0.2455 | 4 | 0.3536 | 4 | -0.0108 | |
| Gansu | 0.1425 | 5 | 0.1412 | 5 | 0.1502 | 5 | 0.1698 | 5 | 0.0736 | |
| Qinghai | 0.1572 | 5 | 0.1154 | 5 | 0.1163 | 5 | 0.1163 | 5 | 0.0159 | |
| Ningxia | 0.452 | 5 | 0.0910 | 5 | 0.1277 | 5 | 0.1165 | 5 | -0.0215 | |
| Xinjiang | 0.1258 | 5 | 0.1218 | 5 | 0.1349 | 5 | 0.1264 | 5 | -0.0108 | |
| Mean value | 0.1488 | 5 | 0.1493 | 5 | 0.1706 | 5 | 0.2144 | 4 | 0.0225 |
Innovation and entrepreneurship education is a new development direction of higher education reform, which is related to the cultivation of talents and the quality of higher education. The optimal allocation of resources for innovation and entrepreneurship education for all is not only related to the development of the whole population itself and the cultivation of regional talents, but also to the improvement of the scientific use of national higher education resources. The simulation results demonstrate that efficiency of the use of resources for all people increased from 0.694 to 1.009 to 1.027 to 1.085, an average increase of 18.72%, and tended to be in a balanced state.
The experimental data used to support the findings of this study are available from the corresponding author upon request.
The authors declared that they have no conflicts of interest regarding this work.
This study received funding support from the following sources.Anhui University of Finance & Economics 2024 Undergraduate Research innovation fund project fund, Project number: XSKY24015ZD.