
Natural ecological space, also known as ecological space, is an important part of earth space. Land area, including forests, pastures, wetlands, rivers and lakes, beaches, shorelines, oceans, wastelands, deserts, gobi, glaciers, alpine tundra, uninhabited is-lands, that need to be protected and rationally utilized [1]. The delineation of natural ecological space is the specific process of delineation of natural ecological space. At present, the policies related to the delimitation of natural ecological space in China are mainly related to the legal delimitation of space, among which the ecological protec-tion and repair law delimitation related policies occupy the most important position [2]. Ecological protection and repair law is the “lifeline” of national ecological security. De-lineating the law of ecological protection and repair seems to limit the use of ecological space and the development of resources, but in fact it is to better coordinate the envi-ronmental protection [3].
Facing serious environmental security problems, the state has established the legal system of ecological protection and repair through laws, aiming to implement the principle of risk prevention, prevent all kinds of economic development behaviors that ignore natural laws from the source, and effectively ensure the safety and stability of ecosystem functions [4,5]. Although the legal system of ecological protection and repair has been initially established, the academic and practical circles still have disputes over the connotation and extension of the ecological protection and repair law. The legal system of ecological protection and repair still has a series of problems, such as unclear nature of delineation right, improper configuration, and imperfect regional access evaluation system [6]. To achieve the legalization of the legal delineation and control of ecological protection and repair, we need to respond by defining concepts and im-proving systems. The core area of this study – the newly built area is adjacent to Gan-jiang River in the east. The terrain and geomorphic features are typical hilly areas [7,8].
It is worth mentioning that the largest part of the thermal insulation wetland lake area is located in the new Nanji Township. This is the first time that Ganjiang rated this region as a new region in 2015 [9]. The administrative division of the new zone in-cludes many development zones such as Nanchang Economic Development Zone, Nanchang Airport Economic Zone, and Ganjiang New Area directly under the jurisdic-tion of the state [10]. Economic activities are frequent, and the contradiction between high-quality natural ecological resources and the expansion of economic development cities is increasingly apparent. In newly-built areas, in order to protect economic de-velopment, and remarkable achievements have been made in water pollution preven-tion, front and back of houses, surrounding open space green space and park greening, and rural cleaning projects. Establishing a legal system to protect the natural concept of “Green Mountain is Golden Mountain” [11,12].
The compensation for natural protection is conducive to improving the system of protection in China, and can also provide some reference for the compensation in for-est, fishery, atmosphere and other aspects [13]. It is conducive to accelerating the con-struction of an environment-friendly society, promoting the development and social progress of the whole nature. It is also important to safeguard social justice. They are pioneers and cannot be separated from the new natural ecological space [14]. At present, the domestic technology for delimiting natural ecological space is not mature enough, and the delimitation method has not been unified. This study is just to better realize the implementation of the pilot work of natural ecological space use control. Based on the relevant basic spatial data formed at the time of the pilot work of natural ecological space use control in the new area, the layer overlay analysis method is used to delimit the natural ecological space in the new area, and the management system of its natural ecological space use is studied [15].
Therefore, the purpose is as follows: to provide more mature natural ecological space delineation technologies and methods for the future natural ecological space de-lineation of new areas, and to provide important data basis and institutional safe-guards for the pilot work of natural ecological space use control [16]. The legal system of ecological protection and repair emphasizes regulating the development of ecological space and the use of resources from the source to avoid the occurrence of acts that damage or may damage the interests of the ecological environment, which is con-sistent with the implementation concept of the “risk prevention principle”. China’s en-vironmental protection legislation is basically to “reduce pollution losses”, but the “protection” legislation is not enough. In view of the complexity and irreversibility of the ecosystem, the country should adjust the concept of environmental protection in a timely manner to prevent environmental risks caused by the source, and effectively guarantee the national ecological security [17,18]. From the current legislative situation, such as the lack of systematicness and coordination of the legal system, the excessive prin-ciple of the legislative content, and the abnormal light or lack of legal responsibility, which need to be improved through legislation.
To sum up, the value goal of the legal system of ecological protection and repair is to ensure the national ecological security, which echoes the risk prevention principle upheld by the Environmental Protection Law. Facing the severe ecological security sit-uation. Although China has established a lot of various kinds of natural reserves with a vast area, such as national parks, natural relics, scenic spots, etc., from the current im-plementation status of various types of natural reserve systems, the ecological deterio-ration trend has not been effectively controlled.
The passing ant colony can perceive the existence of this substance and repeat the path the ants have passed before with great probability, or even find a shorter path. Gradually, the concentration of pheromones on the shorter path will increase, which will form a positive feedback process.
Ant colony algorithm was first used to solve business travel problems. Later, with people’s exploration and algorithm maturity, ant colony algorithm is gradually used in natural ecological protection research. Compared with other algorithms, this paper chooses ant colony algorithm to solve the joint scheduling model of natural ecological service value because of its unique advantages. The advantages mainly lie in the low requirements for the selection of the initial route, and the search path chosen by each ant is independent of each other, with few initial parameters, short calculation time, high reliability, and strong global search ability. In the process of completing the tour, in order to avoid problems such as too many residual pheromones causing the failure of the expected value, convergence to the same path, and gradual reduction of the amount of pheromones on the path the ants pass through, the pheromone should be updated when moving from state \(i\) to \(j\), and the pheromone updates on each path are shown in Eq. 1 and 2:
\[\label{e1} {\tau _{ij}}(t + n) = (1 – \rho ) \cdot {\tau _{ij}}(t) + \Delta {\tau _{ij}}(t), \tag{1}\]
\[\label{e2} \Delta {\tau _{ij}}(t) = \sum\limits_{k = 1}^m \Delta \tau _{ij}^k(t). \tag{2}\]
In the above formula,\(\rho\) represents the volatilization coefficient of pheromone; \(\Delta \tau _{ij}^k\) represents the amount of pheromones ants k left on the path \((i,j)\) when searching for food, and \(\Delta {\tau _{ij}}(t)\) represents the increment of pheromones on the itera-tive path.
The update mode selected in this paper is ant cycle model, as shown in Eq. 3:
\[\label{e3} \Delta \tau_{i j}^k=\left\{\begin{array}{l} \frac{Q}{L_k}\qquad \text { Ant } k \text { passes the path }(i, j) \text { in this iteration }, \\ 0 \qquad \text { Other .} \end{array}\right. . \tag{3}\]
In the above formula, Q represents the total amount of pheromones released by a single ant on the path it passes through in one iteration; \({L_k}\) refers to the total distance traveled by Ant K.
Assume the original evaluation index matrix as Eq. 4:
\[\label{e4} B=\left[\begin{array}{cccc} b_{11} & b_{12} & \cdots & b_{1 n} \\ b_{21} & b_{22} & \cdots & b_{2 n} \\ \vdots & \vdots & \vdots & \vdots \\ b_{m 1} & b_{m 2} & \cdots & b_{m n} \end{array}\right] , \tag{4}\] where, \({b_{ij}}\) is the initial value of the ith index in the jth year.
According to different indicator properties, the original evaluation matrix is standardized to eliminate dimensional impact: For positive indicators, see Eq. 5:
\[\label{e5} {r_{ij}} = \frac{{{b_{ij}} – min\left( {{b_{ij}}} \right)}}{{max\left( {{b_{ij}}} \right) – min\left( {{b_{ij}}} \right)}}. \tag{5}\]
For reverse index, see Eq. 6:
\[\label{e6} {r_{ij}} = \frac{{max\left( {{b_{ij}}} \right) – {b_{ij}}}}{{max\left( {{b_{ij}}} \right) – min\left( {{b_{ij}}} \right)}}. \tag{6}\]
Normalized matrix, see Eq. 7:
\[\label{e7} R=\left[\begin{array}{cccc} r_{11} & r_{12} & \cdots & r_{1 n} \\ r_{21} & r_{22} & \cdots & r_{2 n} \\ \vdots & \vdots & \vdots & \vdots \\ r_{m 1} & r_{m 2} & \cdots & r_{m n} \end{array}\right]. \tag{7}\]
Eq. 8 is for the calculation of index entropy:
\[\label{e8} v_i=\frac{1-e_i}{m-\sum_{i=1}^m e_i}, \tag{8}\] where in \({e_i} = – \frac{1}{{1n_{}^{}n}}\sum\limits_{j = 1}^n {{p_{ij}}} 1n_{}^{}{p_{ij}}\) , \({p_{ij}} = \frac{{{r_{ij}}}}{{\sum\limits_{j = 1}^n {{r_{ij}}} }}\), represents the entropy value of the evaluation index.
Ant colony algorithm realizes the spatialization of quantitative evaluation of eco-system service function value. The ant colony algorithm uses a simple framework to describe the relationship between supply, service and value. Supply represents what may be obtained from the ecosystem. Service representatives use the beneficiaries’ in-formation of the service after combining demand. Value represents social preference; At the same time, it allows the calculation of economic and social indicators. Through specific calculation formulas, the ant colony algorithm can enable decision-makers to evaluate the tradeoffs related to different management options, and determine the ar-eas of natural capital investment that can protect human and nature.
Since the ant colony algorithm was released in 2007, 38 versions have been updat-ed. InVEST3.9.0 is used in this paper. This version can evaluate a variety of ecosystem services, which is divided into two major modules, namely, the terrestrial and fresh-water ecosystem assessment module and the marine ecosystem assessment module. The terrestrial and freshwater ecosystem assessment module can also be divided into the freshwater ecosystem assessment module and the terrestrial ecosystem assessment module. Each small module contains evaluation projects in different directions. The biophysical parameter table reflects the relevant attributes of each land use/cover type or landscape type. The table includes five parameters: land use type, land type code, attribute category, plant root depth, and evapotranspiration coefficient of plants of different land use types.
Among them, the land use cover category corresponds to seven types of land use type classification, and they are given the land type code respectively. The value of the attribute category vegetation covered land category (except wetland) is 1, and the value of other land categories (wetland, city, water body, etc.) is 0. The plant root depth is the maximum root depth of the vegetation covered land category, in millimeters. The plant root depth and evapotranspiration coefficient required in this table are mainly ob-tained from the Crop Evapotranspiration – Calculation Guide of Crop Water Demand published by the Food and Agriculture Organization of the United Nations (FAO) and by referring to previous studies. As Table 1 for specific biophysical parameters.
| Land use type | Land type code | Attribute Category | Plant root depth | Transpiration coefficient |
| Cultivated land | 10 | 1 | 1000 | 0.8 |
| Forest | 20 | 1 | 7000 | 0.9 |
| Grassland | 30 | 1 | 1000 | 0.6 |
| Wetland | 50 | 0 | 500 | 1.4 |
| Waters | 60 | 0 | 200 | 1 |
| Artificial surface | 80 | 0 | 100 | 0.5 |
| Nudity | 90 | 0 | 1000 | 0.7 |
After the establishment of the new zone in Ganjiang, the government has strengthened the construction of forest and grassland ecosystems, formed a green bar-rier that combines points, lines and areas, further enhancing the construction of eco-system functions. In combination with comprehensive measures in newly built areas in Ganjiang, and referring to relevant research results and ant colony algorithm manu-al, soil conservation measures in newly built areas in Ganjiang are shown in Table 2.
| Land use type | Vegetation coverage factor | Factors of soil conservation measures |
| Cultivated land | 0.25 | 1 |
| Forest | 0.08 | 0.18 |
| Grassland | 0.7 | 0.6 |
| Wetland | 0.4 | 0.04 |
| Waters | 0 | 0 |
| Artificial surface | 0 | 1 |
| Nudity | 0.6 | 0.32 |
The carbon storage model data required by Invest mainly includes map type and carbon density, including four carbon aggregate data of a new area in Ganjiang. The carbon density data of the four carbon pools are from the carbon intensity developed by the Intergovernmental Panel on Climate Change (IPCC) for greenhouse gas meas-urement in 2006. These carbon density data cover forest land, farmland and other land use types, and more accurately define the carbon pool density values of different re-gions according to their climate regions. With reference to IPCC standards and previ-ous studies are summarized in Table 3.
| Carbon density of aboveground biomass | Carbon density of underground biomass | Soil carbon density | Carbon density of dead organic matter | Land use code | Land use type |
| 4.4 | 1.6 | 38.6 | 2 | 1 | Cultivated land |
| 27.5 | 10.9 | 37.5 | 2.5 | 2 | Woodland |
| 8 | 8 | 37.1 | 3 | 3 | Grassland |
| 10 | 10 | 26 | 3.1 | 4 | Shrub |
| 2.1 | 3.1 | 10.9 | 3 | 5 | Wetland |
| 3.6 | 0 | 31.5 | 0 | 6 | Water body |
| 5 | 5 | 36.4 | 0 | 7 | Nudity |
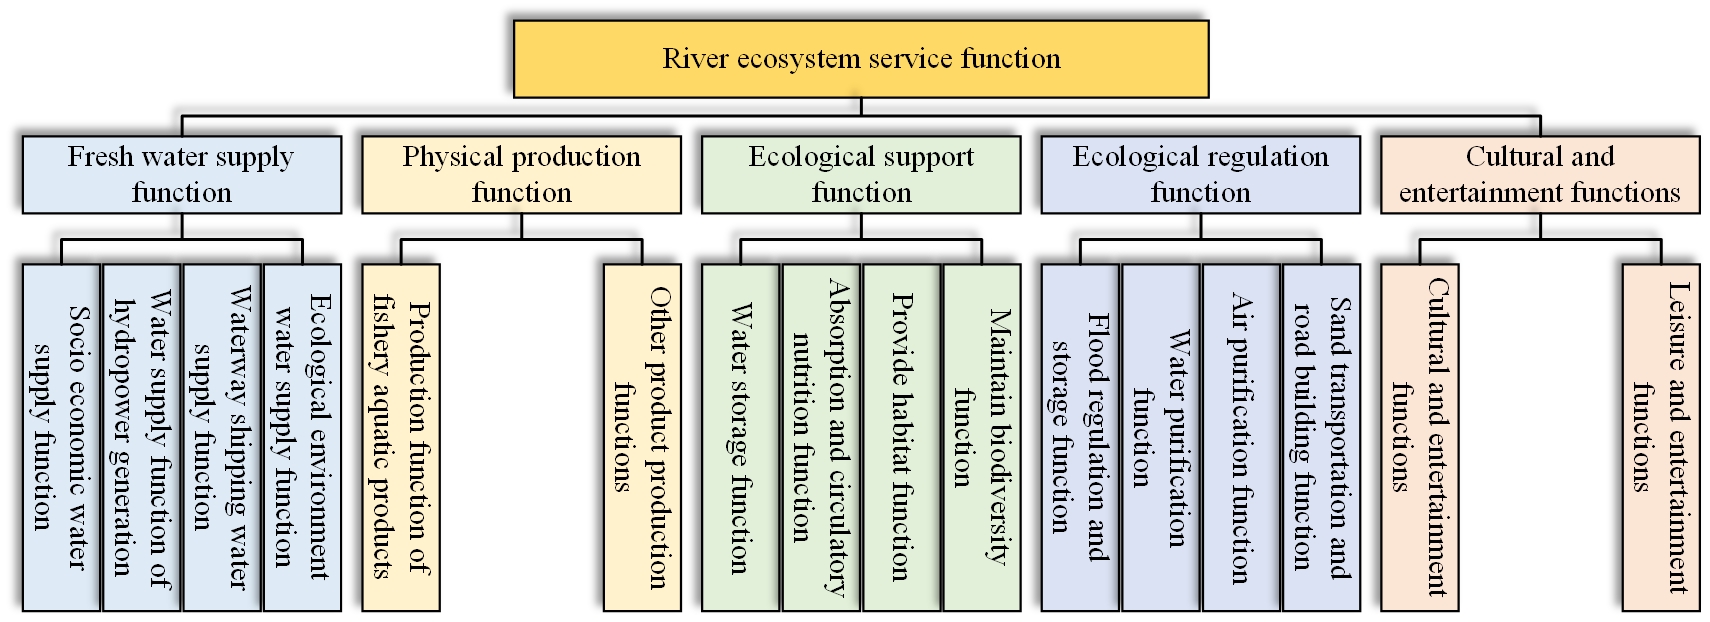
Specifically, the nature of civil law is mainly reflected in the agreement between ecological protectors and ecological beneficiaries that one party has the right to claim protection compensation from the other party in the compensation of natural ecologi-cal protection, which is the expression made by both equal subjects based on their true intentions, the scope of civil legal acts, and the scope of adjustment of civil legal rela-tions. According to the structural characteristics and ecological utility of river ecosys-tem, the service functions of river ecosystem can be classified into 5 items at the first level and 16 items at the second level, as shown in Figure 1.
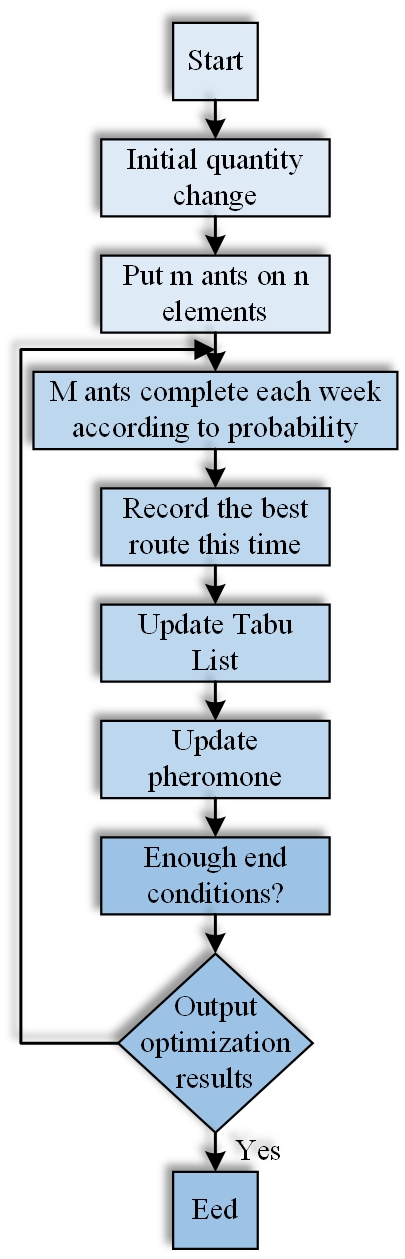
The value of legal system lies in changing specific social relations, protecting social interests, and promoting social justice and stability. The value of the legal system for protecting the natural environment lies in changing the relationship between stake-holders, protecting the natural environment, protecting public interests, protecting nature, and promoting natural harmony and sustainable development. The legal sys-tem of compensation for natural environment protection will help coordinate the rela-tionship between service providers and beneficiaries of natural environment protec-tion, protect the interests of natural population, and achieve harmony and sustainabil-ity in the entire natural environment. According to the principle of ant trading colony, the manufacturing process of ant trading is shown in Figure 2.
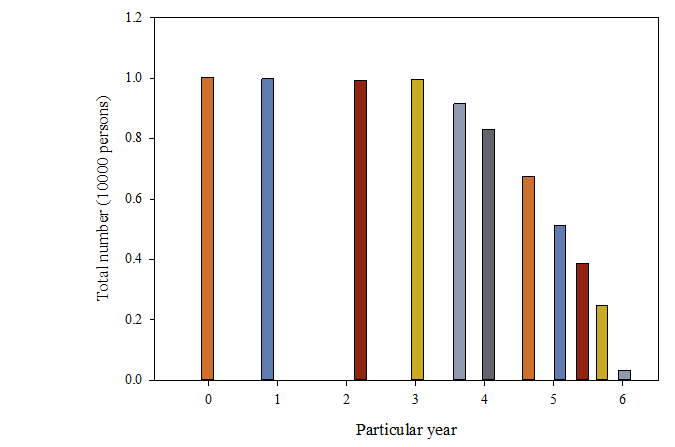
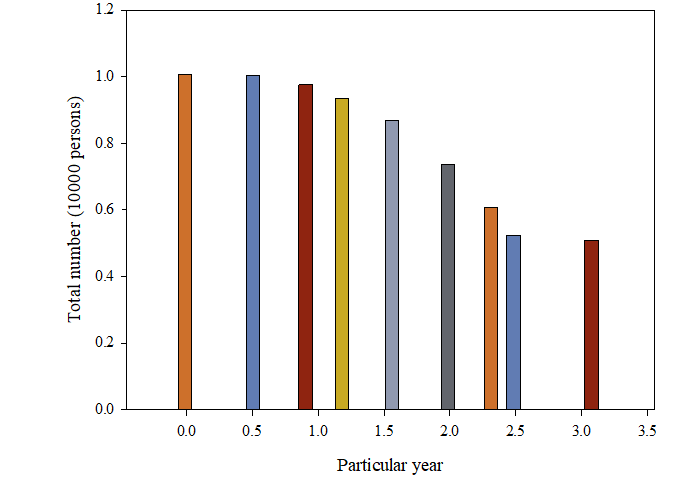
With the massive influx of population, the problems of resource utilization, traffic congestion, environmental overloading, in the newly built areas in Ganjiang are dete-riorating rapidly, and the contradiction between population growth and ecological en-vironment balance is gradually increasing, as shown in Figure 3.
The newly-built area in Ganjiang is an important agricultural production, energy, raw material processing and processing manufacturing base in China. As can be seen from Figure 4, the economic status of the newly-built area in Shanxi Province has steadily improved in recent years, and the industrial layout has gradually improved.
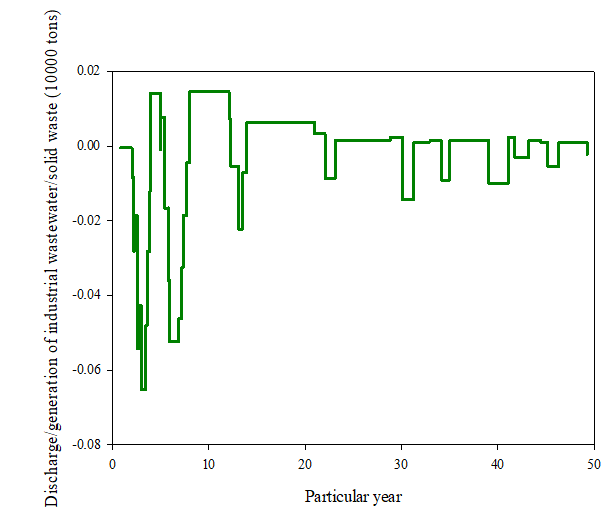
As shown in Figure 5, Jiangxi New Area continues to “three strong” dictatorship, pollution control, anti Japanese war and promote sustainable development. However, the current ecological environment is still severe. For example, the “three industrial waste emissions” are still very high, and the overall air quality is declining.
The value of legal system lies in changing specific social relations, protecting social interests, and promoting social justice and stability. The value of the legal system for protecting the natural environment lies in changing the relationship between stake-holders, protecting the natural environment, protecting public interests, protecting nature, and promoting natural harmony and sustainable development. The legal sys-tem of compensation for natural environment protection will help to manage the rela-tionship between service providers and beneficiaries of natural environment protec-tion, protect the interests of natural persons, and achieve harmony and sustainability in the entire natural environment.
In recent years, although the index of ecosystem development level in newly built areas in Ganjiang is improving, the industrial “three wastes”discharge is still at a high level, and the per capita sewage discharge in the region is still on the rise, as shown in Table 4.
| Particular year | Economic System F7 | Environmental capacity C | Ecosystem E |
| 2008 | 0.000 | 0.1566 | 0.1344 |
| 2009 | 0.0122 | 0.1655 | 0.1188 |
| 2010 | 0.0305 | 0.1477 | 0.1095 |
| 2011 | 0.0508 | 0.1416 | 0.1163 |
| 2012 | 0.0703 | 0.1395 | 0.1457 |
From 2009 to 2018, the ecological security status of newly built areas in Ganjiang has obvious differences in time and space. Now, the following steps are taken to ana-lyze the factors affecting ecological security: to avoid false regression, first verify the stability of data. First, use Eviews software to perform unit root test on the six selected variables. The test results are shown in Table 5, and the test results are stable.
| Variable | LLC/T | LLC/P | ADF/Z | ADF/P | PP/Z | PP/P | Inspection results |
| Ecology | -17.15 | 0.000 | -4.53 | 0.001 | -7.57 | -17.15 | Stable |
| GDP | -21.16 | 0.000 | -3.99 | 0.001 | -6.62 | -21.16 | Stable |
| Industry | -11.75 | 0.000 | -3.11 | 0.002 | -5.99 | -11.75 | Stable |
| Expenditure | -12.21 | 0.000 | -3.46 | 0.002 | -6.16 | -12.21 | Stable |
| Job | -7.82 | 0.000 | -1.85 | 0.032 | -2.88 | -7.85 | Stable |
| Technology | -12.88 | 0.000 | -3.26 | 0.002 | -5.23 | -12.88 | Stable |
According to the above results, it can be comprehensively judged that the above sequences are first-order single integer sequences. The cointegration relationship be-tween variables can be tested by Pedroni test method. As Table 6 for the test results. According to Table 6, except Panel Statistic, Panelrho Statistic and Grouprho Statistic, other statistics reject the original assumption that “there is no cointegration relation-ship”, so it is believed that there is a cointegration relationship between the dependent variables and independent variables selected in this paper, which can be used for re-gression analysis.
| Within group | Panel | Panel | Panel | Panel |
| Statistic | V-Statistic | RHO- Statistic | PP- Statistic | ADF- Statistic |
| Statistical value (P value) | -3.66 | 2.91 | -2.63** | -2.68** |
| Between groups | – | Group | Group | Group |
| Statistic | – | RHO- Statistic | PP- Statistic | ADF- Statistic |
| Statistical value (P value) | – | 4.66 | -4.79*** | -4.15*** |
The newly built areas in Ganjiang are very rich in wetland resources. According to the second provincial wetland resource survey carried out in the newly built areas from 2011 to 2013. According to the second wetland survey data, the total area of wet-lands in the new area is 59723 hectares, accounting for 27.65% of the total land area, in-cluding 9291 hectares of river wetlands, 46829 hectares of lake wetlands, 387 hectares of marsh wetlands, and 3216 hectares of artificial wetlands, as shown in Figure 6.
The suitability of land and space construction and development in newly built ar-eas in Ganjiang is medium to high, with an area of 29048.37 hectares, accounting for 13.45%; 34469.29 hectares, accounting for 15.96%; It is generally suitable for 22353.21 hectares, accounting for 10.35%; Not suitable for 130102.14 hectares; The proportion is 60.24%, as shown in Figure 7.
The “red line” should be fully reflected, and severe punishment should be given to acts that damage the ecological environment. Therefore, to restore the environment, if there is an irreconcilable conflict in ecological environment protection, priority must be given to protecting the ecological environment. No matter what economic benefits are lost, environmental security cannot be destroyed and sustainable development of so-cial economy.
When selecting priority protection areas, selecting low-risk areas means giving priority to low-risk ecosystem services. If high-risk areas are selected, this means that high priority will be given to high ecosystem services. To obtain the largest transaction, 1 you must determine the weight of each ecosystem service. Especially in this paper, the weight of each ecosystem service is 0.163. If the highest weight 1 is the highest or lowest type of ecosystem service specified, the final calculated weight is 0. The highest weight, the average weight of each ecological service. After calculation, the optimal order weight of the study area is shown in Table 7.
| Scene | Risk | $$W_1$$ | $$W_2$$ | $$W_3$$ | $$W_4$$ | $$W_5$$ | $$W_6$$ | Balance |
| 1 | 0.000 | 1 | 0 | 0 | 0 | 0 | 0 | 0 |
| 2 | 0.5 | 0.838 | 0.057 | 0.035 | 0.025 | 0.023 | 0.015 | 0.199 |
| 3 | 0.7 | 0.405 | 0.166 | 0.127 | 0.10 | 70.099 | 0.089 | 0.703 |
| 4 | 3 | 0.163 | 0.163 | 0.163 | 0.163 | 0.163 | 0.1631 | |
| 5 | 5 | 0.025 | 0.081 | 0.135 | 0.192 | 0.23 | 0.303 | 0.743 |
| 6 | 12 | 0 | 0 | 0.003 | 0.015 | 0.142 | 0.836 | 0.185 |
| 7 | 10000 | 0 | 0 | 0 | 0 | 0 | 0 | 0 |
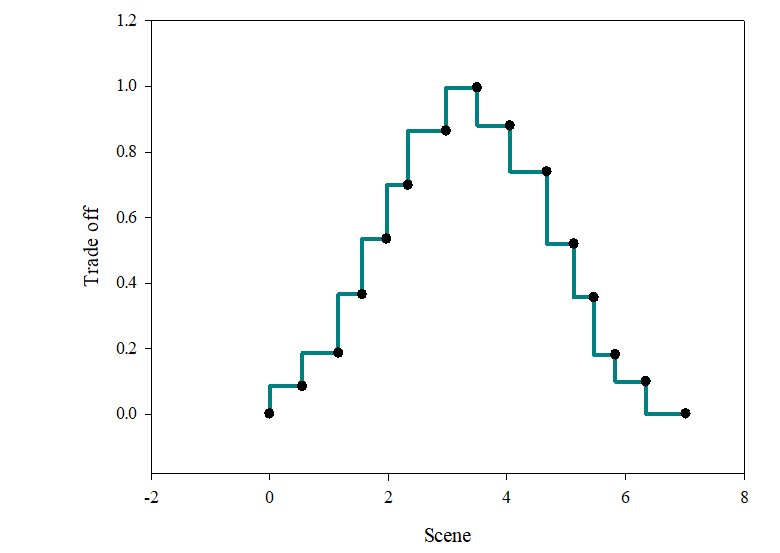
According to the OWA model, the trade off degree changes under different se-quence weights 16W- W are extracted as shown in Figure 8. When the risk \(\alpha\) is 1, the weight of each grid layer is balanced, and the trade-off is the highest.
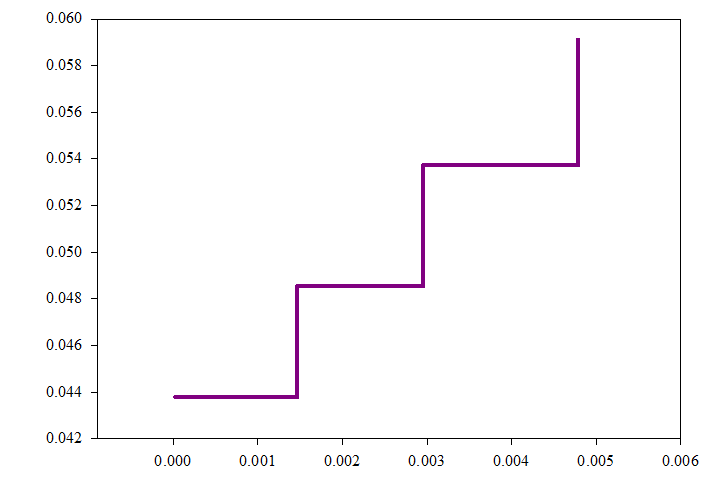
In all scenarios, only the six ecosystem services under Scenario 4 (\(\alpha\)=1) have im-proved their protection efficiency to varying degrees, and their average protection effi-ciency is the highest among all scenarios, as shown in Figure 9. In addition, Scenario 4 (trade off=1) has the highest tradeoff among the seven scenarios.
As shown in Figure 9, the average protection efficiency is 20.9%.
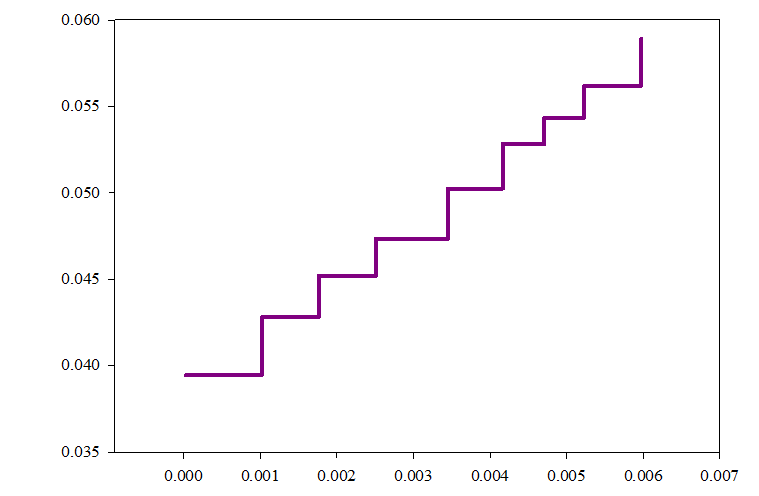
In this file, the threshold area is used to calculate the ratio of multiple source points to sources in all areas of the study area under different assumptions, but it is only limited to the minimum area. As shown in Figure 10, if the threshold value ex-ceeds 0 to 10 , the proportion of some positions of the original area to the initial total area will be greatly reduced. The threshold is raised to 5\(k{m^2}\), and some places in the ecological garden are gradually reduced, often flat.
The relief of ecological environmental damage mainly adopts the “command con-trol” administrative management mode; However, a series of problems such as “local-ism”, “economic orientation”, “power rent-seeking” and so on inevitably emerged in the process of the government’s performance of its duties, which led to the growing eco-logical security problems, and the public doubts whether the administrative organs can effectively deal with environmental protection issues. With the rise of environmental public interest litigation, the state has also begun to respond to the government’s en-vironmental failure and environmental public interest protection problems by ex-panding civil judicial relief. The responsibility for ecological restoration has also be-come a way of bearing responsibility for ecological environmental damage relief [19].
At present, it is necessary to establish the impact assessment system of natural environment compensation as soon as possible, improve the compensation procedure for protecting the natural environment, and improve the litigation mechanism for compensation for natural environment damage. Only by accelerating the legislative guarantee of natural ecological protection compensation, can the implementation effect of natural ecological protection compensation be effectively implemented. In this pa-per, the results of single database scheduling and joint scheduling are compared and analyzed. The running results of the model show that the ant colony algorithm is an effective algorithm. The advantages of the algorithm in solving the problem of 500 times frequency sharing agenda are reflected in the algorithm. The best solution is to find the best global integrated solution, obtain the maximum total energy value of eco-logical services, and increase the average protection efficiency to 20.9%.
The experimental data used to support the findings of this study are available from the author upon request.
The author declares no conflicts of interest regarding this work.