
Color has a direct impact on human emotions, behavior and cognition. Different colors can trigger different emotional responses, such as red will stimulate people’s excitement and vitality, while blue will make people feel quiet and relaxed. In the theme design of subway carriages, the selection of appropriate color matching lighting scheme can effectively enhance the travel experience and comfort of passengers [6,15,22,17].
In recent years, with the rapid development of the national economy, the number of cars in China has increased dramatically, and road congestion has become increasingly serious, and all major cities have constructed underground transportation – subway to alleviate traffic congestion. And the color lighting in the subway carriages has become a problem that the subway carriages designers must consider, not only need to ensure that the normal light lighting in the carriages, but also need to take into account the psychological reaction of the passengers in the color lighting [10,19,11,27]. Color as an important element in the design, can be matched with a reasonable color scheme to create a comfortable, warm or stylish atmosphere, thus enhancing passenger satisfaction and comfort, increasing the passenger experience [18,21]. The application of color psychology in the design of subway cars can better guide the emotions of passengers, allowing them to relax in the short ride time, reduce stress and enhance the sense of well-being [12,24,26]. Reasonable color matching can also improve the recognition and preference of passengers to the design of subway carriages, establish a good image for the urban transportation system, and strengthen the trust and dependence of passengers on public transportation. The study of the color creativity of subway car theme design is not only conducive to enhance the passenger experience, but also has an important significance for the image shaping and development of urban transportation system [3,7,16,8].
Literature [23] evaluates and compares the visual comfort of the subway car lighting environment, by proposing a combination of objective and subjective visual comfort evaluation method and conducting a questionnaire survey of passengers, the results show that the lighting environment of subway cars has no effect on passengers using cell phones, and that the overall perception of passengers on the brightness of the compartments is positively proportional to the vertical illumination, and that the color temperature of the compartments does not have much effect on passengers. Literature [5] indicated that subway carriages have revolutionized the traditional stereotypical design approach through colorful and diverse lighting design, which can create a more comfortable environment through dynamic changes in the amount of light, intensity, color temperature, and colored lighting. Literature [9] investigated the effect of cluster lighting on driver’s mood when the color and dynamic patterns of lights are out of sync. Experiments with students yielded that their tension responses were more significantly affected by the color and pattern of the light, while sudden high-frequency light in dynamic mode was able to produce maximum tension. It is shown that the driver’s emotional response is influenced by the comfort level of the lighting design in the vehicle. Literature [4] aims at combining fuzzy logic analysis with computer simulation in order to determine the relationship between subway car elements and user responses. By compiling the factors affecting passenger comfort and analyzing a sample, it was concluded that seat design, good lighting, and spatial divisions can affect passenger comfort and safety. In addition, passenger satisfaction is also influenced by aspects such as aesthetic design and tidiness. Literature [20], using an airplane as an example, states that proper color lighting effects are beneficial in providing a more comfortable and enjoyable flight experience. The gender, age and ethnic background of passengers will produce different color preferences, so this study provides a reference for lighting design to satisfy Chinese passengers.
Literature [25] used a two-step approach to investigate the effects of visual stimuli on passenger comfort in airplanes. Several influencing factors were derived through experimental and survey analysis, and the most obvious influences were lighting, color and spatial arrangement, respectively. Literature [1] takes the airplane cabin as an example. It is pointed out that comfort is more complex structure, which is based on passengers’ perception. The study reveals that different characteristics of the seats have an impact on passenger comfort, while other factors in the aircraft also have an impact on passenger comfort. Literature [2] discusses the impact of different environmental design features on passenger safety perceptions using passenger ships as an example. A survey was conducted with 97 passengers, and the results indicated that passengers felt safe in situations such as “no layering of walls” and “the presence of an outdoor view”. Literature [14] clarified that although the lighting in the compartments is standardized and designed to provide a safe and comfortable lighting environment for passengers, it does not fully satisfy the preferences of all passengers. Through a simulation experiment utilizing 40 passengers’ ride experiences, the results showed that passengers’ subjective responses are more influenced by their preferences and expectations, while illumination has a lower impact. Literature [13] demonstrated the results of a study on the satisfaction of Moscow residents and tourists with the metro, pointing out many negative factors in the metro environment, including crowds, lack of sunlight, noise pollution, etc., and emphasizing the importance of lighting as an influencing factor in keeping passengers in good spirits.
In this study, the pruning algorithm was first used to achieve the optimization of target detection. The optimization design of the expression feature extraction classification network was carried out to construct an expression recognition model for subway passengers, and its detection and recognition effect was tested to provide a scientific basis for the following research on the influence of passengers’ psychological reaction. In order to deeply study the influence of passengers’ psychological reaction, this paper also constructs a multi-dimensional data analysis model using data mining. Finally, through empirical analysis, the psychological reaction of passengers is studied with the change of expression as the entry point. Taking the carriage color lighting design as the main focus, supplemented by passenger evaluation, we study the influence of multi-dimensional data such as time and space on passengers’ psychological responses.
Target detection is a key task and research direction in the field of computer vision. Its core lies in training algorithmic models to enable computers to accurately and efficiently recognize various types of instances in an image, and at the same time return key information such as the categories and locations of these instances. In the task of target detection, how to make the model accurately and efficiently recognize the corresponding target is the main challenge faced by R&D and application personnel. There are many target detection methods, and the current mainstream method is the target detection method based on deep learning. Deep learning-based target detection methods are categorized into two-stage and single-stage methods. The two-stage method has high detection accuracy, and the single-stage method improves detection speed compared to the two-stage method, making real-time detection possible.
R-CNN series algorithm is the representative of two-stage target detection algorithm, R-CNN algorithm in the feature extraction stage will be the traditional image feature extraction method replaced by AlexNet convolutional neural network model, the first time to introduce convolutional network into the field of target detection.R-CNN network that is for the non-conventional scene of the construction of the basis of the fine detection algorithm, the network’s computational process is divided into four parts.
R-CNN algorithm is the network first input target detection image, the second part of the network based on selective search algorithm to collect about 2000 candidate region rectangular box, and based on the similarity calculation method to merge the small region. The selective search algorithm combines the advantages of exhaustive search and segmentation, while the similarity calculation method is based on color, texture, scale and shape.
Color similarity measure
Each region of the image is represented based on a three-channel (R-channel, G-channel, B-channel) color histogram, based on the L1 normalization will be each sub-region, 25bins color histogram of each channel, each region \(r_{i}\) to find the vector \(C_{i} =\{ c_{i}^{1} ,c_{i}^{2} ,…,c_{i}^{n} \} ,n=75\) of dimension 75, counting the difference formula: \[\label{GrindEQ__1_} S_{colour} (r_{i} ,r_{j} )=\sum _{k=1}^{n}{\rm minutes} (c_{i}^{k} ,c_{j}^{k} ) , \tag{1}\] \[\label{GrindEQ__2_} C_{t} =\frac{size(r_{i} )\times C_{i} +size(r_{j} )\times C_{j} }{size(r_{i} )+size(r_{j} )} , \tag{2}\] \[\label{GrindEQ__3_} size(r_{t} )=size(r_{i} )+size(r_{j} ) . \tag{3}\]
Texture similarity
Based on the Gaussian differentiation of \(\sigma =1\), the gradient statistics of 8 different directions of each color channel of each region with dimensions consistent with the size of the region, the histogram of 10bins is computed for each direction, and the number of histogram intervals is \(8\times 3\times 10=240\), the vector \(T_{i} =\{ t_{i}^{1} ,t_{i}^{2} ,…,t_{i}^{n} \}\) with dimension 240 is obtained, and \(T_{i} =\{ t_{i}^{1} ,t_{i}^{2} ,…,t_{i}^{n} \}\)is the texture histogram of each region, and the texture similarity is computed as: \[\label{GrindEQ__4_} S_{texture} (r_{i} ,r_{j} )=\sum _{k=1}^{n}{\rm minutes} (t_{i}^{k} ,t_{j}^{k} ) . \tag{4}\]
Scale similarity
In order to make the scale more uniform when the regions are merged, the small size regions are merged first as far as possible, \(size(im)\) is the image pixel size, and the similarity is calculated as: \[\label{GrindEQ__5_} S_{size} (r_{i} ,r_{j} )=1-\frac{size(r_{i} )+size(r_{j} )}{size(im)} . \tag{5}\]
Shape overlap
In order to calculate the overlap of \(r_{i}\) and \(r_{j}\) regions, \(size(BB_{ij} )\) is the size of the rectangular box after \(r_{i}\) and \(r_{j}\) are merged, and the shape overlap is calculated as: \[\label{GrindEQ__6_} S_{fill} (r_{i} ,r_{j} )=1-\frac{size(BB_{ij} )-size(r_{i} )-size(r_{j} )}{size(im)} . \tag{6}\]
In summary, the total similarity is calculated as: \[\label{GrindEQ__7_} S(r_{i} ,r_{j} )=a_{1} S_{colour} (r_{i} ,r_{j} )+a_{2} S_{texture} (r_{i} ,r_{j} )+a_{3} S_{size} (r_{i} ,r_{j} )+a_{4} S_{fill} (r_{i} ,r_{j} ) , \tag{7}\] of these, \(a_{i} \in \{ 0,1\}\).
The YOLOv5 target detection algorithm focuses on improving the applicability and lightweighting the algorithm to make it easy to be deployed into relevant application scenarios. In this study, we consider the real-time requirements of passenger detection in stations in normal scenarios, and construct the passenger flow detection algorithm in stations based on YOLOv5. This chapter uses the YOLOv5 target detection algorithm, which is a series of algorithms for the lightweight improvement and further optimization of the detection speed, which is more suitable for detecting the need to meet the real-time and the need to deploy the application of the metro rail transit scene.
Considering the application of the algorithm on the ground, it is necessary to save computational resources and facilitate the deployment and transplantation of the model. Therefore, the YOLOv5 algorithm needs to be compressed and improved to increase its detection speed, which in turn can be deployed to different scenes in rail transit stations. In this chapter, the YOLOv5 algorithm is improved based on the idea of channel pruning, which makes the YOLOv5 algorithm more compact and facilitates its deployment to scenes in rail transit stations.
The specific process of pruning is to train the YOLOv5 algorithm normally based on the dataset labeled with passenger heads to obtain an initial network capable of detecting passenger heads. Normal training allows the algorithm to focus on detecting passenger heads in a rail transit station scene, and YOLOv5, which has completed normal training, is used as the initial network to prune the (BN) layer. Sparse training is performed to change the weight distribution of the parameters of the BN layer so that its mean value gradually tends to 0. The BN layer whose parameters tend to 0 is pruned and the parameters of the algorithm are reduced after pruning. Fine-tuning the algorithm after pruning makes the accuracy of the algorithm back up, and the compression work is completed to get the compact algorithm.
First of all, the BN layer can effectively solve the problem of training difficulties and convergence difficulties caused by the increase in depth of the deep neural network, and play a role in protecting the gradient and preventing overfitting.The formula for the BN layer is: \[\label{GrindEQ__8_} \hat{x}=\frac{x_{i} -\mu _{B} }{\sqrt{\sigma _{B}^{2} +{\rm }} } \mathop{\scriptscriptstyle\leftharpoondown}\limits^{\displaystyle\rightharpoonup} ;\mathop{\scriptscriptstyle\leftharpoondown}\limits^{\displaystyle\rightharpoonup} y_{i} =\gamma \hat{x}+\beta , \tag{8}\] where \(x_{i}\) is the input of BN layer, \(y_{i}\) is the output of BN layer, \({\rm {\mathcal B}}\) is the current batch. \(\mu _{B}\) is the mean of the feature map on the small batch \({\rm {\mathcal B}}\), \(\sigma _{B}\) is the standard deviation of the feature map on the small batch \({\rm {\mathcal B}}\), \(\gamma\) is the weight of the BN layer. \(\beta\) is the deviation of the BN layer, and this output can be clipped when the weight \(\gamma\) is close to 0.
Second, some of the weights \(\gamma\) are made to approach 0 by sparsification training, which requires adding L1 regular constraints for weights \(\gamma\) within the loss function to achieve \(\gamma\) sparsification: \[\label{GrindEQ__9_} L=\sum _{(x,y)}l (f(x,W),y)+\lambda \sum _{\gamma {\rm }\Gamma }g (\gamma ) , \tag{9}\] where \(l(f(x,W),y)\) is the normal trained loss and \(\lambda \sum _{\gamma {\rm }\Gamma }g (\gamma )\) is the L1 regular constraint of \(\gamma\), where \(g(\gamma )=|\gamma |\). \(\lambda\) is the regularity coefficient to balance the original loss function and constraint term.
The channels with \(\gamma\) approaching 0 are cut off after sparsification, here the \(\gamma\) values with values of 0.1 and below after sparsification training are cut off. And the training is fine-tuned to bring back the accuracy of the detection and get a more compact detection algorithm with the passenger’s head as the target. The more compact YOLOv5 target detection algorithm after the pruning is completed is combined with the Deep SORT target tracking algorithm for passenger counting, and the number of passengers counted at different time periods is combined into a passenger flow time series.
Finally, the detection collision point of the passenger detection frame is specified. Two horizontal centered detection lines are set in the monitoring frame, and the red calibration point of the passenger running track is used to judge the passing direction and number of passengers in the frame through the sequence of the horizontal detection lines in the frame according to the red calibration point of the passenger running track.
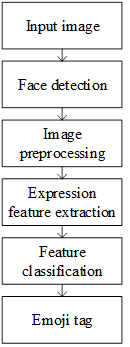
The change of human expression is the most intuitive response to the psychological reaction of people, in order to effectively analyze the impact of subway car color lighting on the psychological reaction of passengers, this paper in constructed an expression recognition algorithm based on target detection. Face detection belongs to the target detection task, responsible for target localization and detection, its performance will directly affect the performance of the face expression recognition system, is a major research direction in the field of computer vision, is divided into the traditional machine learning stage and deep learning stage. The composition of the expression recognition system is shown in Figure 1, the definition of expression in expression recognition can be divided into static six basic expressions and dynamic facial action coding system (FACS). Static expressions include anger, disgust, fear, happiness, sadness, and surprise.FACS encodes facial muscle movements and shows the correspondence between different actions and different expressions. The expression recognition system can be divided into face detection, image preprocessing, feature extraction and feature classification.
The recognition accuracy of face expression depends largely on feature extraction, and the feature information directly affects the network classification effect. Common methods for feature extraction include Gabor wavelet, LBP algorithm and feature extraction based on deep learning.
Gabor wavelet is sensitive to the edge information in the image, and can effectively extract local features in different directions and scales of the image. And it has low sensitivity to light and can effectively shield the influence of light changes. The \(i\) filter of the 2D Gabor wavelet is: \[\label{GrindEQ__10_} G_{u,v} (x,y)=h(x,y)\phi _{u,v} (x,y) , \tag{10}\] where, \(u\) is the direction, \(v\) is the scale: \(G_{u} ,v(x,y)\) is the filtering result: \(h(x,y)\) is the pixel value of the point, \(\phi _{u} ,v(x,y)\) is the kernel function.
LBP algorithm is simple and efficient, with gray scale invariance and rotational invariance, can effectively extract local texture features.LBP encoding first set the window, if the surrounding point is larger than the center point pixel value then encoded as 1, and vice versa as 0. Then take the value in clockwise order and then converted to decimal, get the center of the LBP value, through the LBP value to calculate the histogram, connecting the histogram of each point can get the LBP feature vector: \[\label{GrindEQ__11_} LBP(x_{c} ,y_{c} )=\sum _{p}2^{p} S(i_{p} -i_{c} ) , \tag{11}\] \[\label{GrindEQ__12_} S(x)=\left\{\begin{array}{l} {1,\mathop{\scriptscriptstyle\leftharpoondown}\limits^{\displaystyle\rightharpoonup} x\ge 0} \\ {0,\mathop{\scriptscriptstyle\leftharpoondown}\limits^{\displaystyle\rightharpoonup} x<0} \end{array}\right. \tag{12}\] where \((x_{c} ,y_{c} )\) is the position of the center pixel point, \(i_{c}\) and \(i_{p}\) are the grayscale values of the center and adjacent pixel points, respectively, and \(S(\cdot )\) is the sign function.
The attention mechanism in computer vision controls the weight distribution to highlight the role of feature information regions on the image that are favorable for recognition and classification, and weaken the regions that are not important for recognition and classification. The way the weights are distributed can be categorized into soft attention and strong attention. Strong attention is given to the region that tends to pay attention to the score of 1, while the region that tends to ignore the score of 0. Soft attention in the region of the (0, 1) interval of continuous weight distribution, the specific weight of the use of neural network training, more fine and higher error tolerance, this paper uses the attention mechanism is the soft attention mechanism. For the different functions of the attention mechanism, it can be divided into spatial and channel domains.
The spatial and channel domain attention mechanisms improve the ability of the network to extract feature information from different directions, so combining the two can better discriminate the importance of the information contained in each region of the feature map, further improving the network accuracy and ubiquity.
The Convolutional Block Attention Mechanism Module (CBAM) is proposed to obtain the channel domain weights multiplied by the input features, and then the spatial domain weights multiplied by the features, so that the output feature map enhances the attention to the important information in the space and channels. In this case, CAM has constant channel dimension and compressed spatial dimension and SAM has constant spatial dimension and compressed channel dimension.
In the CAM structure the input feature map is divided into two parallel paths through the Global MaxPool and Global AvgPool to transform the feature map of \(R^{H\times W\times C}\) into the size of \(R^{1\times 1\times C}\) in the following process: \[\label{GrindEQ__13_} F_{c}^{Avg} =\frac{1}{H\times W} \sum _{i=1}^{H}\sum _{j=1}^{W}F_{c} (i,j)\mathop{\scriptscriptstyle\leftharpoondown}\limits^{\displaystyle\rightharpoonup} ,\mathop{\scriptscriptstyle\leftharpoondown}\limits^{\displaystyle\rightharpoonup} c=1,2,…,C , \tag{13}\] \[\label{GrindEQ__14_} F_{c}^{Mox} =\max_{ {i=1,2,…,H}\; {j=1,2,…,W}} (F_{c} (i,j)) , \tag{14}\] where \(F_{c}^{Avg} ,F_{c}^{Max}\) is the mean and maximum of the feature map \(F\) channel \(c\), respectively.
The two pooled feature vectors are multiplied by the ShareMLP structure to the input image point cloud with the same weights, which contains two fully connected layers with a weight matrix of \(W_{3} ,W_{4}\) and a ReLU excitation layer in between the two, which make up the bottleneck structure, and the number of channels is compressed to \(C/r\), \(r\) denotes the rate of reduction, and then dilated back to \(C\), to obtain the result after two activations, the process is: \[\label{GrindEQ__15_} \begin{cases} {\tilde{F}_{Max} =W_{4} (\delta (W_{3} F_{Max} ))}, \\ {\tilde{F}_{Aog} =W_{4} (\delta (W_{3} F_{Avg} ))}. \end{cases} \tag{15}\]
The two features output from ShareMLP are summed and then activated by Sigmoid to generate the channel attention weight \(M_{C}\), which is then multiplied with the input feature map to obtain the channel attention feature map \(U\), in the process of: \[\label{GrindEQ__16_} \begin{cases} {M_{C} =\sigma (F_{\max } +F_{avg} )}, \\ {U=M_{C} \times F}. \end{cases} \tag{16}\]
Completion of the channel attention operation of \(U\in R^{H\times W\times C}\), the module before and after the dimension is unchanged, CAM and SENet is different from the addition of a parallel MaxPooling, the extracted features are more comprehensive and rich.
SAM focuses on the location information of the target, the U output of the CAM through the MaxPool and AvgPool to form two tensors of \(R^{K\times W\times 1}\), and then based on the channel of the two tensors to do the Concat operation will be stacked and then through the convolution operation will be the channel to 1 at the same time to ensure that the H, W is unchanged, the specific process is as follows: \[\label{GrindEQ__17_} \begin{cases} {U_{c}^{Ang} (i,j)=\frac{1}{C} \sum\limits_{m=1}^{C}u^{c} \mathop{\scriptscriptstyle\leftharpoondown}\limits^{\displaystyle\rightharpoonup} (i,j)\mathop{\scriptscriptstyle\leftharpoondown}\limits^{\displaystyle\rightharpoonup} ,\mathop{\scriptscriptstyle\leftharpoondown}\limits^{\displaystyle\rightharpoonup} c=1,2,…,C}, \\ {U_{c}^{Max} (i,j)=\max\limits_{m=1,2,…,C} (u^{c} (i,j))}, \\ {U_{c}^{Cone} =f^{7\times 7} ([U_{c}^{Max} :U_{c}^{Avg} ])}, \end{cases} \tag{17}\] where \(U_{c}^{Max} (i,j)\) and \(U_{c}^{A\nu g} (i,j)\) are the MaxPool and AvgPool of input features \(U\) at \(c\) channel \((i,j)\) coordinate positions, \(U_{c}^{Conv}\) is the convolved feature map, and \(f^{7\times 7}\) represents a 7 \(\mathrm{\times}\) 7 convolution kernel.
Then the feature map is activated by Sigmoid to get the spatial attention weight \(M_{s}\), which is multiplied with the feature map \(U\) to get the output feature map \(Y\in R^{H\times W\times C}\) of the mixed domain attention to complete the spatial attention operation.
The scale fusion method in this paper can make the feature map take into account the semantic features and key detail features, and effectively improve the network accuracy, so the multi-scale fusion structure is also set up on the expression feature extraction classification network according to the idea of multi-scale fusion.
The datasets utilized for the experiments in this section include the datasets CIFAR-100 and ImageNet for performance testing. The pruning algorithm is evaluated by the CIFAR-100 dataset and ImageNet is used to evaluate the generalization of the network after pruning to verify the sensitivity of the pruning model to the dataset.Both datasets, CIFAR-100 and Imagenet, originate from the fact that they both consist of a training set and a test set. The training set is used to train the pruned model and the test set is used to test the classification accuracy of the trained pruning model.
The model structures used to do the adaptive pruning experiments include VGG19 fully convolutional network and ResNet56 residual model, which are more representative. The performance of the pruning algorithm on the CIFAR-100 dataset is shown in Table 1, where all the accuracies are tested based on single-image center cropping. Where B is the abbreviation of “billion”, the acceleration ratio is calculated according to the FLOP theory. From the results, it can be seen that both VGG19 and ResNet56 can achieve the fastest inference acceleration after pruning, but the pruning method is more aggressive, which leads to a significant decrease in the accuracy. Compared with the rest of the methods, the method proposed in this paper achieves the most inference speedup, which is 3.79x and 3.55x on the VGG19 and ResNet56 models, respectively. and the method in this paper achieves the advantage in improving the inference speedup while also achieves the relatively desirable results in terms of accuracy The pruning model of VGG19 achieves the optimal performance in terms of the Top-1 accuracy (0.7559), the pruning model of ResNet56’s pruning model achieved optimal performance in terms of Top-5 accuracy (0.9119). Although the CP and SP algorithms also have higher performance in terms of accuracy, the introduction of relatively complex operations results in a limited improvement in inference speed.
| Model | Method | Top-1 | Top-5 | #FLOPs | Speedup ratio |
| VGG19 | Baseline | 0.7664 | 0.9192 | 28.22B | 1.00x |
| Ours | 0.7559 | 0.8979 | 7.78B | 3.79x | |
| FP | 0.6874 | 0.8098 | 7.36B | 3.75x | |
| NSP | 0.7177 | 0.8772 | 9.78B | 2.83x | |
| CP | 0.7428 | 0.8985 | 10.27B | 2.73x | |
| SP | 0.7364 | 0.8885 | 9.11B | 3.15x | |
| ResNet56 | Baseline | 0.7854 | 0.9373 | 8.49B | 1.00x |
| Ours | 0.7461 | 0.9119 | 2.78B | 3.55x | |
| FP | 0.6759 | 0.7743 | 2.61B | 3.25x | |
| NSP | 0.7664 | 0.8990 | 2.89B | 2.93x | |
| CP | 0.7560 | 0.8686 | 3.10B | 2.86x | |
| SP | 0.7739 | 0.8993 | 3.73B | 2.42x |
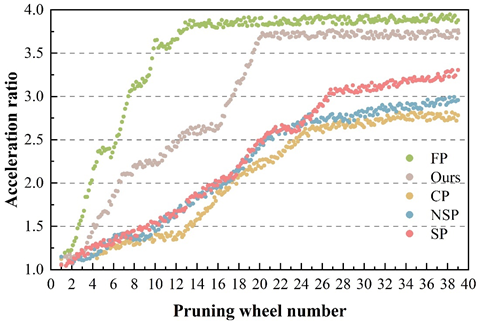
The variation of the speedup ratio of different pruning algorithms with the number of pruning is shown in Figure 2. The FP algorithm directly sets all the convolutional kernels smaller than the threshold to zero, and thus converges at the 14th round of pruning. The result of too fast pruning is that some valuable convolutional kernels cannot participate in the subsequent computation. The acceleration ratio of the pruning algorithm proposed in this paper has a faster convergence rate compared to other algorithms and converges at 20 rounds of pruning. This is due to the exploratory mechanism of the algorithm in this paper, which can quickly find low value convolutional kernels for classification tasks.
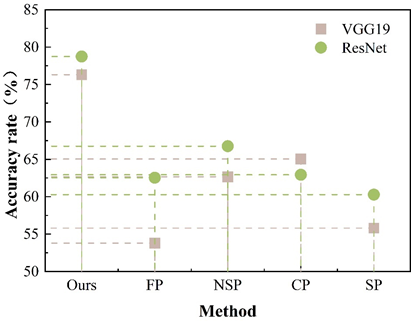
After the pruning is completed, it is necessary to further test the migration learning ability of the pruned model to prevent that some of the pruned mini-models have lower generalization ability in other datasets because of the defects of the algorithm. In this paper, we use Imagenet dataset to test the generalization performance of the pruning model. The Top-1 accuracy of the pruning model on the Imagenet dataset is shown in Figure 3. The pruning method in this paper has the strongest generalization ability and performs much better than other methods on the Imagenet dataset, with accuracy rates of 76.308% and 78.738% for the VGG19 and ResNet models, respectively. It indicates that the convolutional kernels related to the data itself are retained during the pruning process, rather than blindly trimming out the connections that have little impact on the performance.The performance loss of the SP algorithm is more obvious, which indicates that the method filters out some necessary convolutional kernels during the pruning process, which in turn fails to extract valuable information from the new dataset, and that there is a problem of overfitting of pruning model on the original dataset. Taken together, the target detection optimization based on the pruning model in this paper has good performance and can meet the needs of target detection for subway passengers.
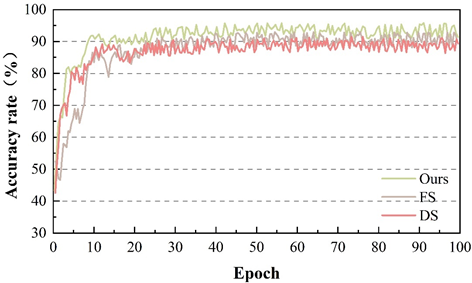
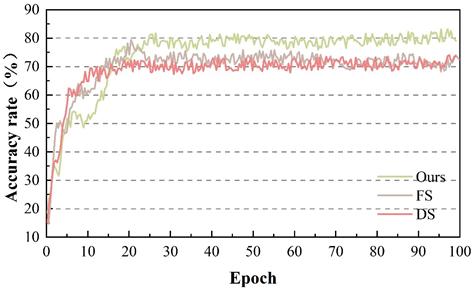
Passenger’s expression change is the intuitive reflection of passenger’s psychological response, therefore, the accuracy of passenger’s expression recognition has a crucial impact on the study of passenger’s psychological response in this paper. In order to verify the effectiveness of expression recognition in this paper, we choose to evaluate the performance under four datasets RAF-DB and FER-2013 in four natural environments, and compare the FS and DS network structures with this paper’s method, and the change of accuracy under different datasets is shown in Figure 4. The accuracy curves of FS, DS, and this paper’s method on the RAF-DB dataset show a clear separation effect. On the FER-2013 dataset, the accuracy of this paper’s method in the first 17 iteration rounds is lower than that of FS and DS, which is related to the noisy FER-2013 dataset, and then the recognition accuracy of this paper’s method rises rapidly and stabilizes at about 80%, which also indicates its stronger learning ability and robustness.
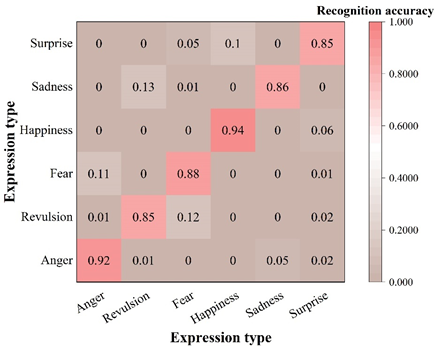
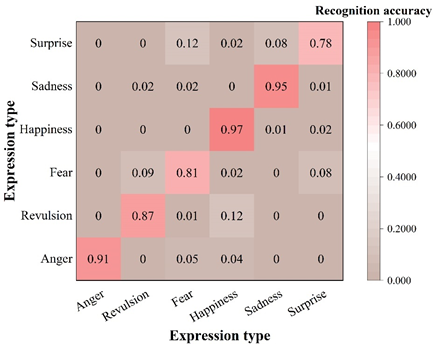
The types of expression recognition for subway passengers in this paper include six kinds of expressions such as anger, disgust, fear, happiness, sadness and surprise, and the recognition results of this paper’s recognition algorithm on two datasets are shown in Figure 5. It can be seen that the recognition algorithm of this paper on the RAF-DB dataset of the six types of expression recognition correct rate are more than 80%, the recognition effect is good.FER-2013 dataset is a set of grayscale images, the image quality is poor, which exists a certain degree of noise. It can be observed that the lowest correct recognition rate of surprise expression in the FER-2013 dataset is 78%, except for that all of them can also reach more than 80%. This may be due to the fact that the characters in the images of fear and surprise expressions in the FER-2013 dataset usually show an open mouth movement and the muscles in the eye part also contract, resulting in pupil dilation, which increases the possibility of misrecognition. However, it is worth noting that the recognition algorithm proposed in this chapter still achieves better recognition results despite the fact that the dataset is a grayscale image. This indicates that the algorithm in this paper is able to accurately capture effective facial expression features and is robust enough to achieve more advanced recognition performance with some noise and poor quality.
 (b) On FER-2013
In order to better and comprehensively carry out the research on the psychological response of subway car color lighting design to passengers, this paper carries out multidimensional data modeling based on data mining, so as to realize the quantitative evaluation of the psychological response of subway passengers to car color design. In a general multidimensional data model, the dimensional hierarchy is often clearly delineated and has a stable model structure. At this time, the multidimensionality of the data can be utilized in the analysis of things, from a variety of perspectives and levels to analyze the data model and explore the potential knowledge. However, in practical applications, the information used to describe objective things is often incomplete, the so-called boundaries of non-intersecting classes, sometimes it is difficult to say whether the categories are intersecting, and the boundaries of the division can only take a fuzzy way. This paper is oriented to the subway passenger psychological response, in the process of data mining, time is viewed as a factor inherent in the data itself, and full consideration is given to the use of multidimensional data factors to describe the objective psychological response of subway passengers.
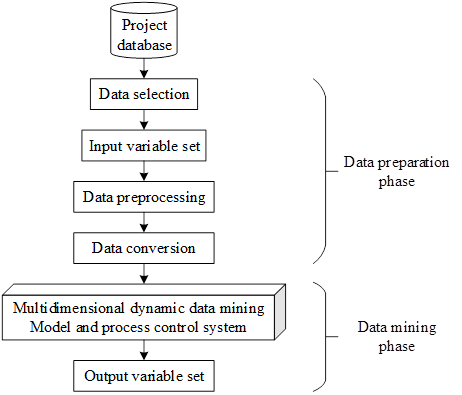
The multidimensional dynamic data mining system architecture model is shown in Figure 6, and the multidimensional dynamic data mining system model can be divided into the data preparation stage and the data mining stage. The former consists of data selection subsystem, data preprocessing subsystem, data conversion subsystem the latter consists of multidimensional dynamic data mining model, mining process control and variable set output subsystem. Mining system model firstly by analyzing the main parameters affecting the evolution of the system, and then use the selected main parameters to carry out a series of processing to construct a canonical dynamic system modal change characteristics of the mining dataset, generate a sample set and then train the mining model, and finally according to the obtained information mining model to achieve the modeling of incomplete information.
The specific realization process is as follows:
Analyze the main parameters affecting the system changes and construct the data set of dynamic system modal change features.
Perform data preprocessing on the data sample sets (including training samples and test samples) for all the main parameters, fill in the missing data through soft measurement techniques, and deal with abnormal data through data filtering techniques.
Construct a multi-dimensional dynamic information mining network model, and use optimization algorithms to determine the mining application model.
Use the constructed data mining model to predict the test samples and get the output prediction results.
Achieve incomplete information modeling from the mining model, and finally achieve satisfactory application results.
Visual perception is an important way to reflect the multiple attributes of objective things in the human brain. Metro passengers can produce different psychological reactions to the color lighting design of the car through visual perception. In this paper, we constructed a face expression recognition model for subway passengers based on computer vision, which is used as a measurement basis for measuring passengers’ psychological responses, and on this basis, we quantitatively evaluated subway passengers’ psychological responses through a multi-dimensional data model. In this section, the experiment takes five carriages with different color lighting designs in H city subway as an example, and counts the expression reactions of passengers in different time periods in the morning and evening, and analyzes them in combination with the passenger evaluation data quantified by the multi-dimensional data model. Among them, the passenger expression type selection of the largest number of the first three, passenger evaluation full score of 5 points, different color lighting and passenger psychological response changes as shown in Table 2, this paper studies the five carriages of color lighting mood is relatively rich, involving green (101, 45, 75), blue (233, 47, 70), red (1, 72, 94), purple (317, 21, 78) and yellow (57, 97, 89) five colors of illumination. It is observed that different time of day has almost no effect on the ranking of expression types of the passengers in the compartments, which means that the time of riding in the subway compartments does not have a significant effect on the psychological responses of the passengers. The ranking of passengers’ expression types under different colors of color illumination is obviously different, which is analyzed as follows:
Under the color illumination of green tendency in No. 1, the number of passengers with relaxed expression in the morning and evening rides was the highest, 230 and 180 respectively, followed by the type of happy expression, 60 and 100 respectively. Because, green color mostly reminds people of vibrant forests, vast grass, fresh vegetables, etc., and also has the implication of safety and youthfulness, the psychological responses of passengers in compartment No. 1 were relatively positive, and only a few of them presented sad emotions.
In color-illuminated compartments with blue tendency No. 2 and purple tendency No. 4, the most frequent types of passenger expressions were calm and sad, respectively. Blue mostly gives a feeling of depth, because of its similarity to the color of the ocean, tends to also give people a cold, melancholy and mysterious and unpredictable psychological implication. And purple also has the same mysterious and melancholy feeling, therefore, the No. 2 and No. 4 compartments are mostly calm and sad psychological response.
Under the color illumination of the red tendency of No. 3, the most expression types of passengers in the morning and evening rides were happy and excited, totaling 490 and 80 respectively. The color red is associated with blood, flames, flowers, sun, fruits and excitement, etc. In the eyes of the Chinese, red represents good luck and prosperity, so the majority of passengers’ expressions are happy and excited, and their psychological reactions are relatively positive. However, a small number of passengers show nervousness, analyzing the reason is that the red color also has the implication of danger, warning and violence, which is easy to make people have negative psychological reactions.
No. 5 compartment is yellow inclined color lighting design, passengers in the morning and evening ride happy and relaxed expression of the number of relatively more, happy expression of the passengers in the morning and evening time period were 225 and 240 people, respectively, and the relaxed expression type were 105 people and 83 people. Yellow color creates a feeling of brightness and warmth, it is most likely to remind people of warm sunshine, and easily gives people the psychological implication of joy and brightness, so the psychological reaction of passengers in car No. 5 is relatively positive.
In terms of passenger ratings, the ratings of compartment 3 (red) and compartment 4 (purple) are relatively low, with an average score of 3.5, while the ratings of the other compartments are all 4. The reason for the low ratings of compartment 3, despite its relatively positive psychological response, may be due to the fact that red gives a hint of danger, which leads to the drop in ratings. Car 4, on the other hand, scored poorly because the color purple had a relatively high negative psychological impact on passengers, with the number of sad expressions exceeding 100 in all cases.
| Color lighting | Carriage | Time | Passenger expression type | Score | |||||
| H | S | B | Color | 1 | 2 | 3 | |||
| 101 | 45 | 74 | Green | 1 | Morning | Ease (230) | Pleasure (60) | Sadness (30) | 4.0 |
| Evening | Ease (180) | Pleasure (100) | Sadness (50) | 4.0 | |||||
| 233 | 47 | 70 | Blue | 2 | Morning | Peace (200) | Sadness (50) | Neutrality (20) | 4.0 |
| Evening | Peace (180) | Sadness (80) | Neutrality (30) | 4.0 | |||||
| 1 | 72 | 94 | Red | 3 | Morning | Pleasure (250) | Excitation (30) | Strain (20) | 3.5 |
| Evening | Pleasure (240) | Excitation (50) | Strain (10) | 3.5 | |||||
| 317 | 21 | 78 | Purple | 4 | Morning | Peace (180) | Sadness (106) | Revulsion (12) | 3.5 |
| Evening | Peace (100) | Sadness (122) | Revulsion (11) | 3.5 | |||||
| 57 | 97 | 89 | Yellow | 5 | Morning | Pleasure (225) | Ease (105) | Excitation (32) | 4.0 |
| Evening | Pleasure (240) | Ease (83) | Excitation (26) | 4.0 | |||||
In this study, an expression recognition model for subway passengers was constructed based on computer vision, and a multi-dimensional data analysis model was established to study the psychological reactions of subway passengers using passengers’ expressions as the entry point and data mining techniques.
The target detection for subway passengers in this study is optimized using the pruning algorithm, and after optimization than the rest of the methods, it has an advantage in improving the inference speed, and also achieves relatively satisfactory results in terms of accuracy. The expression recognition model for subway passengers in this paper has a recognition accuracy of 85%\(\mathrm{\sim}\)94% on the RAF-DB dataset and 78%\(\mathrm{\sim}\)97% on the FER-2013 dataset, which has a high recognition accuracy and excellent model performance.
The ride time in the subway car does not have a significant effect on the psychological response of passengers. The scores of the carriages under red and purple color illumination are relatively low, and the average scores are both 3.5. The reason for the lower ratings for the red color lighting, although the psychological response is relatively positive, may be due to the fact that red gives a hint of danger, which leads to a decrease in the ratings. And for the purple color has relatively more negative psychological impact on passengers, the number of sad expressions are more than 100 people, so the score is not high.
Different color lighting designs in subway cars have different effects on passengers’ psychological responses. In the study, the green tendency of the color lighting under the relaxed and happy expression, in the blue tendency and purple tendency of the color lighting, the passengers are mostly calm or with the psychological response. While under the red tendency, the passengers’ psychological reaction is relatively positive, and the most types of expressions are happy and excited, totaling 490 and 80 respectively. The color lighting design with yellow tendency is more likely to produce happy and relaxed expressions. Taken together, green, red and yellow color lighting designs are mostly positive psychological responses, while blue and purple are relatively negative.