
Physical education, as an important part of education, has an indispensable role in students’ physical and mental health and comprehensive development. However, under the traditional mode of physical education, many students lack interest in physical education and take physical education class only as an examination class [7,24,25]. In order to change this phenomenon, innovative physical education practice organization and game design is gradually becoming a new trend. Physical education game teaching is the basic means of physical practice, to enhance physical fitness, entertainment, physical and mental, cultivate temperament for the purpose of [8,21,6], to the reasonable use of physical education games for teaching a teaching process, is carried out in accordance with certain purposes and rules of a kind of organized sports activities, but also a kind of conscious, creative and active activities. Its basic characteristics are mass, popularity and entertainment [34,20,35,26].
Gamification teaching plays an important role in stimulating students’ motivation to learn. In the traditional teaching process, students often face fixed learning goals and pressure, which makes it difficult to maintain learning motivation for a long time. In contrast, gamification teaching stimulates students’ desire for exploration and competitive psychology by setting diverse game tasks and reward mechanisms [19,17,27,18]. Students can get rewards or advancement by completing the tasks, and get a sense of achievement and reward, and this positive feedback can enhance students’ learning motivation and participation. In addition, gamified teaching can provide social interaction and cooperation among students, increasing the fun and motivation of learning [4,28,15,10].
Literature [13] examined the impact of using gamification in physical education classes. Through a literature review using systematic evaluation and meta-analysis, the findings indicated that the inclusion of gamification in physical education classes is beneficial in motivating students to actively participate in physical activities and physical education learning. Literature [1] divided students into two groups of game-based and traditional instruction to conduct an experiment, using a mixed method of quantitative and qualitative data for the research design, and the results of the experiment pointed out that students in the game-based group performed better and were more motivated to participate in physical activities. Literature [30] explored the effect of gamification on students’ motivation to participate in physical activities by measuring changes in students’ motivation through a questionnaire. Comparative experimental results indicated that gamification helps to increase students’ intrinsic motivation to participate in physical activities. Literature [12] conducted a group experiment with 54 students in order to understand the differences between gamification and traditional teaching modes, and the results of pre- and post-tests concluded that there were significant differences between the two groups, and that gamification motivated students’ motivation and willingness to participate in physical activities more than the traditional teaching methods. Literature [11] took 290 students as experimental subjects to verify the effectiveness of gamification in physical education. Data were collected through mixed methods and analyzed using SPSS statistical software, and the quantitative results showed that students’ motivation was well improved after experiencing gamification, showing themes such as enjoyment and learning. Literature [32] explored the impact of gamification on student motivation in physical education. Using questionnaires in order to understand the basic needs and motivational components of the students, comparative tests emphasized that the gamification intervention effectively increased the satisfaction of the students’ psychological needs and a qualitative leap in intrinsic motivation. Literature [29] investigated gamified learning based on its wide application in physical education. A comparative trial with students concluded that gamified learning enabled students to demonstrate a higher level of task orientation relative to traditional learning modes, which is conducive to promoting the quality of teaching and learning.
The literature [5] describes the scientific basis for the use of gamification in physical education at all educational levels, systematically evaluates it based on the recommendations of the PRISMA Declaration. And by organizing and analyzing a large number of resources, it was concluded that gamification positively affects the intrinsic motivation of students to learn. Literature [14] explored the impact of gamification on college students’ motivation and academic performance and conducted a survey experiment with 127 students, and the results mentioned that the implementation of gamification was effective in improving students’ motivation and conducive to improving academic performance. Literature [33], in order to increase students’ motivation in physical education, discussed the impact of gamification of physical education on students’ motivation such as psychological needs and positive behaviors, and carried out a comparative experiment based on 506 students, which indicated that the motivation, participation, and cooperative behaviors of the students in the context of gamification favorite students have increased. Literature [31] aimed to investigate the impact of gamification on students’ motivation in physical education classes and conducted a game practice using the ClassDojo application, and the results verified the effectiveness of gamification in increasing students’ motivation. Literature [9] evaluated multiple disciplinary databases using the Preferred Reporting Items methodology of systematic evaluation and meta-analysis and searched through inclusion and exclusion criteria to elucidate the use of gamification in physical education. The results of the study affirmed the importance of gamification and its positive impact on students’ motivation, academic performance, and improved physical fitness. Literature [23] examined the impact of gamification on the motivation of physical education students and conducted a comparative test with 150 students and differentially tested and evaluated their motivation and performance based on a questionnaire, which revealed that physical education gamification promotes students’ motivation and performance.
The purpose of this study was to investigate the relationship between gamification design in physical education and students’ motivation to learn physical education. A gamified physical education teaching model was designed, and two classes with no significant differences in physical education motivation levels and achievement in a college physical education class were selected for the gamified physical education teaching model experiment. Through the self-determined motivation model, combined with the questionnaire survey as well as the mathematical statistics method to analyze and study the students’ sports motivation before and after the teaching, and to further evaluate the teaching effect of this game-based sports classroom. Finally, using regression modeling, we analyze the role of game teaching mode and self-determination theory in students’ motivational stimulation.
The design of the gamification teaching objectives in this study consisted of two parts [22], the unit objectives of gamification teaching oriented to the core literacy of the physical education discipline, and the lesson objectives. Both parts were carried out in conjunction with the three-dimensional objectives of the core literacy of physical education discipline, including the objectives of motor ability, healthy behavior and physical character.
The design of teaching objectives follows the principles of wholeness, hierarchy and quantifiability, grasps the role of sports in the development of students’ core literacy, and, based on the requirements of the students’ curriculum content objectives, makes a holistic design of the objectives of physical education teaching in terms of basic knowledge and basic skills, technical and tactical use, physical fitness, competition rules, viewing and evaluation, health cognition and habits, and sports quality and spiritual character, articulating the objectives of the big The objectives of each class period of the unit are finally presented in a clear, concise and operable design, which serves as the basis for teaching evaluation and guides the cultivation of students’ core literacy in physical education.
The instructional content of this study incorporates the standards for content objectives and academic quality requirements for students in the sport program, level three, as the content of instruction. The class content arrangement of the sports program combines the developmental needs of the students’ level for the large unit teaching design. Following the principles of systematicity, progressivity and operability, the systematic learning and practicing contents are arranged in accordance with the law of students’ motor skill development, in which the teaching contents of physical fitness, health cognition and habit, sports quality and spiritual character are integrated.
Teaching evaluation design contains the evaluation design of curriculum teaching, section teaching, level teaching, module teaching, unit teaching, class teaching, etc. The evaluation includes: quantitative and qualitative evaluation, absolute and relative evaluation, diagnostic, formative and summative evaluation, etc.
In the study of this paper, the evaluation design focuses on: the evaluation of the effect of gamification teaching on the cultivation of students’ core literacy and interest in physical education learning. The evaluation process is divided into two parts, namely, the “pre-test” before teaching and the “post-test” after the end of the teaching practice, which verifies the effect of teaching implementation by comparing the results of the two tests.
The evaluation adopts the combination of quantitative evaluation and qualitative evaluation, and the combination of process evaluation and summative evaluation. Quantitative evaluation uses questionnaires to evaluate students’ cognitive level under the dimension of athletic ability, cognition of health behaviors, and to understand students’ physical integrity through the pre-test. Qualitative evaluation and process evaluation are conducted through the form of case study classroom observation, combined with the Physical Character Classroom Observation Scale to evaluate students’ physical character. Summative evaluation is the end-of-term assessment of specialized sports skills.
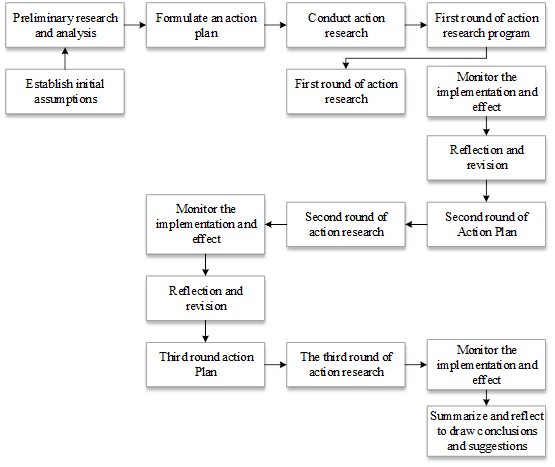
There are various action research operation modes, combined with the characteristics and reality of this study, the research mode designed in this paper is developed on the basis of the mode created by the former, through the refinement and modification of the former mode, combined with the realistic needs of this study, the action research mode of this paper is designed. The action research model constructed in this paper is shown in Figure 1.
Autonomous motivation includes identity regulation, integrative regulation, and internal motivation. Controlled motivation includes external and internal regulation. The way motivation is distributed is shown in Figure 2.
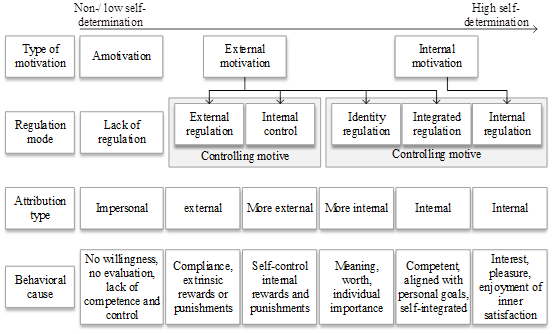
Unmotivated. Unmotivation occurs when all three basic psychological needs are not met. Unmotivated means that the student lacks any intention to take physical education classes and believes that taking physical education classes is pointless.
Externally regulated. It refers to the fact that students are controlled by external factors to participate in physical education class and to fulfill their own external needs.
Internal regulation. It refers to the fact that students’ participation in physical education classes is controlled by their inner sense of oppression, a motivation to avoid feeling guilty and uneasy, or a motivation to show in order to gain a sense of pride.
Identification regulation. Refers to students having mild self-involvement, understanding and identifying with the value of physical education classes, when students’ sense of control decreases and their sense of self-determination increases.
Integration regulation. This refers to the student fully identifying with the value of physical education and sport and integrating it into his or her lifestyle, becoming a part of the self, but this is not the same as internal motivation, where the student’s behavior is not motivated by fondness but is a means to achieve a goal.
Internal motivation. Internal motivation refers to the fact that the starting point of the student’s physical education class is focused on the activity itself, and that the student participates in the physical education class on his or her own initiative.
Self-determined motivation measurement scales mainly include: the Physical Education Behavioral Regulation Scale, the Self-Regulation Scale, the Perception of Causality Scale, the Physical Education Motivation Scale, and the Situational Motivation Scale.
In this paper, the Self-Regulation Scale was used to measure students’ motivation in physical education [16]. It was adapted from the Academic Self-Regulation Scale, which has a total of 20 items, with five items each to measure students’ internal motivation, identity regulation, intake regulation, and external regulation in physical education learning.
A class with no difference in motivation and level of physical education learning in a college physical education class was used as the study population. Two classes were selected from an option class of the university respectively. There were 50 students in each class and a total of 100 students as experimental subjects. They were divided into experimental (T) and control (CK) classes.
The selection is based on the motivation level and sports performance, before the experiment on the level of all classes of students in the level of motivation level test and sports level assessment, through the analysis of variance of the measured data, selected the test results do not have significant differences between the 2 classes as experimental subjects.
Questionnaire on Sports Motivation and Learning Effectiveness
The motivation evaluation method used in the experiment chose the motivation level questionnaire in the Handbook of Assessment of Psychological Scales Commonly Used in Sports Science, which was slightly modified to make a motivation level questionnaire with a total of 20 questions.
The questionnaire on learning effects in sports with 20 questions was designed in May 2023 on the basis of reviewing a large amount of literature. After the completion of the questionnaire, 10 relevant experts were asked to consider the design of the questionnaire, and finally a questionnaire with 15 questions on physical education learning effects was formed.
Validity and Reliability Test of the Questionnaire
The validity test of this questionnaire adopted the expert survey method. Before the experiment, experts in physical education theory and some physical education teachers in colleges and universities were consulted about the feasibility of the physical education learning questionnaire designed by the authors and some common and effective methods of motivational stimulation to be used in physical education teaching and related issues.
The reliability test of the physical education learning effect questionnaire was retested using the retest method, and the questionnaire of physical education learning effect was administered to the subject students once before and after the experiment. The mean and standard deviation of each entry and the total score before and after the two times were calculated respectively, and the corresponding correlation coefficients were calculated. The test results show that the correlation coefficients of each entry are between 0.811\(\mathrm{\sim}\)0.867, all of them are significantly positively correlated, and the average correlation coefficient is 0.859, which is a survey with quite high reliability.
Questionnaire distribution and recovery
The questionnaire on the motivation level of sports and the questionnaire on the learning effect of sports were distributed to the 2 classes selected in the preliminary stage before and after the experiment. The same way of distributing on the spot and collecting on the spot was adopted. A total of 100 questionnaires each were distributed. The recovery rate was 100% and the validity rate was 100%.
Experimental time
The experiment lasted 16 weeks, and the experimental group (T) used the gamified physical education teaching mode to conduct the teaching experiment, while the control group (CK) used the traditional teaching method to conduct the teaching.
Performance assessment method
This experiment adopts the method of examination and teaching separation. Five teachers of the school assessed the students, the content of the assessment is 50 meters running, pull-ups and other physical ability level test. The average of the scores of the five teachers is the performance of the students. Before and after the experiment, the same standard was used, and the same teachers assessed the experimental group and the control group.
The data collected from the questionnaires and experiments were summarized using Excel, and statistical software was used to process the summarized data. ANOVA was used to compare the situation of the subjects before the experiment. A paired t-test was used to compare the data before and after the experiment. One-way ANOVA was used to analyze the data for the comparison of the results after the experiment. Statistical methods such as chi-square test were used to analyze the data in the analysis of the learning effectiveness questionnaire of the experimental group and the control group.
In the Richter scale, the degree of measurement importance is reflected by the mean value. Generally, mean values between 1 and 2.4 indicate opposition, between 2.5 and 3.4 indicate neutrality, and between 3.5 and 5 indicate agreement. In this study, the whole scale was organized in such a way, where 1-5, respectively, indicated “very inconsistent”, “inconsistent”, “average”, “Conformity” and “Very Conformity”, totaling five levels of classification.
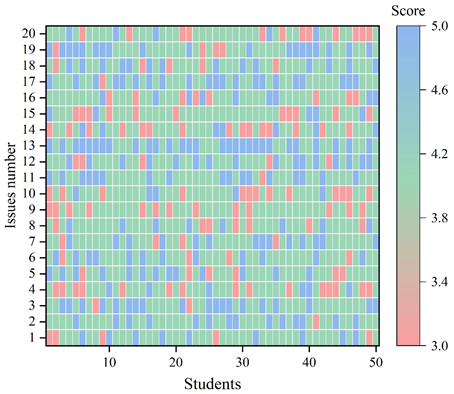
The subjects of this study were 50 students in the experimental class described above. The factors in the self-regulation scale were statistically analyzed, and the results of the mean values of each motivational dimension in students’ physical education learning are shown in Figure 3.
As can be seen in Figure 3, most of the students rated each of the variables in internal motivation, identity regulation, intake regulation, and external regulation at 3 or more, and the mean ratings of their variables were 4.132, 3.992, 4.172, and 4.156 in that order, all of them were above 3.5, which indicates that the selected variables are in a very important role in the measurement of self-motivation in students’ physical education learning. The overall mean was 4.113, which indicates that the students’ overall agreement with the internalizing moderator and identity moderator is high.
The Sports Motivation Scale designed in this paper contains 20 questions, which are divided into the following three dimensions: no motivation, external motivation, and internal motivation. The internal motivation dimension contains the following factors: curiosity, completion, and perceptual experience. The external motivation dimension contains the following factors: external regulation, introjection, and homogenization.
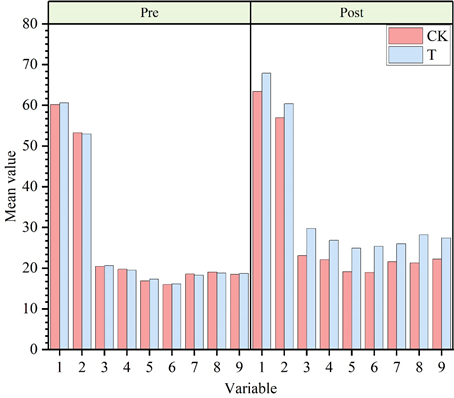
Variables 1-9 are, in order: internal motivation, external motivation, knowledge seeking, completion, perceptual experience, homogenization, internal homogenization, external regulation, and no motivation. The results of students’ sports motivation level in the two classes before and after the experiment are shown in Figure 4. Table 1 shows the results of mathematical statistics of students’ motivation level in the two classes before and after the experiment.
As can be seen from the figure, there is not much difference in the level of sports motivation between the two classes only before the experiment, and the results show that the p-value between the level of sports motivation of the students in the two classes is greater than 0.05, and there is no significant difference. After four months of intervention in the gamification sports teaching experiment, the mean values of the dimensions of the sports motivation level of the students in the experimental class increased by 7.311, 7.402, 9.173, 7.352, 7.622, 9.249, 7.728, 9.432, and 8.764 compared with that before the experiment, and the motivation level of the students in the control class after the experiment has produced a more significant significant difference (P \(\mathrm{<}\) 0.05). It can be seen that the implementation of gamification teaching methods in the physical education classroom can improve the students’ motivation in physical education to a certain extent.
| Variable | Pre-test | Post-test | ||||
| Mean(Ck) | Mean(T) | P | Mean(Ck) | Mean(T) | P | |
| Internal motivation | 60.19 | 60.57 | 0.335 | 63.363 | 67.881 | 0.004 |
| External motivation | 53.26 | 52.93 | 0.282 | 56.923 | 60.332 | 0.013 |
| Knowledge | 20.44 | 20.61 | 0.204 | 23.057 | 29.783 | 0.009 |
| Completion | 19.73 | 19.49 | 0.389 | 22.07 | 26.842 | 0.024 |
| Perceptual experience | 16.85 | 17.32 | 0.365 | 19.135 | 24.942 | 0.007 |
| Homogenization | 15.97 | 16.13 | 0.35 | 18.926 | 25.379 | 0.003 |
| Inner throw | 18.52 | 18.24 | 0.33 | 21.591 | 25.968 | 0.008 |
| External regulation | 19.02 | 18.75 | 0.382 | 21.302 | 28.182 | 0.009 |
| Inmotivation | 18.49 | 18.66 | 0.25 | 22.198 | 27.424 | 0.005 |
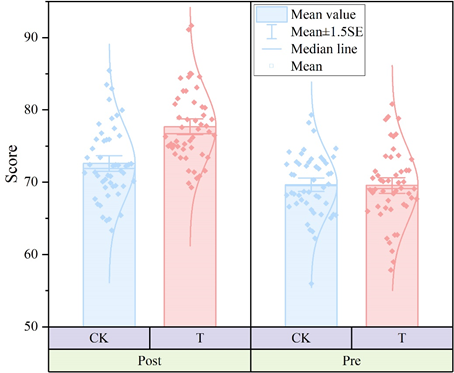
In order to prove that sports gamification teaching can affect students’ sports learning effect. In this section, before and after the experiment, students in the experimental group and the control group were given a questionnaire survey on the learning effect of physical education, and the learning effect of the two classes was statistically analyzed by combining mathematical and statistical methods.
Table 2 shows the statistical results of physical education performance of the two classes before and after the experiment. Figure 5 shows the results of the distribution of students’ physical education learning effect scores in the two classes before and after the experiment. As can be seen through Table 2, the results of the two classes’ pre-test physical education achievement results are analyzed P = 0.463 \(\mathrm{>}\) 0.05, with no significant difference. While the results measured after the end of the 4-month teaching experiment, the two classes P = 0.002 \(\mathrm{<}\) 0.05, indicating that there is a difference between the results of the two classes. From Figure 5, the grades of the two classes after the experiment conformed to the normal distribution, the average grade of the students in CK class was 72.59, while the grade of T class was at 77.67, and it had more students with high scores (more than 80) than CK class, which was one of the reasons for the average grades of the two classes pulling apart.
| Class | Mean value | P | |
| Pre-test | CK | 69.66 | 0.463 |
| T | 69.56 | ||
| Post-test | CK | 72.59 | 0.002 |
| T | 77.67 |
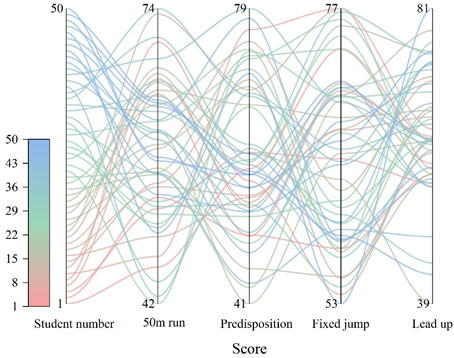
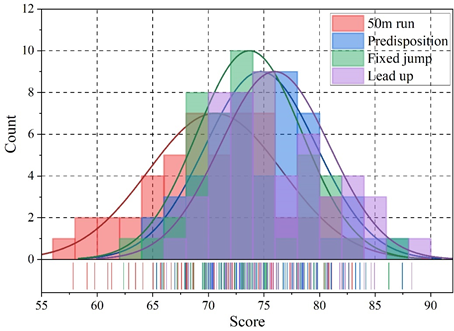
Physical fitness tests are commonly used to evaluate students’ physical education level abilities. In order to explore the effect of gamified physical education teaching mode on students’ physical education level, this section evaluates the effect of gamified teaching in the classroom by testing a number of physical fitness items in the experimental class before and after the experiment. The physical fitness items selected in this paper are 50-meter run, body flexion, standing long jump, and pull-up.
Figures 6 and 7 show the results of the physical education level test based on multiple physical fitness items in the experimental class before and after the experiment, respectively. As can be seen from Figure 6, before the experiment, the physical fitness level of the experimental class was low, in which the average scores of 50-meter run and forward bending were 58.23 and 59.76, respectively, which did not reach the passing level (60 points), and the average scores of standing long jump and pull-up were only on the edge of the passing level. With the intervention of gamification teaching mode, Figure 7 shows that the students’ physical education level increased dramatically, and the average scores of 50-meter run, forward bending, standing long jump, and pull-up were 70.61, 74.72, 73.70, and 75.97, respectively, which were significantly improved compared with those before the experiment. It indicates that the gamified physical education modification improved the passing rate of the class and improved the students’ physical education level from the physical fitness level.
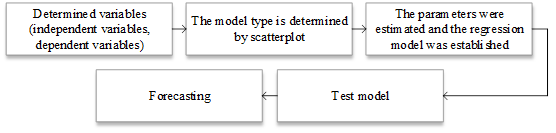
Linear regression is a supervised learning algorithm and the steps of linear regression are shown in Figure 8 below [2,3].
In this case, the general form of the multiple linear regression method can be expressed as: \[\label{GrindEQ__1_} y=\beta _{0} +\beta _{1} x_{1} +\beta _{2} x_{2} +\cdots +\beta _{k} x_{k} +\varepsilon . \tag{1}\]
When we have data with multiple eigenvalues, set to \(x_{1} ,x_{2}\), etc., and a target value set to \(h\), based on the existing eigenvalues and target values can assume the equation is \(h=\alpha _{0} +\alpha _{1} x_{1} +\alpha _{2} x_{2}\), and then assume that the value of definition \(x_{0}\) is equal to 1, then the mathematical equation above can be expressed as follows: \(h=\sum\limits_{i}= 0^{n} \alpha _{i} x_{i} =\alpha ^{T} X\). In practice, the linear relationship does not necessarily exist between the variables, Shadow Spike this time need to be resolved through the fitting, that is, in order to find a set of optimal parameters \(\alpha _{0} ,\alpha _{1}\) and \(\alpha _{2}\) so that the final predicted value obtained is closest to the true value.
There is generally some error between the true value and the predicted value, which is denoted by \({\rm }\). Thus the true value, \(y=\sum\limits_{i}= 0^{n} \alpha _{i} x_{i} =\alpha ^{T} X+{\rm }\), has for each sample: \(y^{(i)} =\alpha ^{T} x^{(i)} +{\rm }^{(i)}\), and the error, \({\rm }^{(i)}\), is independent and obeys a Gaussian distribution with a variance of \(\sigma ^{2}\) and a mean of zero.
The normal, or Gaussian, distribution is characterized by a curve that is lower at the ends, higher in the middle, and symmetrical at the left and right ends. If random variable \(X\) obeys a normal distribution with variance \(\sigma ^{2}\) and mathematical expectation \(\mu\), then the magnitude of its distribution is determined by the standard deviation \(\sigma\), and its location is determined by the expected value \(\mu\) of the probability density function of the normal distribution. When \(\mu\)=0, \(\sigma\)=1, quasi-normal distribution. The probability density function of the Gaussian distribution is: \[\label{GrindEQ__2_} p(y)=\frac{1}{\sigma \sqrt{2\pi } } e^{-\frac{(y-\mu )^{2} }{2\sigma ^{2} } } . \tag{2}\]
Since the error follows a Gaussian distribution, the error is taken into a normal distribution function, where \(\mu =0\) can be obtained: \[\label{GrindEQ__3_} p(y^{(i)} |x^{(i)} ;\alpha )=\frac{1}{\sigma \sqrt{2\pi } } e^{-\frac{(y^{(i)} -\alpha ^{T} x^{(i)} )^{2} }{2\sigma ^{2} } } . \tag{3}\]
In statistics, a function concerning the parameters of a statistical model is called a likelihood function, and is mainly used to describe the likelihood in the parameters of the model. When the results obtained from some observations are known, the general likelihood is usually used to estimate the parameters of the characteristics of the thing with which they are associated. If the output is \(x\), the probability that the likelihood function \(L(\theta |x)\) is equal to variable \(X\) given parameter \(\theta\) is: \[\label{GrindEQ__4_} L(\theta |x)=p(X=x|\theta ) . \tag{4}\]
The most important use of the likelihood function is to compare its relative values, when a set of sample data output is fixed, this set of sample data of an unknown parameter usually tends to be equal to a particular value, when the likelihood function is maximized.
Maximum Likelihood Estimation
Maximum likelihood estimation means maximizing this function over all values of \(\theta\). And the optimal parameter for the solution required in this paper is the \(\alpha\) that needs to satisfy the maximum likelihood estimation, so it is necessary to bring Equation (3) to get: \[\label{GrindEQ__5_} L(\alpha )=\prod _{i=1}^{m}p (y^{(i)} |x^{(i)} ;\alpha )=\prod _{i=1}^{m}\frac{1}{\sigma \sqrt{2\pi } } e^{-\frac{(y^{(i)} -\alpha ^{T} x^{(i)} )^{2} }{2\sigma ^{2} } } . \tag{5}\]
Log Likelihood
The log-likelihood function is often used in maximum likelihood estimation and related fields with the following formula:
\[\begin{aligned} \label{GrindEQ__6_} \log L(\alpha) = &\log \prod_{i=1}^{m} p\left( y^{(i)} \mid x^{(i)}; \alpha \right)\notag\\ =& \log \prod_{i=1}^{m} \frac{1}{\sigma \sqrt{2\pi}} e^{-\frac{\left( y^{(i)} – \alpha^{T}x^{(i)} \right)^2}{2\sigma^2}}\notag\\ =& \sum_{i=1}^{m} \log \frac{1}{\sigma \sqrt{2\pi}}e^{ – \frac{\left( y^{(i)} – \alpha^{T}x^{(i)} \right)^2}{2\sigma^2}}\notag\\ =& m \log \frac{1}{\sigma \sqrt{2\pi}} – \frac{1}{\sigma^2} \times \frac{1}{2} \sum_{i=1}^{m} \left( y^{(i)} – \alpha^{T}x^{(i)} \right)^2. \end{aligned} \tag{6}\]
In order to maximize the log-likelihood function, \(m\log \frac{1}{\sigma \sqrt{2\pi } }\) is a constant, and then it is necessary to make the values subtracted after it smaller to obtain the objective function: \[\label{GrindEQ__7_} \begin{array}{rcl} {J(\alpha )} & {=} & {\frac{1}{2} \sum\limits_{i=1}^{m}( y^{(i)} -\alpha ^{T} x^{(i)} )^{2} } \\ {} \\ {} & {} & {} \end{array} . \tag{7}\]
Solve for the partial derivative of \(\alpha\): \[\begin{aligned} \label{GrindEQ__8_} {\nabla {}_{\alpha } J(\alpha )} & {=} {\nabla _{\alpha } \left(\frac{1}{2} (X\alpha -y)^{T} (X\alpha -y)\right)} \notag\\ {} & {=} {\nabla _{\alpha } \left(\frac{1}{2} (\alpha ^{T} X^{T} -y^{T} )(X\alpha -y)\right)} \notag\\ {} & {=}{\nabla _{\alpha } \left(\frac{1}{2} (\alpha ^{T} X^{T} X\alpha -\alpha ^{T} X^{T} y-y^{T} X\alpha -y+y^{T} y)\right)}, \end{aligned} \tag{8}\] \[\label{GrindEQ__9_} \frac{1}{2} (2X^{T} X\alpha -X^{T} y-(y^{T} X)^{T} =X^{T} X\alpha -X^{T} y) . \tag{9}\]
Making the partial derivative equal to 0 gives: \[\label{GrindEQ__10_} \alpha =(X^{T} X)^{-1} X^{T} {\rm (}{\rm Least\; square}{\rm )} . \tag{10}\]
If the variable is \((x,y)\), then the data can be obtained as \(((x_{1} ,y_{1} )……(x_{m} ,y_{m} )\); mapping these data in a right-angled coordinate system, the corresponding points can be obtained to be distributed around a straight line, and let the equation of this line be: \[\label{GrindEQ__11_} y_{i} =a_{0} +a_{1} x, \tag{11}\] \(a_{0}\) and \(a_{1}\) are arbitrary real numbers.
To determine the values of \(a_{0}\) and \(a_{1}\), find the sum of the squares of the differences between the actual \(y_{i}\) and the calculated \(y_{j} (y_{i} =a_{0} +a_{1} x)\): \[\label{GrindEQ__12_} \varphi =\sum\limits_{i=1}^{n}(y_{i} -y_{j} )^{2} . \tag{12}\]
Bringing Eq. (11) into Eq. (12) gives: \[\label{GrindEQ__13_} \varphi =\sum\limits_{i=1}^{n}(y_{i} -a_{0} -a_{1} x_{i} )^{2} . \tag{13}\]
In order to minimize the value of \(\varphi\), let the function \(\varphi\) take a partial derivative with respect to \(a_{0}\) and \(a_{1}\) so that its partial derivative is equal to zero, and solve for its minimum value to obtain the system of equations: \[\label{GrindEQ__14_} \left\{\begin{array}{l} {\sum\limits_{i=1}^{n}2 (a_{0} +a_{1} x_{i} -y_{i} )=0} \\ {\sum\limits_{i=1}^{n}2 x_{i} (a_{0} +a_{1} x_{i} -y_{i} )=0} \end{array}\right. \tag{14}\]
Solving the system of equations gives: \[\label{GrindEQ__15_} a_{0} =\frac{1}{n} \sum\limits_{i=1}^{n}(y_{i} -a_{1} x_{i} ) , \tag{15}\] \[\label{GrindEQ__16_} a_{1} =\frac{n\sum\limits_{i=1}^{n}x_{i} y_{i} -\sum\limits_{i=1}^{n}x_{i} \sum\limits_{i=1}^{n}y_{i} }{n\sum\limits_{i=1}^{n}x_{i} {}^{2} \sum\limits_{i=1}^{n}x_{i} \sum\limits_{i=1}^{n}x_{i} } . \tag{16}\]
Finally, the solved result is brought into Eq. (11) to obtain the desired linear equation.
The paper concludes with a multiple regression model to analyze the changes in students’ motivation in sport under the gamification teaching mode. Multiple regression equations were constructed with students’ gender, age, physical condition, sports interest, school environment, and teachers’ qualifications as control variables, gamification teaching mode as explanatory variables, external regulation, intake regulation, and identity regulation in self-determined motivation theory as mediator variables, and students’ sports stimulation as explanatory variables. The results of the regression analysis of the influence of students’ sports motivation are shown in Table 3.
| Variable | Explained variable(student sports motivation) | |||
| Model 1 | Model 2 | Model 3 | ||
| Control variable | Gender | 0.012 | 0.007 | 0.002 |
| Age | 0.016 | 0.020 | 0.005 | |
| Physical condition | 0.029 | 0.025 | 0.035 | |
| Interest | 0.136*** | 0.127*** | 0.144*** | |
| Environment | 0.043 | 0.037 | 0.041 | |
| Teacher qualification | 0.016 | 0.018 | 0.013 | |
| Interpretation variable | Game teaching | 0.375*** | 0.413*** | |
| Mediation variable | External regulation | 0.261*** | ||
| Intake regulation | 0.154*** | |||
| Identity regulation | 0.212*** | |||
| R\({}^{2}\) | 0.152 | 0.198 | 0.143 | |
| F | 14.915 | 19.842 | 15.717 | |
| *, **, *** p less than 0.05, 0.01, 0.001, respectively | ||||
As can be seen from the table, Model 1 analyzes the effects of control variables on students’ sports motivation. Among the control variables, one and only students’ interest in sports can stimulate students’ sports motivation, and a one-unit increase in interest increases students’ sports motivation by 0.136. In addition, Model 2 is the effect of adding gamification teaching on students’ sports motivation. As shown by the data in Model 2, the correlation between the explanatory variables and the explained variables is 0.375 and shows highly significant at the 0.001 level. Finally, Model 3 shows that using self-determination theory as a mediating variable also has a highly significant positive effect on students’ sport motivation, when external regulation, intake regulation, and identity regulation are adjusted upward by one unit, the motivation to learn sport will be elevated by 0.261, 0.154, and 0.212 at the corresponding level. And the R-square’s level of explanation for Models 1-3 is 15.2%, 19.8%, and 14.3%, respectively.
This paper designed a gamification-based physical education teaching model, combined with a self-regulation scale to measure students’ learning motivation in the gamification-based physical education teaching model. The teaching experiment method was used to compare and analyze the students’ physical education learning motivation and teaching effect before and after the experiment. Then regression analysis was used to assess the role of various factors such as gamified teaching in students’ motivational stimulation.
At the end of teaching, internal motivation, external motivation, knowledge seeking, completion, perceptual experience, homogenization, internal homogenization, external regulation, and no motivation in the experimental class increased by 7.311, 7.402, 9.173, 7.352, 7.622, 9.249, 7.728, 9.432, and 8.764 compared to the pre-testing period, respectively.
Gamification sports teaching improves the sports performance of the experimental class, and the average score at the end of the teaching is 77.67, and the p-value between it and the control class is 0.02, which shows a significant difference. And it reflects the superiority of the teaching mode from the improvement of students’ sports level.
At the end of the teaching, the overall mean score of the experimental class in internal motivation, identity regulation, endoregulation and external regulation was 4.113, which improved the students’ motivation to learn sports.
The results of the regression analysis showed that for every unit of improvement in physical education gamification instruction, students’ motivation for physical education learning increased by 0.375 at the 0.001 level.
This work was supported by Teaching Reform Research Project of Hubei University of Automotive Technology (Project Number: JY2024066).