
Cross-border e-commerce has become an important part of the global e-commerce industry, and with the development of globalisation, more and more people start to try to shop overseas, which also promotes the development of cross-border e-commerce. In the past, most of the cross-border e-commerce needs to shop and deliver through overseas purchasing or international logistics enterprises, but now more and more e-commerce enterprises begin to provide overseas goods sales service directly for domestic consumers [18,16,17,10]. With the continuous development of cross-border e-commerce industry, the effective collection, analysis and optimisation of agricultural marketing data on cross-border e-commerce platforms in order to improve sales and profitability has become a problem that relevant enterprises have to face [27,5].
Agricultural products are an important resource in China, and the cross-border e-commerce platform brings a broader sales market for them. Cross-border sales can push agricultural products to the global market and further satisfy the export demand of domestic agricultural products. Through the globalised network, agricultural e-commerce platforms can deliver China’s high-quality agricultural products to various places [3,15,9,26]. Agricultural products e-commerce platform not only provides sales channels, but also provides an important platform for the construction of agricultural products brand. With their own e-commerce platforms, agricultural producers can directly promote and advertise their brands, and increase consumers’ awareness and loyalty to their products [2,24,1,20]. By building their own brand, agricultural product producers can occupy an advantageous position in the fierce market competition, so the marketing data analysis of agricultural products on cross-border e-commerce platforms is of great significance [12,25,4].
Liu,W. pointed out that the current is an important period for the transformation of Chinese agriculture to modern agriculture. The cross-border e-commerce marketing strategy of agricultural products in the context of environmental protection is explored on the basis of theory, aiming to provide reference for the realisation of cross-border e-commerce for Chinese agricultural products [6]. Lyu, R. launched a study on the optimisation of e-commerce systems, in order to analyse and optimise the current cross-border e-commerce product marketing strategy combined with modern big data statistics, to achieve the product marketing strategy of the new instead of the old, and improve the competitiveness of cross-border e-commerce [7]. Song,Z. examined the development status and existing advantages of cross-border e-commerce of agricultural products in China, and discussed the current export mode and future development trend of agricultural products, which aims to promote the development of cross-border e-commerce of agricultural products [13]. Wang et al. proposed ways in which supply chain sustainability can be achieved, including improving the policy framework for cross-border and agricultural e-commerce and strengthening the logistics infrastructure, etc., and their research results have enriched the theories in the corresponding fields, as well as having a certain value for the development of the economy, society and the environment [19]. Yue,H. revealed the challenges and solutions of agricultural products in cross-border e-commerce, pointing out that there are problems such as information asymmetry, mistrust, and lack of supervision, etc., and proposed an optimisation model for cross-border e-commerce of agricultural products based on blockchain technology based on its characteristics, which proved the effectiveness of the model and effectively solved the problems of cross-border e-commerce of agricultural products by means of case studies and empirical research [23]. Song et al. introduced the development of cross-border agricultural products platforms in China in recent years, indicating that the development of cross-border e-commerce of agricultural products has changed the problems such as the slow development of traditional agricultural products trade, and accelerated the transformation and upgrading of China’s agricultural products trade. In addition, the current situation and existing problems of the development of cross-border e-commerce of agricultural products in China are analysed and suggestions are made [11].
In cross-border e-commerce marketing data, a large amount of user behaviour data has great analytical value. The source, login registration, order and browsing behaviour of platform visitors are modelled to lay the foundation for further behavioural data flow analysis. A user behaviour data flow analysis system is designed. On top of the HDFS distributed file system, a HBase distributed storage database system is constructed, and a secondary index table is constructed on the basis of the RowKey index to improve the query efficiency. Embedded JS buried code through the website to achieve the acquisition of user behaviour data. Designed a set of horizontally scalable Flume-ng cluster to achieve flexible configuration of Flume-ng. Use Storm’s streaming computing framework to analyse and calculate data streams in real time. The accuracy and effectiveness of the system is evaluated by designing experiments, and its marketing effect enhancement is examined in practical applications.
Marketing data analysis through the acquisition and analysis of a large amount of marketing data, can help enterprises accurately understand the user information, positioning the enterprise’s target customer groups and targeted marketing efforts, while reducing marketing costs, improve marketing effectiveness. Generally speaking, the full analysis of marketing data has the following four advantages:
Reduce marketing costs and improve marketing efficiency. Due to the full analysis of marketing data, the platform can accurately identify the target customer groups with the same preferences, and enterprises can therefore carry out targeted promotional work to avoid the waste of resources caused by ineffective publicity, and thus achieve the purpose of reducing marketing costs and improving marketing efficiency.
Enhance the trust of the customer platform and establish uninterrupted contact between the enterprise and customers. The analysis and use of marketing data not only enables enterprises and consumers to maintain frequent two-way communication, but also strengthens the emotional ties between the two, weakening the interference of external competition. At the same time, based on the comprehensive analysis of customer needs and consumer behaviour characteristics of the database information, enterprises can further carry out personalized marketing for users with different preferences and characteristics, thus improving the match between users and products and page push, and enhancing the user experience.
Marketing effect can be evaluated and measured. In the daily operation of enterprises, marketing effectiveness is usually assessed by user feedback. However, it is usually difficult to collect and directly measure user feedback information in traditional marketing mode. However, by collecting feedback information such as platform users’ comments, repurchase, sharing behaviour, etc., the marketing effect can be quantified from the data level.
Explore new markets and grasp new opportunities. Good marketing requires an uninterrupted relationship and frequent interactions between marketers and users. Therefore, enterprise marketers can make full use of the transaction data of existing users, establish an effective user response mechanism by continuously tracking and observing the purchasing needs and preferences of specific customers, and timely capture changes in user demand based on user response to provide them with new products and services, so as to achieve the purpose of exploring new markets and seizing the first opportunity in the market.
At present, cross-border e-commerce enterprises often over-promote the front-end work of advertising and promotion and ignore the fine grasp of the whole process of marketing, the target audience of advertising is not clear, the targeted treatment of the target consumer groups is not high, and no attention is paid to the process of providing value-added additional services to customers.
Using the advantages of marketing big data, which is large in volume and contains more characteristics of customers’ purchasing information, marketing data analysis can distinguish different customer groups by analysing consumers’ own personalities and characteristics, purchasing psychology and behavioural habits, etc., and convey the sales and promotion information of products and services in accordance with the strategy of precision marketing for different types of customers to improve customer satisfaction.
Compared with the traditional cross-border e-commerce marketing mode, the marketing data analysis strategy has the advantages of high return rate, low cost, low risk, etc., which can support the precise dissemination of network channel advertising, market positioning, personalised provision of products and services, etc.
At present, there are four major misalignment problems in the marketing of cross-border e-commerce agricultural products, one is that the degree of reliance on traditional marketing is still high, the second is that it only focuses on the transaction, traffic and sales of products but ignores the nature of business itself to meet the demands, the third is that the e-commerce scale of agricultural products is underdeveloped, thus leading to poor economies of scale, and the fourth is that the positioning of agricultural products to meet the needs of consumers is close to the development of the supply chain, thus The fourth is that the positioning of agricultural products to meet consumer demand is closely related to the development of the supply chain, which leads to misalignment of positioning. For example, fresh produce cities have a single channel structure, low efficiency, insufficient value-added functions and management to be improved, while tea products have many brands but little influence, and the marketing method relies only on tea culture without caring about the characteristics of its own products. Therefore, scientific data analysis of the marketing data of agricultural products and getting rid of the traditional inefficient marketing analysis methods in order to formulate more accurate and personalised marketing strategies depend on the introduction of more advanced data analysis methods in the field of agricultural products.
In business activities, because of the need to target different customers, so access to information through different channels. In the era of big data, very often it is not the user who explores the data, but the data that “pounces” on the user. Among them, business marketing data usually refers to the business-related data stored in the enterprise’s own ERP system, payment system, POS terminals and other equipment. For example, user orders, purchases, payment records, etc. for the enterprise is the existence of commercial marketing data.
This type of marketing data usually refers to two levels of data, one is the real-name data that users keep online, such as registration information, purchase records, after-sale records, etc., which are structured data. The second is the user’s anonymous access data, such as the user’s behavioural data of visiting, viewing, clicking, comparing, bookmarking, adding to cart and so on on the website before purchasing, which are unstructured data and stored in the form of enterprise logs.
Analysing unstructured data can yield a lot of useful information, which can be used to speculate on users’ consumption trends, focus of interest, etc. When analysing these data, it is common practice to store the data first and then analyse it. The storage analysis method allows you to see all the data, directly compare the characteristics of the data, and is easy to analyse for scientific results, making it a highly accurate analysis method. However, when the amount of data is getting bigger and bigger, the storage space and calculation volume required by the storage analysis method are also getting bigger and bigger, which is gradually difficult to meet, and the analysis cycle is long, and the analysis results are difficult to be used in time. When the cost-effectiveness of traditional storage analysis methods is not satisfactory, real-time analysis and processing of data becomes a new research focus.
Streaming analysis method is precisely to deal with massive unstructured data and produced, it is a kind of computational analysis model, this model of each analysis node can be distributed in different physical machines, the overall processing logic in the form of streams in the form of flow between the computational units formed. Each node works synchronously and can start data analysis while getting the data, store only the data analysis results and produce results in real time.
Users’ clicks, collections and other behavioural data in cross-border e-commerce websites are an important component of marketing data, and by modelling the behavioural data and combining these analytical modelling results with network operations and network marketing strategies, it can play a guiding role in the existing operations and marketing strategies, and help to further amend the operations and marketing strategies. To this end, this paper designs a real-time user behaviour analysis system using flow analysis technology.
The core of the user behaviour analysis system is to establish and maintain a user behaviour model, and run analysis algorithms on top of this user model. The real-time user behaviour analysis system proposed in this paper does not require prior preparation of data, and can continuously analyse real-time data through real-time data streams, and use the results of this real-time calculation as the preparation data for later real-time data stream calculations.
The user behaviour functional model analysed in this paper describes the log traces left by website visitors in the process of visiting the website, then generates the user description file, and on top of that, it requires constructing the corresponding user behaviour model in accordance with different business classifications, which contains the user source model, the user login and registration model, the user order model, and the user browsing behaviour model in terms of functional types.
The user source model models the source of website visitors, and through the user source model, it can analyse from which advertisement source the users are introduced to the website. The user origin model relies on the user’s advertisement placement tags (UTM) or search engine of each channel provider and the page that the user enters the website by clicking on the advertisement or search engine, i.e., the landing page.
The UTM consists of a combination of five dimensions: source, medium, term, content, and campaign, so the UTM can be defined as a five-dimensional vector: \[\label{GrindEQ__1_} \text{UTM}=\left(\text{source, medium, term, content, campaign}\right) . \tag{1}\]
The landing page is a combination of three dimensions: page, refer, and time, so the landing page is defined as: \[\label{GrindEQ__2_} \text{LP}=\left(\text{page, refer, time}\right) . \tag{2}\]
The user origin model can be defined as \(User\left(UTM,LP,cookie\right)\), with a cookie as a unique tag implanted in the user’s browser.
The user login registration model models the registration behaviour and login behaviour of a website visitor, and contains the visitor’s identity ID, mobile phone, time and the source of login registration in the website business. The login registration conversion rate for any UTM source can be calculated by the following formula: \[\label{GrindEQ__3_} \text{ratio}\left(\text{UTM}_{j} \right)=\sum _{i=0}^{n} \text{User Login}{\left(\text{UTM}_{j} \right)\mathord{\left/ {\vphantom {\left(\text{UTM}_{j} \right) \sum _{i=0}^{n}\text{User Login}_{i} }} \right. } \sum _{i=0}^{n}\text{User Login}_{i} } . \tag{3}\]
The user order model models the purchasing behaviour and payment behaviour of website visitors and contains the order content, ordering preferences, ordering product brand, order type, user id, user mobile phone, and the user order model after correlating with the user source model ends up as: \[\label{GrindEQ__4_} \begin{array}{rcl} { \text{User Order}} & {=} & {\left\{ \text{UTM}\left( \text{source, medium, term, content, campaign}\right)\right. } \\ {} & {} & { \text{Order}\left( \text{time, type, userid, promotion id, brand id, name, phone}\right)} {\left. \text{cookie}\right\}}, \end{array} \tag{4}\]
\[\label{GrindEQ__5_} \text{sim}\left(a,b\right)=\cos \left(ab\right)=\frac{\sum _{i=0} \text{User Order}_{a,i} * \text{User Order}_{b,i} }{\sqrt{\sum \text{Order}_{a,i} *} \sqrt{\sum \text{Order}_{b,i} } } . \tag{5}\]
User Browsing Behaviour Model models the page browsing records and background operation records of website visitors, including the user’s source information, the user’s geographical information, the user’s access page, the bounce page, access time and other data, the browsing behaviour model is able to analyse the browsing link of the other visitor and analyse the overall browsing trajectory, browsing time and other behaviours of the visitor. The user browsing model can be defined as Trace (time, title, page, charset, refer, IP (country, location, net), and the final user browsing behaviour model after correlation with the user source model is: \(\text{User Trace}\left( \text{UTM, Trace, cookie}\right)\).
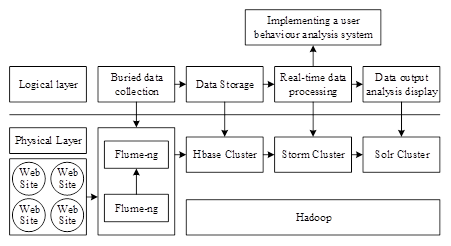
The user behaviour analysis system in this paper performs real-time data analysis for operations such as browsing, registering, logging in, and placing orders on Web sites, and customizes and develops the corresponding business models, so as to generate specific big data analysis in specific business scenarios. The real-time analysis system architecture design is shown in Figure 1.
In this paper, a HBase distributed storage database system is constructed based on the HDFS distributed file system. Its ability to scale dynamically with horizontal scaling can be used to freely add resources to the cluster [14]. Lzo’s compression method is used instead of the traditional Bzip.gzip compression algorithm to improve the compression speed and retrieval efficiency while saving hard disc space [8].
The table data of Hbase is sorted and stored according to RowKey [22].RowKey is the first level index of the table and the query against RowKey is more efficient. In this paper, some small tables are constructed for very large tables as secondary index tables for large tables. When retrieving the data, we will first find the Rowkey of the real table through the routing table and then retrieve the data through the RowKey in the main table to guarantee the efficiency of the query.
The data collection layer aspect consists of two parts:
The first part is buried JS development. The user behaviour data is captured by embedding the JS buried code through the website. The second part is to collect access logs on Nginx through Flume-ng. Because the logs are distributed on several or even dozens of Nginx servers, to each application server to deploy Flume-ng agent, so we need to build a set of flexible and configurable differentiation of Flume-ng scheme, in order to facilitate the later use of Storm for streaming processing.
Data sources, not only limited to the JS collection of user behaviour access logs, there are also many application services each component application logs written by the application itself. Defined mainly according to the specific business situation, the data need to be collected in HBase. This part of the data format has its own specificity and non-regularity, so in the collection of this part of the data to achieve generality. Therefore, this paper develops a custom Source component based on Flume-ng to adapt to the ever-changing system logs.
First, for the path and name of the data, it needs to adaptively match the log names with timestamps, because generally in real production environments, logs are timestamped.
Second, for the content of the log, it is necessary to build a set of regular matching method to match the data capacity, because the data content contains special symbols, and Flume-ng matches the data through the way of carriage return and line feed.
Thirdly, Flume-ng can’t do breakpoint transmission, when the Tail method of Source is turned on, Flume-ng Agent service is unavailable, restarting the Agent will cause data loss. In this regard, it is necessary to achieve high availability of the data collected by Flume-ng. To prevent data loss caused by Agent downtime.
Constructed Flume-ng data collection platform must have LoadBalance and FailOver features 20’, so as to achieve a constant flow of data, if the data collection service is down, the log is lost, so the real-time collection system is worthless. So on the overall architecture of Flume-ng, we designed a set of Flume-ng clusters that can be horizontally expanded. The same can be horizontally expanded cluster capacity to improve the throughput of Flume-ng, and the cluster itself will not be unavailable because of the downtime of a machine. The architecture is shown in Figure 2.
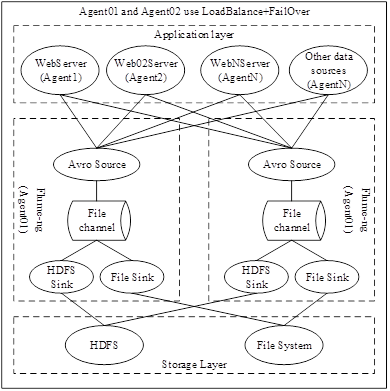
Install the Flume-ng agent on each server that needs to collect logs and use it to monitor log information so that logs can be pushed out in real time. Build a set of Flume-ng clusters in the middle tier, which then serves as the core of the data collection. Each flume-ng exists separately, does not depend on each other, and does not need the server to maintain and control. When there are only two Flume-ngs in the cluster, the data will be equally distributed to each Flume-ng. If one of the Flume-ngs goes down, the system automatically switches over to the active Flume-ng without sending a message to the downed server. When the downed Flume-ng turns on the service again, the system automatically detects it and switches back to the original implementation.
The problem to be solved by the design of real-time data streaming computing engine is to customise a set of engines that can analyse and compute data streams in quasi real-time [21]. The real-time data streaming computing engine consists of four modules: data stream parallel analysis framework, real-time geographical analysis module, user behaviour correlation module, and real-time analysis results storage.
Data streaming parallel analysis framework: after the data flows into the storm will be cut into time slices of data according to time. These time slices of data can be processed in parallel to speed up the analysis and processing speed, and it is easy to expand the parallel computing capacity.
Real-time geographical analysis module: users are classified by geographical labels. Geographic labels are an important type of labels in the user behaviour analysis system, and there are two latitudes for geographic areas: urban geographic areas and network geographic areas. By dividing the users according to the geography, the geographic information of the users is identified.
User Behaviour Association Module: Through this module, the various modules parsed by the data flow engine are associated with each other in terms of user behaviour. Such as user browsing, login, order and other data. Associate. The user’s behaviour is linked together. Completion of the user’s entire life cycle of data linkage.
Real-time analysis results storage: the main function of the real-time analysis results storage module is to store the results of the analysis of data flow analysis engine data in real time, the analysis of data flow is for the final analysis report or analysis system to generate data, so the analysis results need to be stored accordingly.
In this paper, the marketing dataset collected by a cross-border e-commerce enterprise is chosen as the experimental dataset, which is composed of a total of 45,228 data in the whole dataset and contains 17 features and 2 labels. The purpose is to predict whether a customer will buy the products of the enterprise or not, which is in essence a binary classification problem. Here, the main object data are mainly two kinds of data: numerical data and categorical data, and, since the ratio of positive and negative samples reaches 1:8, the dataset is an unbalanced dataset.
In order to assess the accuracy and effectiveness of the behavioural data flow analysis system in this paper, the average data response time and system throughput rate are used as evaluation metrics.
Average data response time: In order to evaluate the accuracy of the proposed data streaming analysis system, this paper adopts the average data response time as the evaluation index. The average data response time \(T_{s}\) represents the average value of the time interval between the generation and processing of data items in a streaming data set, and is calculated as follows: \[\label{GrindEQ__6_} T_{s} =\frac{\sum _{i=1}^{n}(t_{ei} -t_{si} ) }{n} , \tag{6}\] where \(t_{ei}\) indicates the point in time when the data item is processed, \(t_{si}\) indicates the point in time when the data item is generated, and \(n\) indicates the number of data items.
Throughput rate: the number of data items completed per unit of time (per second). In order to evaluate the effectiveness of the proposed streamlined queuing model, this paper adopts the throughput rate as the evaluation index, and the calculation formula is as follows: \[\label{GrindEQ__7_} TP=\frac{n}{t_{ \text{finish}} -t_{ \text{start}} } , \tag{7}\] where \(t_{finish}\) denotes the point in time at which a time window ends, \(t_{start}\) denotes the point in time at which the time window begins, and \(n\) denotes the number of data items contained in this time window.
We have chosen a similar system, WordCount, as a control to conduct validation experiments on the accuracy of the data flow analysis system in this paper. The average response time of the data calculated by performance modelling and the average response time of the data actually measured in this paper’s system were compared under different configuration scenarios, and the distribution of the errors was analysed using the cumulative distribution function (CDF). Throughout the test, 30 batches of data were randomly grabbed under the steady state condition of the application to find their data mean response time.
Tests were carried out under different data arrival intensities, where the values of data arrival intensities were divided into 2 groups with data arrival rates of 4000events/s (#1) and 6000events/s (#2), with batch intervals set to 1s and data block division intervals of 100ms.
In the system of this paper, the data arrival rate is the core parameter that affects the average response time of the data, this is because when the data arrival rate surges, it is possible to make the system in a non-stationary state, the waiting time of the data in the receiving phase increases, and with the change of the data arrival rate, the amount of the data received in a fixed time also changes, which leads to the change of the amount of the data in each batch interval job and affects the average response time .
Figure 3 shows the average response time of the data of the system of this paper under the intensity of the first set of data arrivals, Figure 4 shows the average response time of the data of WordCount under the intensity of the first set of data arrivals, Figure 5 shows the average response time of the data of the system of this paper under the intensity of the second set of data arrivals, and Figure 6 shows the average response time of the data of WordCount under the intensity of the second set of data arrivals.
From the figure, it can be seen that under different data arrival intensities, for the system of this paper, the accuracy of the computed data average response time is up to 99.8%, and more than 90% of the existing test batches have a data average response time error of less than 8%. Since we use the average time of the tasks in multiple phases to calculate when running phase solving for job scheduling for applications of varying complexity, this results in a slightly larger error for the traditional WordCount system than for the system in this paper.
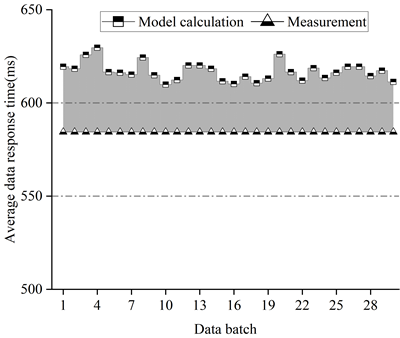
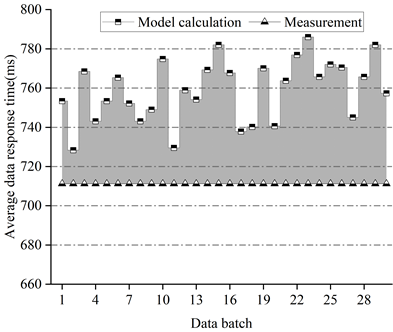
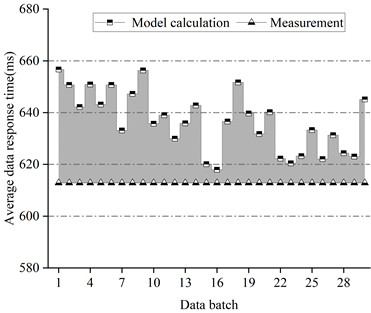
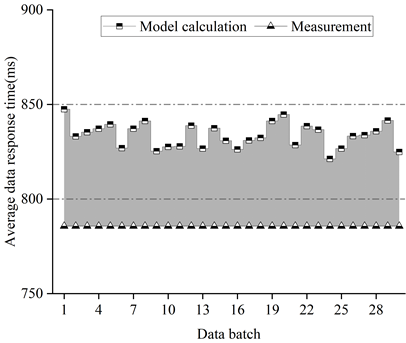
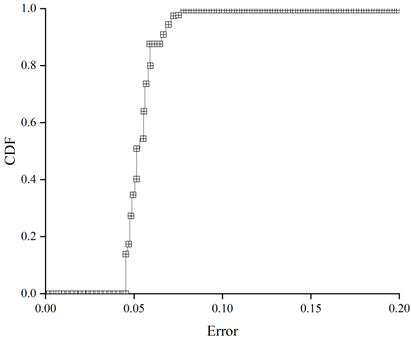
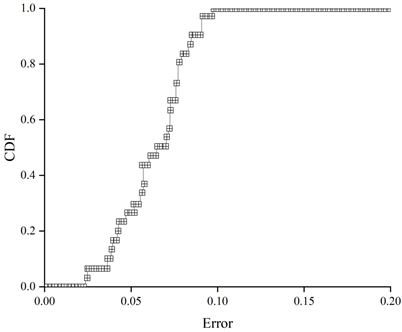
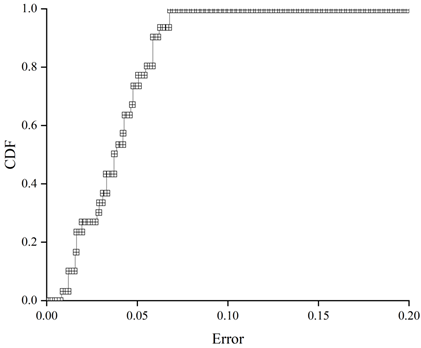
Figure 7 shows the error distribution of the average data response time of the system herein for a first set of data arrival intensities, Figure 8 shows the error distribution of the average data response time of WordCount for a first set of data arrival intensities, Figure 9 shows the error distribution of the average data response time of the system herein for a second set of data arrival intensities, and Figure 10 shows the error distribution of the average data response time of WordCount for a second set of data arrival intensities. Error distribution of data average response time of WordCount under the second set of data arrival intensity.
The error distribution can be analysed by calculating the cumulative distribution function of the errors, and it can be seen from the error distribution graphs that there is no great difference in their accuracy for different types of applications. The calculated data average response time of the system in this paper is less than the actual tested data average response time, and it can be seen that the accuracy of the system can reach 96% on average and up to 99% due to the accurate component design.

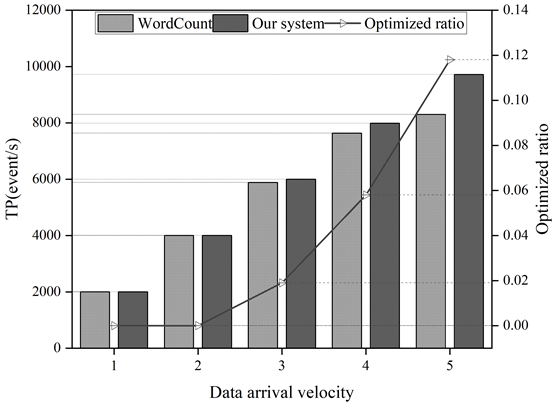
In order to verify the effectiveness of the system in this paper, WordCount, a typical representative system, is selected to measure the change of system throughput rate under five groups of different data arrival rate conditions, which are grouped into the following data arrival rate groups: 2000events/s(#1), 4000events/s(#2), 6000events/s(#3), 8000events/s (#4), 10000events/s (#5).
Figure 11 shows the results of throughput rate test with different data arrival strengths. From Figure 11, it can be seen that with the increase of data arrival rate, the throughput rate of this paper’s system has a maximum lead of 11.8% compared to the comparison system. The data arrival intensity selected for this experiment contains two groups of low load intensity, when the data arrival rate is lower, it can be seen that there is no difference in the throughput rate, this is because when the data arrival rate is lower, the resource utilisation is also lower, and the parameters of each module of the system do not have much impact on the system. When the data arrival rate is high, the cluster resource utilisation is high and the frequent acquisition of the parameters of the modules affects the performance of the system, and the percentage of optimisation of the throughput rate of the system increases drastically with the increase in the data arrival rate, which indicates that the system in this paper is particularly effective for scenarios with high data arrival rates.
Taking a sea buckthorn manufacturer as the research object, we compare the changes in the marketing effect of sea buckthorn products in cross-border e-commerce platforms before and after the manufacturer applies the e-commerce user behaviour data flow analysis system designed in this paper.
Using the A/B Test grouping strategy, the official mall of platform T and the official mall of platform J, which have been the long-term focus of the enterprise, are taken as the monitoring control group A, which is responsible for executing the online marketing activities that have formed the practice of the enterprise in a step-by-step manner. The P platform official shop as monitoring implementation group B, responsible for according to the marketing data flow analysis results obtained by the system in this paper, targeted adjustment and development of marketing strategies. By electronically collecting the data of the key indicators of the enterprise’s marketing activities monitoring control group A and execution group B in 2023 through online channels, the key indicators of the enterprise’s sea buckthorn products were finally obtained. The comparison of the marketing effect of the enterprise before and after applying the system in this paper is shown in Table 1.
From Table 1, it can be seen that compared with the traditional marketing method, the marketing method implemented after the marketing data flow analysis has better marketing effect, and most of the indicators of the implementation group perform better than the control group.
First of all, the value of monitoring control group A is much higher than that of monitoring implementation group B in all absolute indicators, which indicates that the customer retention of cross-border e-commerce platforms such as platform T and J is much larger than that of platform P. Therefore, the enterprises should prioritise mainstream senior online shopping platforms as the main engine of the enterprise’s sea buckthorn products online marketing in the sea buckthorn products marketing activities.
Secondly, the monitoring implementation group B has better values than the monitoring control group A in each relative indicator. B has a ratio of 1.03 for PUSH message click rate, 1.02 for user registration success rate, 1.27 for online shop attention rate, 0.97, 1.11, and 1.27 for first time transaction rate, returning customer rate, and loyalty rate, respectively, and an online shop sharing Effective rate ratio is 1.78. For these seven relative indicators, the ratio of B to A for six of them is greater than 1, and the ratio of B to A for only one of them is slightly less than 1. Therefore, the marketing effect of implementation group B is more prominent and is more likely to achieve the sales target to meet the marketing expectation compared to control group A.
Therefore, marketing data flow analysis using the system designed in this paper can help to improve the marketing effectiveness of agricultural products on cross-border e-commerce platforms.
| Indicator name | Control group A | Execution group B | B/A | ||
| T platform | J platform | Weighted average | P platform | ||
| Push message quantity | 49386 | 26324 | 30864 | 9657 | |
| Push message click quantity | 28989 | 19553 | 19842 | 6270 | |
| Push click rate | 60.74% | 73.53% | 63.32% | 64.96% | 1.03 |
| Quantity of register intention | 27657 | 17636 | 18306 | 9466 | |
| Quantity of registration | 13334 | 13100 | 10534 | 5579 | |
| Registration rate | 46.69% | 74.81% | 57.72% | 58.61% | 1.02 |
| Online page views | 43459 | 20532 | 25157 | 8307 | |
| Online store subscriptions | 17104 | 9582 | 10323 | 4263 | |
| Subscription rate | 39.71% | 47.09% | 40.55% | 51.35% | 1.27 |
| First trade volume | 32101 | 17638 | 19111 | 7436 | |
| Second trade volume | 7482 | 4241 | 4301 | 1867 | |
| Multiple trades volume | 2235 | 1414 | 1285 | 762 | |
| First trade rate | 78.22% | 76.38% | 77.84% | 75.71% | 0.97 |
| Returning customer rate | 17.30% | 20.30% | 18.39% | 20.44% | 1.11 |
| Loyal customer rate | 7.25% | 6.97% | 5.43% | 6.90% | 1.27 |
| Quantity of link share | 1988 | 1073 | 1073 | 602 | |
| Quantity of click on link share | 289 | 253 | 194 | 197 | |
| Sharing efficiency | 14.25% | 23.06% | 18.18% | 32.28% | 1.78 |
In this paper, we design a user behavior data streaming analysis system from three aspects of data storage, data collection and real-time data streaming calculation, based on the cross-border e-commerce platform marketing data in the user behavior of streaming analysis. The data average response time accuracy of this paper’s system is 99.8% at the highest, and the batches with error less than 8% account for more than 90%, and the error is smaller than the comparison system WordCount.Setting up five groups of different data arrival rate conditions, it is found that the throughput rate of this paper’s system is 11.8% ahead at the maximum compared to the comparison system, which indicates that the system proposed in this paper has accuracy and effectiveness. A sea buckthorn manufacturer selling on the cross-border e-commerce platform is selected to analyze the changes in the marketing effect of its agricultural products before and after applying the system of this paper to analyze the marketing data. The results show that, except for the “first transaction rate”, the before-and-after ratios of PUSH message click rate, user registration success rate, online store attention rate, returning customer rate and loyal customer rate are 1.03, 1.02, 1.27, 1.11, 1.27, and 1.78, which are all better than the traditional marketing methods. Effect. It shows that marketing data flow analysis can help agricultural products in cross-border e-commerce platforms to realize better marketing effects.
This research was supported by the Jiangxi Provincial Department of Education, Jiangxi Provincial Science and Technology Research Project “Research on Precise Marketing Strategies of Big Data Empowering Rural Revitalization with Special Agricultural Products” (Project approval code: GJJ2204520).
Conflict of interest: The authors declare that they have no conflicts of interest.