
As one of the basic industries of the national economy, the aviation industry has a very close relationship with other industries, which has a very important impact on China’s national economy, focusing on the quality and efficiency of the operation of the national economy, and the development of the aviation industry has to be adapted to the adjustment of China’s industrial structure, and at the same time, meets the requirements of the transformation of China’s economic development mode [10,3,11]. As the division of labor in the global economy continues to be clear, the global industrial chain is also gradually formed, the development of the aviation core industry affects the growth of the pro-aircraft economy and international competitiveness, if China’s aviation core industry with the gradual deregulation of the government, it will create a multi-billion-dollar market, and can stimulate the employment of tens of millions of people [2,14,4].
The rapid development of the airside economy has become an important driving force for regional economic development. Just as the function played by railroad transportation in the 20th century at that time, the air transport economy plays an irreplaceable role in the development of economic globalization in the 21st century to improve the industrial structure, drive economic development, and pull employment [5,15,7]. On March 7, 2013, the state officially approved Zhengzhou Comprehensive Experimental Zone of the Airport Economy to become China’s first pilot zone of the development of the airport economy. The construction of the experimental area for the economic development of Henan Province is a huge development opportunity, especially in the current economic development of the new normal background, how to change the mode of economic development, to achieve the optimization and upgrading of industrial structure has become the urgent need to solve the development of Henan Province, and the exploration of the airside economy undoubtedly shows a new way out of the development of people [9,1,18,12]. Meanwhile, facing the real situation, the actual situation and characteristics of aviation core industry development and airside economy construction, using entropy weight and gray situation evaluation method, constructed the aviation core industry development to promote the decision-making model of airside economy construction in Henan Province [6,20,13,19]. The model provides development opportunities for the development of Zhengzhou Comprehensive Experimental Zone of Air Port Economy, for making Henan Province a comprehensive transportation hub including an aviation hub, for better utilizing global resources, for realizing economic interconnections, and for promoting the deep-level development of the airside economy, which is of great theoretical and practical significance [17,16,8].
This study aims to use gray situation decision-making combined with entropy weight method on the basis of gray system theory to make decisions on the problem of airside economic construction. The study firstly started from the theory of development of airside economic construction, and conducted an in-depth research on the driving effect and power relationship between aviation industry and airside economic construction. According to the four airside economic regions in Henan Province, the entropy weight method and gray situation decision-making are used to analyze the airside economic construction problems in Henan Province, among which H2 region is the most suitable for focusing on the construction region, and the priority development of the tertiary industry or the joint development of the secondary and tertiary industries can achieve better comprehensive economic benefits.
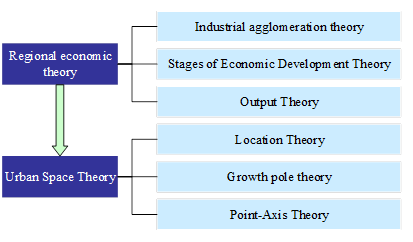
The theory of airside economy is to utilize the core role of aviation industry to drive the development of air transportation, logistics, commerce and shopping, tourism and leisure, industrial development and so on. The theoretical basis for the construction of airside economy is shown in Figure 1, the formation of airside economic zone cannot be separated from the industrial agglomeration, airside economy as an emerging regional economic form, generally the regional economic theory of industrial clustering theory, the theory of the stage of economic development, the theory of output, as well as the theory of location, the theory of growth poles, the theory of the point axis, etc. as the basis.
Industrial clustering refers to the process of industrial development, in a specific field of related enterprises or institutions, due to the commonality and complementarity between each other and other characteristics and closely linked together, the formation of geographically concentrated interconnected, mutually supportive industrial communities.
The theory of stages of economic development is a theory that studies the characteristics, modes, evolutionary process and other laws of economic development in each era from a historical perspective.
The output-based theory holds that the main driving force of regional economic growth is the expansion of exogenous demand, determined by the output industries of the region. The expansion of external demand will drive the development of output industries and service industries in the region, thus causing an exponential increase in the regional economy, and the multiplier of the increase is the ratio of the income of regional output industries to that of non-output industries or the ratio of the employed population.
Location theory studies the human economic behavior of space location selection and the theory of optimal combination of economic activities within the space zone. Its main idea is that location factors determine the place of production, i.e., the location with the lowest production costs and the greatest economic benefits. It points out that spatial accessibility will bring about opportunities and potential for interregional exchanges at the economic, social, technological and other levels, determining the competitiveness of the region. The formation and development of the airside economic zone is precisely because it is located near the aviation industry, and has the unique advantage of spatial accessibility within the region in terms of location.
The basic idea of the growth pole theory is that growth does not appear everywhere at the same time, but it first appears in some growth points or growth poles with different intensities, and then spreads outward through different channels and has different ultimate impacts on the whole economy.
The point-axis theory is a further expansion of the growth pole theory, which emphasizes the role of the “points” of growth poles while stressing the role of the “axes”, i.e., transportation arteries. According to this theory, as the region with better economic development conditions develops into a “point” growth pole, industries and population will gather near the important transportation arteries, which on the one hand will reduce the production and transportation costs and form favorable location conditions and investment environment. On the other hand, the economic growth points along the route can be linked together to form an economic growth axis. According to the theory of point-axis, through the “point” development of the area around the aviation industry and the “axis development” along the peripheral transportation line, and focus on the layout of some airside directional parks in these areas to form a point-axis development pattern, which will lead to the optimization of the urban spatial pattern and the rapid economic growth, and promote the optimization of the airside spatial pattern and the economic growth of the city. This will lead to the optimization of the urban spatial pattern and rapid economic growth, and promote the formation and development of the airside economy.
In recent years, thanks to the huge economic driving effect of the aviation industry, local governments have been actively taking general aviation airports as the core to carry out land development and industrial layout in the surrounding areas, and planning for the construction of airside economic zones, so as to realize the joint promotion of the aviation industry and economic development. The emergence of the airside economic zone originates from the government’s superior planning and the demand of regional economic development on the one hand, and the driving effect of the aviation industry on the neighboring areas on the other hand.
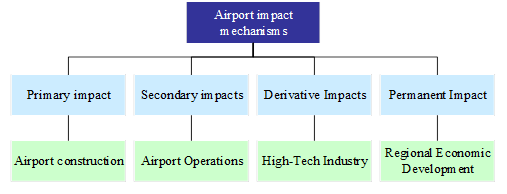
The influence mechanism of aviation industry on airside economy is shown in Figure 2. The airport has certain industrial agglomeration effect and diffusion effect, and this radiation effect makes all kinds of economic resources in the neighboring areas gradually converge to the airport. As a result, various economic integration and development have been realized in the airport and its radiation area, forming a unique economic form, i.e. airside economy. The essence of the driving effect of the aviation industry is the mechanism of the airport’s influence on the airside economy. The impact mechanism of general airport on airside economy can be divided into four levels: primary impact, secondary impact, derivative impact and permanent impact.
Primary impacts are the economic impacts that arise directly from the creation of aviation infrastructure, mainly in terms of contractor jobs and local employment created. This impact disappears with the completion of the aviation industry’s infrastructure and is an immediate impact.
Derivative impacts are the economic impacts generated by the industries that support the operations of the aviation industry, including both general aviation aircraft manufacturing in the early stages and aviation maintenance and management in the later stages. It is also a long-term economic impact.
Permanent impact refers to the potential of the aviation industry to promote the longer-term and broader development of the regional economy, which is mainly generated by the extended industries operated by the aviation industry. This impact involves not only high-tech research and development, but also the national three economies. This permanent impact is therefore the most critical for the development of the regional economy.
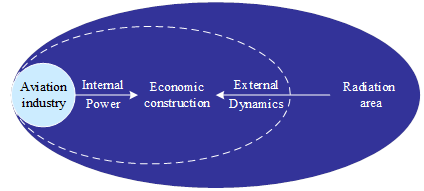
The dynamic relationship between the aviation industry and the construction of the airside economy is shown in Figure 3, and the driving effect of the aviation industry is the intrinsic motivation for the construction and development of the airside economy, which is characterized by spontaneity and longevity, and provides the most basic possibilities for the emergence and development of the construction of the airside economy. However, only the endogenous variable of aviation industry is not enough to promote the generation and development of airside economic construction. The government’s superior planning and the radiation effect of regional economy constitute the exogenous driving force for the development of airside economic construction. Airside economic construction is an attempt to develop the aviation industry. The government carries out macroscopic planning for the region surrounding the aviation industry with certain conditions, adjusts the industrial structure and land use pattern, in order to enhance the radiation capacity of the aviation industry and give full play to the economic driving force of the aviation industry, thus realizing the two-way development of the general aviation industry and the construction of the airside economy. In addition, not as long as the existence of the aviation industry, we have to build the airside economic zone, which is related to the development conditions of the region around the aviation industry and development orientation. The most important regional development conditions are aviation industry, airspace resources and industrial base to measure whether a region is suitable for the construction of the airside economic zone, the development of regional positioning determines whether there is a need to develop the aviation industry in the mode of economic region. It is this interaction of internal and external dynamics that makes the construction and development of an airside economy possible.
Grey situation decision-making is an important part of grey system theory, which takes the “small sample” and “poor information” uncertainty system of “partial information known, partial information unknown” as the research object, mainly through the generation and development of “partial” known information, extracting valuable information, and realizing the correct description and effective monitoring of the system. The information is known as the white system, the information is unknown is called the black system, and the information is partially known and the information is unknown is called the gray system.
Gray situational decision-making, i.e., for the event being dealt with (being decided), different countermeasures are identified to deal with it, from which the most effective countermeasure is selected to deal with the event. It is a decision analysis method that integrates the event, countermeasures, effects and goals. Gray situation decision-making has the advantages of simplicity, practicality and operability, etc. Through the calculation of this method, it can synthesize multiple effect objectives, and it can effectively analyze the relative advantages and disadvantages of the research object in a more objective, comprehensive and accurate way, and it can better overcome the errors due to the subjective factors, so as to carry out effective decision-making.
Decision element, decision vector and decision matrix:
In gray situation decision making, the combination of event \(a_{i}\) and countermeasure \(b_{j}\), which \(s_{ij} =\left(a_{i} ,b_{j} \right)\) is called a situation, represents a situation in which a \(j\) countermeasure \(\left(b_{j} \right)\) is used to respond to event \(\left(a_{i} \right)\) of \(i\). If the effect measure of situation \(s_{ij}\) is \(r_{ij}\), it is called a decision element: \[\label{GrindEQ__1_} \frac{r_{ij} }{s_{ij} } =\frac{r_{ij} }{\left(a_{i} ,b_{j} \right)} . \tag{1}\]
It indicates that the effect of the situation with the \(j\)st response \(\left(b_{j} \right)\) to the \(i\)rd event \(\left(a_{i} \right)\) is \(r_{ij}\).
If there are \(n\) events \(a_{1} ,a_{2} ,\cdots \cdots ,a_{n}\) and \(m\) responses \(b_{1} ,b_{2} ,\cdots \cdots ,b_{m}\) in a certain class of decision problems, and for each event \(a_{i} \left(i=1,2,\cdots \cdots ,n\right)\) there are \(m\) responses that can be used, such as \(b_{1} ,b_{2} ,\cdots \cdots ,b_{m}\) others. For each event \(a_{i} \left(i=1,2,\cdots \cdots ,n\right)\), there are \(m\) situations: \(\left(a_{i} ,b_{1} \right),\left(a_{i} ,b_{2} \right),\cdots \cdots ,\left(a_{i} ,b_{m} \right)\) the decision elements corresponding to these situations can be arranged in a row, and a decision row vector is formed: \[\label{GrindEQ__2_} D_{i} =\left[\frac{r_{i1} }{s_{i1} } ,\frac{r_{i2} }{s_{i2} } ,\cdots ,\frac{r_{im} }{s_{im} } \right] . \tag{2}\]
In the above equation, \(r_{ij}\) is the effect measure of situation \(s_{ij} =\left(a_{i} ,b_{j} \right)\).
Similarly, each response \(b_{j} \left(j=1,2,\cdots \cdots ,m\right)\), which can be matched with event \(a_{1} ,a_{2} ,\cdots \cdots ,a_{n}\), and its corresponding decision elements can be lined up to form a decision column vector: \[\label{GrindEQ__3_} Q_{i} =\left[\begin{array}{c} {\frac{r_{1j} }{s_{1j} } } \\ {\frac{r_{2j} }{r_{2j} } } \\ {\vdots } \\ {\frac{r_{mj} }{s_{mj} } } \end{array}\right] . \tag{3}\]
Arrange the decision row vector \(D_{i} \left(i=1,2,\cdots \cdots ,n\right)\) with the decision column \(Q_{j} \left(j=1,2,\cdots \cdots ,m\right)\) to form a situation matrix: \[\label{GrindEQ__4_} M=\left[\begin{array}{cccc} {\frac{r_{11} }{s_{11} } } & {\frac{r_{12} }{s_{12} } } & {\cdots } & {\frac{r_{1m} }{s_{1m} } } \\ {\frac{r_{21} }{s_{21} } } & {\frac{r_{22} }{s_{22} } } & {\cdots } & {\frac{r_{2m} }{s_{2m} } } \\ {} & {} & {\vdots } & {} \\ {\frac{r_{n1} }{s_{n1} } } & {\frac{r_{n2} }{s_{n2} } } & {\cdots } & {\frac{r_{nm} }{s_{nm} } } \end{array}\right] \tag{4}\]
Refers to the comparison of the actual effects produced by situations under different objectives. Since the sample size of the effect of the situation under different objectives is different, the requirements are also different. For example, the more the number of direct points scored by the first attack, the better, and the fewer the number of errors and blocked, the better, only in this way can the actual effect of the first attack be shown. Therefore, the effect of different goals for simple comparison and decision-making seems to be inappropriate. Based on this a measure is proposed to standardize the effect values of the same polarity, i.e. the effect measure. Effect measures are categorized into upper limit effect measures and lower limit effect measures.
Upper limit effect measure: \[\label{GrindEQ__5_} r_{ij} =\frac{u_{ij} }{\max _{i,j} \left\{u_{ij} \right\}} , \tag{5}\] \[\label{GrindEQ__6_} u_{ij} \le u_{\max }, \tag{6}\] where, \(u_{ij}\) is the measured effect of situation \(s_{ij}\) and \(u_{\max }\) is the maximum moderate effect measure of the measured effect of situation \(s_{ij}\). \[\label{GrindEQ__7_} r_{ij} =\frac{\min \left\{u_{ij} ,u_{0} \right\}}{\max \left\{u_{ij} ,u_{0} \right\}}, \tag{7}\] where, \(u_{0}\) is specified as a moderate value.
The lower bound effect measure is: \[\label{GrindEQ__8_} r_{ij} =\frac{\min \left\{u_{ij} \right\}}{u_{ij} } , \tag{8}\] \[\label{GrindEQ__9_} u_{ij} \le u_{\min }, \tag{9}\] where \(u_{ij}\) is the measured effect of situation \(s_{ij}\) and \(u_{\min }\) is the minimum of the measured effects of situation \(s_{si}\).
In practice, the effect measure should be chosen according to the nature of the target. Hope that the sample value of the effect under a certain goal is as big as possible, the upper limit should be used to measure the effect; hope that the sample value of the effect under a certain goal is as small as possible, the lower limit should be used to measure the effect; and the sample of the effect under a certain goal, do not want to be too big or too small, and hope to take a certain moderate value should be selected as a moderate effect measure.
When there are multiple situation goals, the effect measure of the \(h\)th goal is \(\frac{r_{ij}^{\left(h\right)} }{s_{ij}^{\left(h\right)} }\), and its decision matrix \(M^{\left(h\right)}\) is: \[\label{GrindEQ__10_} M^{\left(h\right)} =\left[\begin{array}{c} {\frac{r_{11}^{\left(h\right)} }{s_{11}^{\left(h\right)} } ,\frac{r_{12}^{\left(h\right)} }{s_{12}^{\left(h\right)} } ,\cdots ,\frac{r_{1m}^{\left(h\right)} }{s_{1m}^{\left(h\right)} } } \\ {\vdots } \\ {\frac{r_{n1}^{\left(h\right)} }{s_{n1}^{\left(h\right)} } ,\frac{r_{n2}^{\left(h\right)} }{s_{n2}^{\left(h\right)} } ,\cdots ,\frac{r_{nm}^{\left(h\right)} }{s_{nm}^{\left(h\right)} } } \end{array}\right] . \tag{10}\]
For multi-objective decision making, in order to differentiate the size of the contribution of each effect measure to the final goal and to make the decision more rational, it is necessary to weight the effect measures according to each objective.
If the weight of the \(H\)st objective is \(\omega _{h} \left(h=1,2,\cdots \cdots ,n\right)\), the combined effect measure can be derived: \[\label{GrindEQ__11_} r_{ij} =\sum _{h=1}^{n}\omega _{h} r_{ij}^{\left(h\right)} . \tag{11}\]
If the weights of the individual objectives are the same, at \(\omega _{1} =\omega _{2} =\omega _{3} =\cdots =\frac{1}{n}\), they can be transformed by shifting Eq: \[\label{GrindEQ__12_} r_{ij} =\frac{1}{n} \sum _{h=1}^{n}r_{ij}^{\left(h\right)} . \tag{12}\]
The weighted multi-objective situation decision matrix \(M\) is obtained: \[\label{GrindEQ__13_} M^{\left(h\right)} =\left[\begin{array}{c} {\frac{r_{11} }{s_{11} } ,\frac{r_{12} }{s_{12} } ,\cdots ,\frac{r_{1m} }{s_{1m} } } \\ {\vdots } \\ {\frac{r_{n1} }{s_{n1} } ,\frac{r_{n2} }{s_{n2} } ,\cdots ,\frac{r_{nm} }{s_{nm} } } \end{array}\right] . \tag{13}\]
According to the multi-objective decision matrix, finding the best result makes: \[\label{GrindEQ__14_} \frac{r_{ij} }{s_{ij} } \to \max \left(\min \right) . \tag{14}\]
The situation that satisfies the above equation, \(\left(a_{i} ,b_{j} \right)i=1,2,\cdots \cdots ,n\); \(j=1,2,\cdots \cdots ,m\) is called the optimal situation, i.e., it means that \(a_{i}\) is the most appropriate event for countermeasure \(b_{j}\), which leads to the final decision result.
The specific steps of gray situation decision-making in the process of problem solving:
Determine the events and countermeasures.
Construct the situation.
Determine the objectives.
Give the whitening values of different objectives.
Calculate the situation effect measures for different objectives and give the decision matrix.
Calculate the combined effect measure of different objectives and give a decision matrix.
Determine the optimal situation
Gray situation decision-making has been widely used in practice, but it also has obvious theoretical flaws. The traditional gray situation decision-making divides the indicators into equal weights. However, in reality, the weight of each indicator is often not the same, that is, there is a problem of weight distribution. In order to get a more objective and practical weight, this paper gives the weight obtained from the entropy weight method to the gray situation decision-making, and determines the weight of the indicators of the gray situation decision-making, so as to improve it.
Principle of entropy value method, there is \(m\) indicator to be evaluated, \(n\) evaluation programs, the formation of the original indicator data matrix \(x=\left(x_{ij} \right)_{m\times n}\) for a particular indicator \(x_{i}\) pairs, the greater the difference between the indicator value \(x_{ij}\), the greater the role of the indicator in the comprehensive evaluation of the weight of the indicator; if all the values of a particular indicator are equal, the indicator does not play a role in the comprehensive evaluation of the information theory, the greater the degree of variation of the value of a certain indicator, the greater the amount of information provided by this indicator, the weight of the indicator should also be the greater. In information theory, the greater the degree of variability of the value of an indicator, the more information the indicator provides, and the greater the weight of the indicator should be, and vice versa. Utilizing this tool to calculate the weight of each indicator can provide a basis for multi-indicator evaluation.
Steps of entropy value method are:
Quantify each indicator in the same way and calculate the weight of the indicator value of the jth program \(p_{ij}\): \[\label{GrindEQ__15_} p_{v} ={x_{q} \mathord{\left/ {\vphantom {x_{q} \sum _{i=1}^{n}x_{v} }} \right. } \sum _{i=1}^{n}x_{v} }. \tag{15}\]
Calculate the entropy value of the \(i\)st indicator \(e_{i}\): \[\label{GrindEQ__16_} e_{i} =-k\sum _{j=1}^{n}p_{ij} \ln p_{ij} , \tag{16}\] where \(k>0\), take \(k=\frac{1}{\ln m}\), \(\ln\) is the natural logarithm, \(e_{i} \ge 0\), if \(x_{ij}\) for the given \(j\) all equal, at this time, \(e_{i}\) take a very large value, the indicator \(i\) has no effect, and vice versa.
Define the coefficient of variation \(g_{i} =1-e_{i}\), then when \(g_{i}\) is larger, the indicator is more important.
Use the entropy method to determine the weight of the gray situation decision-making indicators: \[\label{GrindEQ__17_} w_{i} ={g_{i} \mathord{\left/ {\vphantom {g_{i} \sum _{i=1}^{m}g_{i} }} \right. } \sum _{i=1}^{m}g_{i} } ,\left(I=1,2,3,\cdots ,m\right) , \tag{17}\]
where \(m\) indicator to form a vector of weights: \[\label{GrindEQ__18_} w=\left(w_{1} ,w_{2} ,\cdots ,w_{n} \right) . \tag{18}\]
Gray situation decision-making based on the entropy weighting method requires substituting Eq. (17) into the unified effect measure for Situation \(s_{ij}\): \[\label{GrindEQ__19_} r_{ij}^{\Sigma } =\sum _{p=1}^{L}w r_{ij}^{p} . \tag{19}\]
Then there is in situation \(S\): \[\label{GrindEQ__20_} S=\left\{\begin{array}{cccc} {S_{11} } & {S_{12} } & {\cdots } & {S_{1m} } \\ {S_{21} } & {S_{22} } & {\cdots } & {S_{2m} } \\ {\vdots } & {\vdots } & {\ddots } & {\vdots } \\ {S_{n1} } & {S_{n2} } & {\cdots } & {S_{nm} } \end{array}\right\} \tag{20}\] \[\label{GrindEQ__21_} r=\left\{\begin{array}{cccc} {r_{11} } & {r_{12} } & {\cdots } & {r_{1m} } \\ {r_{21} } & {r_{22} } & {\cdots } & {r_{2m} } \\ {\vdots } & {\vdots } & {\ddots } & {\vdots } \\ {r_{n1} } & {r_{n2} } & {\cdots } & {r_{nm} } \end{array}\right\} . \tag{21}\]
Call \(S\) the situation, \(S_{i}\) the situation of event \(a_{i}\), \(S_{i} =\left[S_{a} ,S_{a} ,\cdots S_{m} \right]\). \(r_{i}\) the unified measurement space of event \(a_{i}\), \(r_{i} =\left\lfloor r_{i1}^{\Sigma } ,r_{i2}^{\Sigma } ,\cdots ,r_{in}^{\Sigma } \right\rfloor\), \(r_{ij}^{\Sigma } *={\mathop{\max }\limits_{j}} r_{ij}^{\Sigma }\), and \(r_{ij}^{\Sigma } *\Rightarrow S_{ij} {}^{*} =\left(a_{i} ,b_{j} {}^{*} \right)\), then call \(S_{ij} {}^{*}\) the satisfactory situation of \(a_{i}\) and \(b_{j} {}^{*}\) the satisfactory response of \(a_{i}\).
For the gray trend decision-making research and development analysis of airside economic construction in Henan Province, it is necessary to understand the economic development of Henan’s aviation industry before proposing a development strategy in line with the actual situation. This paper collects the economic construction data of Henan Province in 2023 according to the China Urban Statistical Yearbook, and statistics the aviation industry and airside economic construction of four regions in Henan Province in 2022, the five aviation industry and airside economic construction regions are labeled as H1\(\mathrm{\sim}\)H5. The airside economic construction situation is shown in Table 1, and the total area of airside economic construction of the four regions in Henan Province in 2022 reaches 390.316 km², the total population reaches 152.26 million people, and the total regional output value and per capita output value are 297177559 million yuan and 89194.2 yuan respectively. Among them, H2 region has the highest percentage of area, population and total regional output value, but the per capita output value is 19897.6 yuan, ranking second, which is 411.3 yuan less compared with H3 region.
| Regional | Area | Population | Regional output | Per capita output | ||||
|
Amount
(km²) |
SP(%) | Amount(10000) | SP(%) | Amount(W/CNY) | SP(%) | Amount(CNY) | SP(%) | |
| H1 | 43.549 | 11.16 | 1285 | 8.44 | 1788454 | 0.61 | 14511.6 | 16.27 |
| H2 | 256.68 | 65.76 | 10023 | 65.83 | 196412368 | 66.09 | 19486.3 | 21.85 |
| H3 | 32.476 | 8.32 | 2133 | 14.01 | 41013256 | 13.80 | 19897.6 | 22.31 |
| H4 | 57.611 | 14.76 | 1785 | 11.72 | 57963481 | 19.50 | 35298.7 | 39.57 |
| Total | 390.316 | 100 | 15226 | 100 | 297177559 | 100 | 89194.2 | 100 |
In order to analyze the future development direction of the airside economic construction in Henan Province, the distribution of the industry is the same, and the distribution of the aviation industry is shown in Table 2. It can be seen through the data that the highest comprehensive economy is H2 region, the total value of the three industries reached 781,243,546,000 yuan. The highest number of people employed in H2 region is the secondary industry, the number of people is as high as 4,494,400 people. The total comprehensive economy of the three industries in H4 region is ranked second, and the tertiary industry is the main type of industry in it, the number of people employed and the total economy are 1,001,100 people and 59796158.3 million yuan. This section analyzes the development of aviation industry and the construction of airside economy in the four regions of Henan Province, which provides a scientific basis for the following research on the decision analysis of the gray situation of the construction of airside economy.
| Regional | practitioner | Integrated economy(W/CNY) | |||||
| First crop | Second production | Tertiary industry | First crop | Second production | Tertiary industry | Total | |
| H1 | 5.42 | 25.48 | 58.62 | 3415785.6 | 6715324.6 | 7756256.8 | 17887367 |
| H2 | 16.23 | 449.44 | 374.11 | 21140975.1 | 101141874.3 | 78124354.6 | 200407204 |
| H3 | 7.44 | 67.24 | 65.48 | 5485415.8 | 22423584.7 | 15454684.4 | 43363684.9 |
| H4 | 23.54 | 96.66 | 100.11 | 5916234.6 | 30134568.9 | 23745354.8 | 59796158.3 |
The original whitened effect matrix of site selection decision is shown in Table 3. The comprehensive economic benefits of the construction of the four airside economic zones in Henan Province, H1\(\mathrm{\sim}\)H4, are brought into the gray situation decision-making calculation, so as to analyze the focusing centers of the airside economic construction in the regions of Henan Province, H1\(\mathrm{\sim}\)H4.
According to the land use planning of the construction department of Henan Province and the distribution of this aviation industry, H1\(\mathrm{\sim}\)H4 are initially identified as 4 candidate addresses. There are 5 indicators for further evaluation of these 4 candidate addresses, denoted as K1\(\mathrm{\sim}\)K4, i.e., in the gray situation formula \(i=(1,…,4)\), which denotes the cost of land use, highway accessibility, railroad freight station accessibility, port accessibility, and the mean value of the time required to get to all the industries, in which the cost of land use and the mean value of the time required to get to all the industries are the cost-type indicators which are the smaller and the better, and the remaining 3 are the larger and the better benefit-type indicators, and there is no neutral indicator.
According to the entropy weight method and gray situation decision-making model constructed in this paper, the event a1 is the only event for the site selection of the key construction of the pro-aircraft economy. The countermeasures are the four regions from H1 to H4 in Henan Province, and the situation is c1 = (a1, H1), c2 = (a1, H2), c3 = (a1, H3), and c4 = (a1, H4).
The entropy weight vector space of the effect measure is obtained according to Eq: \[\label{GrindEQ__22_} W=[0.175,0.2279,0.1722,0.2105] . \tag{22}\]
The space of composite effect measures for event a1 is calculated from the weighted composite effect measures as: \[\label{GrindEQ__23_} r^{\pi } =[0.8542,0.9789,0.8561,0.5123] . \tag{23}\]
According to the comprehensive effect measurement space \(r^{\pi }\) of event a1, it can be seen that the situation 2 score is 0.9789 with the highest value, which is the best situation for the key construction of the airside economy. The key construction area of the airside economy in Henan Province should be selected as the H2 area, and H2 is the best candidate address among the four discrete candidate addresses.
| \(k_i \) | H1 | H2 | H2 | H4 | Polarity |
| K1 | 35 | 25 | 30 | 32 | Cost type |
| K2 | 1.0 | 1.0 | 0.9 | 0.8 | Effect type |
| K3 | 0.6 | 0.8 | 0.8 | 0.9 | Effect type |
| K4 | 0.7 | 0.9 | 0.7 | 0.8 | Effect type |
| K5 | 80 | 85 | 90 | 85 | Cost type |
This paper further analyzes the decision-making for the construction of H2 airside economy in Henan Province on the basis of the above site selection for the key construction of airside economy in Henan Province. The construction of H2 regional airside economy is defined as event a, according to the distribution of H2 regional industry to formulate five kinds of decision-making programs, respectively, for the primary industry priority development,,, the secondary industry priority development, the tertiary industry priority development, the first and tertiary industry priority and the first and the second industry priority, i.e., the situation S1 \(\mathrm{\sim}\) S5. The above programs are required to achieve the 10 percent sustained output growth of the H2 airside economy region within two years. According to the actual situation of the comprehensive consideration of various factors to determine the objectives of the H2 temporary economic construction, respectively, fixed investment, construction costs, comprehensive economic output, logistics costs, supply chain flexibility and expansion cycle, noted as M1 \(\mathrm{\sim}\) M6. According to this paper entropy weights and the method of gray situation decision-making calculations, the effect of the construction of the H2 Provisional Economic Construction of the various options to measure the results are shown in Table 4, through the calculation of the five kinds of decision-making program of the unified measurement is: \[\label{GrindEQ__24_} r^{\pi } =[0.715,0.736,0.755,0.702,0.749] . \tag{24}\]
Based on the calculation results, it can be seen that situation 3 and situation 5 have the highest scores of 0.755 and 0.749 respectively, which means that the economic effect achieved by prioritizing the development of tertiary industry or the co-development of secondary and tertiary industries for the construction of the airside economy in the area of H2 in Hebei Province is the highest.
| Target | S1 | S2 | S3 | S4 | S5 | |
| M1 | Fixed investment | 0.262 | 0.333 | 0.842 | 0.548 | 1 |
| M² | Construction cost | 0.271 | 1 | 1 | 1 | 1 |
| M3 | Total economic output | 1 | 0.978 | 0.965 | 0.952 | 0.875 |
| M4 | Logistics cost | 1 | 0.763 | 0.471 | 0.376 | 0.451 |
| M5 | Supply chain flexibility | 0.501 | 1 | 1 | 1 | 0.5 |
| M6 | Expansion cycle | 0.243 | 0.404 | 0.422 | 0.400 | 1 |
The study analyzes the decision-making of airside economic construction in Henan Province by combining the gray situation decision-making and entropy weight method, so as to select the countermeasures with the best effect of comprehensive economic benefits.
Through the investigation and statistics, it can be seen that the total area of airside economic construction in four regions of Henan Province reaches 390.316km², and the total regional output value is 297177559 million yuan. Among them, H2 region has the highest proportion of area, population and total regional output value, and the comprehensive economy of H2 region is the highest, with the total value of the three industries reaching 781,243,546,000 yuan. In the decision-making on the location of the key construction of the airside economy, according to the gray decision-making effect measure calculation, the key construction area of the airside economy in Henan Province should be selected as the H2 area, with an effect measure score of 0.9789, the highest value. The best address among the four discrete candidate addresses in the H2 area, and in combination with the economic development, the H2 area also has a large advantage.
In addition, Situation 3 and Situation 5 of the decision-making of H2’s pro-aircraft economy program have the highest values of 0.755 and 0.749, respectively.It means that the pro-aircraft economy construction in H2 region of Hebei Province should prioritize the development of tertiary industry or the co-development of secondary and tertiary industries, under which decision-making, the pro-aircraft economy construction of H2 can achieve a better economic effect.