
Financial statements are accounting statements reflecting the status of funds and profits of an enterprise or budget unit for a certain period of time. The state requires enterprises to prepare and report uniformly in strict accordance with the requirements of the Accounting Standards and related accounting systems, and disclose them to the public for stakeholders’ decision-making reference [9]. At present, regardless of the size of the enterprise, whether private or state-owned enterprises, the different interests of the starting point of the triggers have led to the existence of financial statement fraud phenomenon more or less. Financial statement fraud not only harms the legitimate interests of investors and creditors, but also seriously affects the national macro-control of economic operations and the stable and sustainable development of the national economy [3]. Need to strengthen the supervision of financial statement fraud phenomenon, standardization, to avoid expanding the capital market disruption damage to the national interest, undermine the professional integrity of the financial industry [5].
In recent years, relevant tax units began to focus on corporate financial statements, and a large number of scholars began to research on financial statement anomaly detection.Soltani, M et al. constructed a fuzzy neural network for financial forgery detection, and found that its performance is better than ordinary statistical models and ordinary artificial neural networks [19]. Aftabi, S. Z conducted financial forgery identification for 76 Greek listed companies and research and found that Bayesian network outperforms neural network and ID3 decision tree and financial distress, leverage level, profitability, sales performance, and solvency are significantly correlated with financial fraud [1]. Ashtiani, M. N et al. used multi-layer feed-forward neural network, support vector machine, genetic programming, data processing grouping method, logistic regression, and probabilistic neural network on the mining 35 features of 101 counterfeiting companies listed on the stock exchange with 101 non-counterfeiting companies. Using t-test for feature selection, it was found that genetic programming and probabilistic neural network performed best in the feature-selected dataset, and probabilistic neural network performed best in the full dataset [2]. Schultz, M et al. used a sequential combination of supervised and unsupervised learning methods to firstly classify the companies into counterfeiting, non-counterfeiting, and suspicious using K-means. Then supervised learning method was used to predict the fraudulent company financial statements and it was verified that multilayer feed forward neural network performed the best [16]. Shahana, T used an artificial bee colony algorithm to extract a suitable subset of features and used multiple classifiers to detect fraudulent behaviors in 83 Egyptian companies [17]. Al-Hashedi, K. G constructed two sets of data, Group A for M-score model with 8 ratio indicators, and Group B is the difference of year-to-year changes in the indicators of the initial input variables of the M-score. Logistic regression and linear discriminant analysis were also utilized to find the determinants of unintentional accounting errors leading to financial restatements and to construct a detection model, and it was found that the model developed for Group B data was more accurate and the logistic regression model outperformed the linear discriminant model [7]. Pinto, S. O used a combination of random forest, gradient ascent tree, neural network, and self-coding network methods with benchmarking methods, stepwise regression logistic comparison and found that gradient ascent, neural network, and random forest perform better than the other two for internal abuse and fraud prediction in Bank of America [14].
Financial statements are an important basis for accounting information users to understand the reality of enterprises and make decisions. While improving the auditors’ own technical level and professional ethics, big data analytics should also be utilized to empower auditing and improve the ability to quickly detect financial statement fraud. The purpose of this paper is to study the detection of abnormalities in corporate financial reports and the identification of financial fraud, and to bring in deep neural network methods in the research process to promote the rapid identification and classification of abnormal reports and financial fraud. Firstly, it describes the common means of financial fraud and the motivation of financial statement fraud, and then selects samples and analyzes the characteristic indexes of financial statement fraud, so as to set variable indexes. Finally, if the anomaly score AS exceeds the threshold, the financial statement information is labeled as anomalous. For the future enterprise financial statement anomaly detection and financial fraud identification, provide guidance program.
Routinely, financial fraud manifests itself in the following forms:
Adjustment of profits using inappropriate related transactions, which refers to the direct transfer of resources, labor, or obligations between related parties, regardless of whether or not payments are received. Its main ways are shifting the burden of expenses, transferring assets, leasing of related assets, asset replacement, and non-fair purchase and sale of business [23].
False recognition of revenues, liabilities and expenses mainly includes early recognition of revenues, fictitious sales activities, recognition of revenues when there is uncertainty in assets, fraudulent use of accounts payable and production costs, excessive capitalization of expenses, non-correspondence of debts and liabilities, incomplete and illegal formalities, and failure to recognize them in a timely manner.
One of the forms of false recognition of assets is the use of asset evaluation to eliminate latent losses, in accordance with the provisions of accounting standards and the requirements of the principle of prudence. The potential losses of enterprises should be reflected in the income statement in accordance with legal procedures. However, in many enterprises, especially state-owned enterprises, often through asset evaluation, bad debts, long-term investment losses, fixed asset losses, slow-moving and damaged inventory, and deferred assets and other latent losses are recognized as assessment of impairment to offset capital surplus, so as to achieve the purpose of inflated profits [4].
Due to the diversity of economic activities, many companies inflate their income by fictionalizing business credits in order to regulate their profits. Enterprises may also not account for amounts that are recouped but have been treated as bad debt losses, or write off amounts that can be recovered.
Measurement is based on historical cost, but assets can be impaired and require estimation by accountants. Estimates are subject to error, and accountants can use estimates to commit fraud [].
Understanding the motives for financial statement fraud helps to identify anomalies and fraud in a more timely and accurate manner, and the common motives are as follows:
Performance assessment indicators mainly include sales revenue, production value, return on investment, sales margin, asset turnover, sales revenue, total profit and total assets, etc., the calculation of which will use the data in the accounting statements.
In China, many enterprises may make creditors extend credit to them through accounting falsification when they are short of funds and cannot meet the credit conditions [6].
In order to meet the conditions for issuing shares and to issue shares at a higher price, companies often package their accounting statements when designing share reform programs. Many companies also whitewash their accounting statements when they increase their share allotments.
Reduce tax incentives, income tax amount is the accounting profit adjusted to taxable income and then multiplied by the income tax rate. In order to achieve the purpose of tax leakage, tax evasion, reduction or postponement of taxes, companies often whitewash their financial statements.
In recent years, creating good business performance of state-owned enterprises has become a political task for enterprise leaders. For the leaders of enterprises, accomplishing this task well may mean a bright future, or else the future may be dark. Some state-owned companies are likely to whitewash their accounting statements under political pressure [21,22].
The share price and borrowing capacity of an enterprise are largely determined by whether the profit level of the enterprise is stable or not, so in order to make the operating performance of the enterprise look stable, the management of the enterprise will whitewash the accounting statements.
Focusing on a shorter time period and companies in the same market can provide a higher quality model for detecting financial statement fraud. Therefore, considering the comparability between the data, this paper selects the A-share pharmaceutical manufacturing companies listed in China’s Shenzhen and Shanghai markets from 2016 to 2020 as the research object, and the remaining valid samples after eliminating the samples with missing values total 1,081 items [12,20]. The information of listed companies’ violation and punishment and related financial data are from Rexis database, and the violation and punishment information is from Cathay Pacific database [11].
According to the characteristic indicators that characterize financial statement fraud, Table 1 shows the definition of variables. In this paper, a total of eight fields, including inventory turnover \(X_{{\rm 1}}\), accounts receivable turnover \(X_{{\rm 2}}\), total asset turnover \(X_{{\rm 3}}\), working capital ratio \(X_{{\rm 4}}\), gearing ratio \(X_{{\rm 5}}\), return on net assets \(X_{{\rm 6}}\), net interest rate \(X_{{\rm 7}}\), and Z-value \(X_{{\rm 8}}\), are selected as variables for anomaly detection [15].
| Type of variable | Variable name | Symbolic | Explanation of variables |
| Operational capacity | Accounts Receivable Turnover Ratio | \(X_\rm 1 \) | Operating Income/Accounts Receivable Balance |
| Inventory turnover | \(X_\rm 2 \) | Operating Costs/Inventory Balance | |
| Total Assets Turnover | \(X_\rm 3 \) | Operating Cost/Total Assets | |
| Asset liquidity | Working Capital Ratio | \(X_\rm 4 \) | (Current Assets – Current Liabilities) / Total Assets |
| Solvency | Gearing ratio | \(X_\rm 5 \) | Total liabilities/total assets |
| Profitability | Return on net assets | \(X_\rm 6 \) | Net Profit/Net Assets |
| Net interest rate | \(X_\rm 7 \) | Net Profit / Operating Income | |
| Insolvency index | Z-score | \(X_\rm 8 \) | Z = 1.2 x net working capital/total assets + 1.4 x total retained earnings assets + 3.3 x EBITDA/total assets + 0.6 x (market value of preferred and common stock)/total liabilities + 0.99 x sales/total assets |
This paper adopts unsupervised learning method to construct the abnormal detection model of listed company’s financial statement fraud, based on multi-dimensional spatial clustering and calculating the distance between sample points and data clusters, and realizes the diagnosis of outliers and its cause analysis based on the judgment of distance. The analysis process includes three steps: clustering, anomaly measurement and anomaly diagnosis:
Based on the variables characterizing financial statement fraud defined in the previous section, a two-step clustering method is used to cluster the sample of 1109 public companies into several classes and find the center of each class [18]. For all data, the mean and variance of \(K^{A}\) numeric clustering variable \(k\) are computed \(\hat{\sigma }_{k}^{2}\). For each category, the sample size of class \(v\) is computed \(N_{v}\), the mean and variance of \(K^{A}\) numeric clustering variable \(k\) is computed \(\hat{\sigma }_{vk}^{2}\), and the sample size of \(K^{B}\) subtyped clustering variable \(l\)th category is computed \(N_{vkl}\).
On the basis of clustering, calculate the anomaly measures for all listed company samples. Find the class \(v\) to which the sample \(S\) points belong and calculate the log-likelihood distance between the sample points \(S\) and the class \(v\) called the group difference index. This index is denoted by \(GDI_{S}\) and its calculation formula can be expressed as: \[\label{GrindEQ__1_} GDI_{S} =d\left(v,s\right)=\varepsilon _{v} +\varepsilon _{s} -\varepsilon _{\left\langle v,s\right\rangle } =\varepsilon _{v} -\varepsilon _{\left\langle v,s\right\rangle } . \tag{1}\]
In the formula, \(d\left(v,s\right)\) denotes the log-likelihood distance between sample point \(S\) and category \(v\), \(\varepsilon _{v}\), \(\varepsilon _{s}\), and \(\varepsilon _{\left\langle v,s\right\rangle }\) denote the log-likelihood distance of category \(v\), the log-likelihood distance of sample \(S\), and the log-likelihood distance of samples \(v\) to \(S\), respectively. The formula for the log-likelihood distance for category \(v\) can be expressed as follows: \[\label{GrindEQ__2_} \varepsilon _{v} =-N_{v} \left(\sum\limits_{k=1}^{K^{A} }\frac{1}{2} ln\left(\hat{\sigma }_{k}^{2} +\hat{\sigma }_{vk}^{2} \right)+\sum\limits_{k=1}^{K^{B} }\hat{E}_{vk} \right) , \tag{2}\] where \(\hat{E}_{vk}\) denotes the rate of difference between the sample size of the calculated \(l\)nd category and the sample size of category \(v\), so that this rate of difference can be expressed by the formula: \[\label{GrindEQ__3_} \hat{E}_{vk} =-\sum\limits_{N_{v} }^{L_{k} }\frac{N_{vkl} }{N_{v} } ln\left(\frac{N_{vkl} }{N_{v} } \right) , \tag{3}\] where \(S\) is a sample point whose internal variation is 0, i.e., \(\varepsilon _{s} =0\). The group variance index reflects the incremental amount of variation within class \(v\) caused by the addition of sample point \(S\) to class \(v\).
Calculate the variable difference index for the clustered variable \(k\), which is denoted by \(VDI\). For numerical clustering variables, the variable difference index is defined as: \[\label{GrindEQ__4_} VDI_{k} =\frac{1}{2} ln\left(\hat{\sigma }_{k}^{2} +\hat{\sigma }_{vk}^{2} \right) . \tag{4}\]
For taxonomic clustering variables, the variable difference index is defined as: \[\label{GrindEQ__5_} VDI_{k} =-\sum\limits_{l=1}^{L_{k} }\frac{N_{vkl} }{N_{v} } ln\left(\frac{N_{vkl} }{N_{v} } \right) . \tag{5}\]
The Variable Difference Index is the difference between the individual additive parts of the sample point \(S\) after joining class \(v\) and before entering, \(GDI\) and reflects the magnitude of the contribution of each clustered variable in the incremental amount of difference within class \(v\) caused by the sample point \(S\) joining class \(v\).
Next, the anomaly index is calculated. For sample point \(S\), the calculation of the anomaly index can be expressed as \(AI\), which is calculated as: \[\label{GrindEQ__6_} AI=\frac{\frac{GDI_{S} }{1} }{N\sum\limits_{i=1}^{N_{v} }GDI_{i} } . \tag{6}\]
The outlier index is a relative indicator of the ratio of the within-class variance caused by sample point \(S\) to the mean of the variances caused by other sample points within class \(v\). The greater the value, the greater the certainty that sample point \(S\) is considered an outlier [8].
Samples of all listed companies are ranked according to the degree of abnormality to identify possible outliers and analyze the causes of financial anomalies. The anomaly index \(AI\) is sorted in descending order, and the listed companies in the first \(m\) positions are outliers, which may have financial statement fraud, and the anomaly index in the \(m\) position is the criterion for determining the outliers, and those larger than this value are outliers, and those smaller than this value are non-outliers. Meanwhile, for the outliers, the variable difference index \(VDI\) is ranked in descending order, and the variables in the first \(l\) positions are the main reasons for the possible financial anomalies of the listed company.
AE neural networks are specific types of forward multilayer neural networks that can be trained to reconstruct inputs. The difference between the original input and the reconstruction result is defined as the reconstruction error. Figure 1 shows the system framework of an AE neural network, which usually consists of two nonlinear mappings called encoder network \(l\) and decoder network \(g_{\theta }\). A symmetric encoder-decoder structure is usually used, which contains multilayer neurons, nonlinear functions, and a shared parameter \(\theta\). The system framework of an AE neural network is shown in Figure 1.
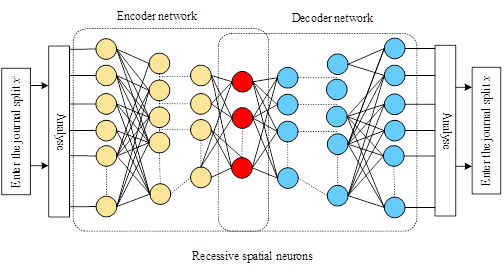
The encoder \(f_{\theta } \left(\cdot \right)\) maps the input vector \(X^{i}\) to a compressed representation \(Z\) in the implicit space \(Z\), and thereafter, the decoder \(g_{\theta } \left(\cdot \right)\) maps the implicit representation \(Z\) back to the reconstructed vector \(\hat{x}^{i}\) in the original input space, and the nonlinear encoder mapping of an AE containing multiple layers of neurons can be defined as: \[\label{GrindEQ__7_} f_{\theta }^{l} \left(\cdot \right)=\sigma ^{l} \left(W^{l} \left(f_{\theta }^{l-1} \left(\cdot \right)\right)+b^{l} \right) . \tag{7}\]
The decoder mapping can be defined as: \[\label{GrindEQ__8_} g_{\theta }^{l} \left(\cdot \right)=\sigma'{^{l}} \left(W'{^{l}} \left(f_{\theta }^{l-1} \left(\cdot \right)\right)+d^{l} \right), \tag{8}\] where \(\sigma\) and \(\sigma '\) are nonlinear activation functions, \(\theta\) denotes the model parameters \(\left\{W,b,W',d\right\},W\in R^{d_{x} \times d_{z} }\) and \(W'\in R^{d_{y} \times d_{z} }\) are weight matrices, \(b\in R^{d_{z} }\) and \(b'\in R^{d_{y} }\) are bias vectors, and \(l\) is the number of hidden layers. In this paper, we train the self-encoder neural network using a collection of financial statement information entries \(x^{i} =\left\{x_{1}^{i} ,x_{2}^{i} ,…,x_{k}^{i} \right\}\), each entry \(X^{i}\) contains an array of \(K\) attributes \(x^{i} =\left\{x_{1}^{i} ,x_{2}^{i} ,…,x_{k}^{i} \right\}\), \(x_{j}^{i}\) is the \(j\)th attribute of the \(i\)th entry. Attribute \(x^{j}\) contains account-specific details of the entry, such as bookkeeping type, bookkeeping time, amount, general ledger, etc. [10]. In addition, the order \(n_{j}^{i}\) represents the value \(X_{j}\) of a particular attribute, e.g., the number of occurrences of a particular voucher type.
Train the AE network to learn the optimal set of model parameters for the encoder-decoder \(\theta ^{*}\) that minimizes the difference between a given entry \(X^{i}\) and its reconstruction result \(\hat{x}^{i} =g_{\theta } \left(f_{\theta } \left(x^{i} \right)\right)\) to achieve \(\hat{x}^{i} =x^{i}\). Thus, the optimization objective of AE training for all bookkeeping entries is: \[\label{GrindEQ__9_} \arg min\left\| X-g_{\theta } \left(f_{\theta } \left(X^{i} \right)\right)\right\| . \tag{9}\]
In network training, the cross-entropy loss is utilized and the loss function \(L_{\theta }\) is defined as: \[\label{GrindEQ__10_} L_{\theta } \left(\hat{x}^{i} ;x^{i} \right)=\frac{1}{n} \sum\limits_{i=1}^{n}\sum\limits_{j=1}^{k}ln\left(x_{j}^{i} \right)+\left(1-x_{j}^{i} \right) ln\left(1-x_{j}^{i} \right) , \tag{10}\] where \(X^{i}\), \(i=1,…,n\) are the set of \(n\) accounting entries and \(\hat{x}^{i}\) is the reconstruction result on all accounting entry attributes \(j=1,…,k\). In this paper, \(x\) and \(\hat{x}\) are treated as two independent multivariate Bernoulli distributions using binary encoded attribute values, and the deviation between them is measured by \(L_{\theta } \left(x^{i} ;\hat{x}^{i} \right)\).
To prevent overfitting, the number of neurons in the hidden layer of the network is limited such that \(R^{d_{x} } R^{d_{z} }\), i.e., a bottleneck structure is used. By imposing this constraint in the hidden layer of the network, the AE learns the optimal set of parameters \(\theta ^{*}\) and obtains the most dominant compression model of the distribution of binned attribute values and their dependencies.
Based on the above analysis, a new anomaly scoring mechanism is proposed to check global and local anomalies in the actual accounting dataset. The proposed scoring mechanism takes into account two observational properties:
Any uncommon attribute value record that corresponds to a global anomaly.
Any uncommon attribute value co-occurring record corresponds to a localized anomaly. Characterizing the occurrence of unusual attribute values, in order to mine uncommon attribute values from observations, the probability of occurrence of each value \(X_{j}\) in all ledgers is first defined as \(n_{j}^{i} /N\) and \(N\) as the total number of financial statement information journal entries, e.g., the probability that a particular bookkeeping code will be entered in \(X\). In addition, the sum of log probabilities of individual attribute values on all \(j\) attributes is computed for each ledger \(X^{i}\): \[\label{GrindEQ__11_} P\left(x^{i} \right)\sum\limits_{j=1}^{k}ln\left(1+\frac{n_{j}^{i} }{N} \right) . \tag{11}\]
Finally, the normalized probability score \(AP\) is calculated for the attribute values: \[\label{GrindEQ__12_} AP\left(x^{i} \right)=\frac{P\left(x^{i} \right)-P_{min} }{P_{max} -P_{min} } . \tag{12}\]
Anomalous attribute-value combination occurrence characterization is to mine the attribute-value combinations of anomalous occurrences in observations and locate local anomalies, such as the probability of combining a specific general ledger account with a specific type of posting within all financial statement information journal entries \(X\), and derive the reconstruction error of the financial statement information journal entries through the training of deep AE neural networks. Anomalous co-occurrences are difficult to detect, and therefore difficult to reconstruct effectively in low-dimensional implicit representations, and can result in high reconstruction errors. For this reason, the reconstruction error \(E\) of the trained AE network under the optimal model parameters \(\theta ^{*}\) is derived for the financial statement information entries \(X^{i}\) and the corresponding reconstruction results \(\hat{x}^{i}\): \[\label{GrindEQ__13_} E_{\theta } \left(x^{i} ;\hat{x}^{i} \right)=\frac{1}{k} \sum\limits_{j=1}^{k}\left(x_{j}^{i} -x_{j}^{i} \right) ^{2} . \tag{13}\]
Finally, the normalized reconstruction error \(RE\) is computed as: \[\label{GrindEQ__14_} RE_{\theta } \left(x^{i} ;\hat{x}^{i} \right)=\frac{E_{\theta } \left(x^{i} ;\hat{x}^{i} \right)-E_{\theta ^{*} ,min} }{E_{\theta ^{*} ,max} -E_{\theta ^{*} ,min} } , \tag{14}\] where \(E_{min}\) and \(E_{min}\) denote the minimum and maximum values of the reconstruction error derived through \(E_{\theta ^{*} }\), respectively.
Accounting data anomaly scoring is based on attribute value occurrence characteristics and combination occurrence characteristics in individual entries, which can infer whether the entry is anomalous or not, and whether the creation of the entry originates from normal business activities. To detect global and local accounting anomaly data in the practice statistics task, for each entry \(X^{i}\), a score \(AS\) is computed \(X^{i}\) based on normalized attribute probabilities \(AP\) and reconstruction errors \(RE\) using the optimal model parameter \(\theta ^{*}\): \[\label{GrindEQ__15_} AS\left(x^{i} ;\hat{x}^{i} \right)=\alpha \times RE_{\theta ^{*} } \left(x^{i} ;x^{i} \right)+\left(1-\alpha \right)\times AP\left(x^{i} \right) , \tag{15}\] where \(\alpha\) is a balancing factor to balance the occurrence characteristics and combination of occurrence characteristics of attribute values. Based on the anomaly scoring, a threshold parameter \(\beta\) is defined, for each entry \(X^{i}\) under the optimal model parameter \(\theta ^{*}\). If the anomaly scoring AS exceeds the threshold \(\beta\), the financial statement information entry is marked as anomalous.
The evaluation metrics used in this study are accuracy, precision, recall, and F1 value formulas respectively: \[\label{GrindEQ__16_} precision{\rm =}\frac{TP}{TP{\rm +}FP} , \tag{16}\] \[\label{GrindEQ__17_} recall{\rm =}\frac{TP}{TP{\rm +}FN} , \tag{17}\] \[\label{GrindEQ__18_} F1{\rm =}\frac{{\rm 2}\cdot precision\cdot recall}{precision+recall} , \tag{18}\] where \(T\) is the number of correct predictions, \(N\) is the total number, \(TP\) is the number of positive predictions, \(FP\) is the number of negative predictions, and \(FN\) is the number of another negative prediction.
The classification experiments on data-driven and knowledge-driven models are conducted to compare the effectiveness of financial forgery recognition. Among them, the data-driven financial forgery recognition model is a typical binary classification problem, including the benchmark model represented by support vector machine, logistic regression and decision tree, and the cost-sensitive lightweight gradient boosting tree model incorporating cost-sensitive learning. Learning prediction is performed for a dataset consisting of 2,842 Chinese companies in 2015, and the ratio of normal samples to counterfeiting samples based on the financial counterfeiting labels on December 31, 2022 is 2,815:27. The training and testing sets are divided by 4:1 while maintaining the class distribution ratio, i.e., learning training is performed on 2,273 samples, of which 22 are counterfeiting companies, and 569 companies are for financial counterfeiting identification, of which 5 counterfeiting companies.
In order to select the most appropriate proportion of data set division and related algorithms, the different proportion of training and test sets are verified, and 60%-80% of the samples in the data set are usually selected as the training set in practical applications. , and logistic regression, support vector machine, decision tree, and deep neural network are used for classification prediction, and 70% of the samples in the relevant studies and others are selected as the training set.
In this paper, on the other hand, the three ratios of 8:2, 7:3, and 6:4 were selected for classification using logistic regression, support vector machine, decision tree, and deep neural network with default parameters, and the results of classification accuracy are shown in Table 2. The decision tree model has the worst classification effect, which classifies the samples with the three ratios of 8:2, 7:3, and 6:4, and the accuracy is the lowest among all the compared models, which are 70.6%, 65.0%, and 66.7%, respectively. The classification effect of the logistic regression model is relatively more satisfactory, and the model classifies samples with the ratios of 8:2, 7:3, and 6:4 with accuracies of 74.6%, 68.7%, and 72.0%, respectively. Among all the models, the model in this paper has the most satisfactory classification results. Classifying the samples with the three ratios of 8:2, 7:3, and 6:4, the accuracy rates are 91.7%, 90.3%, and 90.9%, respectively, which is the best classification effect.
| Model name | Proportion of sample division | Accuracy % |
| Logistic regression model | 8:2 | 74.6 |
| 7:3 | 68.7 | |
| 6:4 | 72.0 | |
| Support vector machine model | 8:2 | 71.8 |
| 7:3 | 66.4 | |
| 6:4 | 69.9 | |
| Decision tree model | 8:2 | 70.6 |
| 7:3 | 65.0 | |
| 6:4 | 66.7 | |
| Model of this paper | 8:2 | 91.7 |
| 7:3 | 90.3 | |
| 6:4 | 90.9 |
In order to verify the effectiveness of the prediction model in this paper, four models, namely, logistic regression, support vector machine, decision tree, and deep neural network, were used to predict and classify the fraud behaviors in the samples, and finally, the accuracy, the recall, and the F1 value were used as the final comparative analysis indexes, which were calculated through Eq. (16)-Eq. (18), and the evaluation indexes of different models were shown in Table 3. In terms of classification precision of all models, the model of this paper has the highest classification precision of 90.85%, followed by the support vector machine model of 83.68%, and the lowest precision is the decision tree model. In terms of recall, this paper’s model has the highest recall of 90.77%, while the lowest is the logistic regression model with only 76.22%. In terms of F1 value, this paper’s model has the highest F1 value of 90.81%, while the lowest F1 value is logistic regression model with only 78.48%. It can be seen that this paper’s model shows ideal results in terms of precision, recall and F1 value, while the LR model is the least suitable for the detection of anomalies in corporate financial statements and the identification of financial fraud, and the recall and the F1 value are the least ideal among all the models.
| Model name | Precision (%) | Recall (%) | F1 (%) |
| Logistic regression model | 80.87 | 76.22 | 78.48 |
| Support vector machine model | 83.68 | 77.46 | 80.45 |
| Decision tree model | 79.12 | 88.35 | 83.49 |
| Model of this paper | 90.85 | 90.77 | 90.81 |
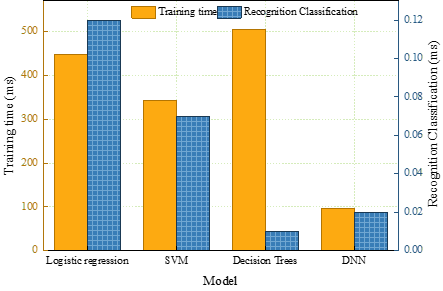
In order to verify the advantages of the models in this paper in terms of identification and classification time, four models, namely, logistic regression, support vector machine, decision tree, and deep neural network, are used for training, and four models are used to identify and classify the anomaly detection and financial fraud in the sample set. The model training time and identification and classification time are recorded for comparing the running time of the four models, and Figure 2 shows the training time and classification time of multiple models. The model with the highest training time is the decision tree model, which has a training time of 504.83 ms, but at the same time, the classification and identification time under this model is \(\mathrm{<}\)0.01 ms. Thus, there is a polarization between the training time and the identification and classification time, and the decision tree model is poorly trained with respect to the sample set. The model with the second highest training time is the logistic regression model, with a training time of 446.76ms, while the recognition and classification time is 0.12ms, which is not dominant in terms of training time and recognition and classification time. The sample set training time under the support vector machine model is 342.39ms and the recognition and classification time is 0.07ms, while the model in this paper takes the least time to train the sample set as well as to recognize and classify the sample set, the training time is 95.81m and the recognition and classification time is only 0.02ms. The model in this paper has good performance in terms of the training time and the recognition and classification time, which is the best performance.
Under the background of big data, this paper brings deep neural network into financial statement abnormality recognition and classification, and solves the problem of low efficiency of financial statement abnormality recognition and classification through the advantage of deep neural network. The effectiveness of this paper’s model is discussed from three aspects: analysis of classification accuracy, analysis of rating indexes, and analysis of time spent on recognition and classification. The results show that this paper’s model classifies samples with 8:2, 7:3, and 6:4 ratios with accuracies of 91.7%, 90.3%, and 90.9%, respectively, and the precision, recall, and F1 value of the recognition and classification are the highest among the compared models. The time taken to train the sample set and to recognize and classify the samples is 95.81m and 0.02ms respectively, which is the most ideal among all models. The deep neural network based accounting data anomaly detection method can effectively reduce the auditor’s workload and reduce the risk of financial statement fraud.