
In today’s fast-changing business environment, an enterprise’s ability to sustain growth and innovation has become a key factor in determining its market competitiveness [15,25]. Enterprise performance is not only related to the survival and development of enterprises, but also an important indicator of their market competitiveness [13]. Innovative behavior, as the process of employees proposing and implementing new ideas, methods, or solutions in their work, is an important source for enterprises to achieve continuous innovation [23,20]. Employee satisfaction, as an important indicator of an enterprise’s internal environment, not only directly affects employees’ motivation, creativity, and work efficiency, but also indirectly plays a role in an enterprise’s overall performance and innovative behavior [1]. Therefore, an in-depth exploration of how employee satisfaction regulates the relationship between enterprise performance and innovative behavior is of great significance in guiding enterprises to implement effective human resource management strategies and promoting long-term stable development of enterprises.
Deep learning, as an advanced machine learning technology, has achieved remarkable application results in various fields in recent years. By constructing a deep learning model, the potential connection between employee satisfaction, enterprise performance and innovative behavior can be explored more deeply, revealing its intrinsic regulating mechanism [5,4]. This study aims to utilize the relevant principles and algorithms of deep learning to innovatively construct a hybrid deep learning structure by combining the advantages of not Autoencoder and RBM, which will be empirically analyzed to validate the impact of employee satisfaction on innovative behavior and the driving effect of innovative behavior on corporate performance, and further analyze the mediating effect of innovative behavior in this relationship. This study is expected to provide new perspectives and evidence for understanding the complex relationship between employee satisfaction, innovative behavior and enterprise performance, and provide theoretical support and practical guidance for enterprises to improve performance and promote innovation.
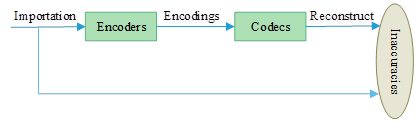
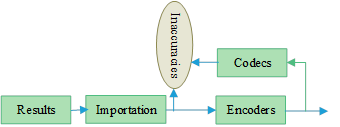
This paper first selected all A-shares in Shanghai and Shenzhen from 2015 to 2023 as research samples, excluding data of financial industry, *ST, PT type companies, companies listed after January 1, 2009, and companies with a large number of missing data, and finally obtained 1582 companies with a total of 19630 valid annual data. After determining the data set, the following introduces the relevant deep learning model. Autoencoder can extract key features from input data and reconstruct input data through unsupervised learning, which helps to deeply understand the complex factors behind employee satisfaction. As a probabilistic generation model, RBM can not only learn the representation of input data, but also generate new samples, providing a new perspective for analyzing the potential relationship between employee satisfaction and corporate performance. Figure 1 shows the Auto Encoder based on deep learning. The deep learning network layer. Figure 1(a) shows single-layer training. The original data is obtained by the Encoder. Then the result obtained by encoding is input into the Decoder. In this way, the various structures of the original input are obtained in turn. The first layer can be trained by comparing the errors obtained from the original numbers [8,10]. The joint diagram is shown in Figure 1(b). The output of the encoder part can be obtained. Next, this compressed representation is used as the input of the second layer of the auto encoder and trained. In this way, a deep auto encoder can be constructed and trained layer by layer [3,17].
RBM is an energy-based model consisting of visible layers and hidden layers [3,17]. In the visible layer, employee satisfaction, corporate performance, and innovation behavior can be set as input nodes. The RBM model is trained using the collected data. During the training process, the model learns the potential structure and features in the data, as well as the relationship between variables.
For a Boltzmann machine containing a visible layer cell and a hidden layer cell, assuming \(v\in \{ 0,1\}\) is the state vector of the visible layer cell and \(h\in \{ 0,1\}\) is the state vector of the hidden layer unit, its energy function is usually defined as: \[\label{GrindEQ__1_} E(v,h;\theta )=-\sum _{ij}W_{ij} v_{i} h_{j} -\sum _{i}b_{i} v_{i} -\sum _{j}a_{j} h_{j}. \tag{1}\]
Among them, \(\theta =\{ \vec{a},\vec{b},\vec{W}\}\) is the model parameter, The joint distribution of cells: \[\label{GrindEQ__2_} P(v,h;\theta )=\frac{1}{Z(\theta )} \exp (-E(v,h;\theta )) , \tag{2}\] where \(E(v,h;\theta )\) is an energy function that depends on the model parameters and the states of the visible and hidden layer cells, \(Z(\theta )=\sum _{v,h}\exp (-E(v,h;\theta ))\) and is a partition function. The partition function is a normalization constant that ensures that the probability of the joint distribution sums to 1.
The conditional probability distribution of the hidden layer can be calculated when the visible layer state is known [21,19]. The probability\(P(hv)=\prod _{j}P \left(h_{j} v\right)\)refers to the probability that the hidden unit is activated under the given visible layer state v and model parameters \(\theta\) [2]. \[\label{GrindEQ__3_} P\left(h_{j} =1v;\theta \right)=\sigma \left(a_{j} +\sum _{i}W_{ij} v_{i} \right)=\frac{1}{1+\exp \left(-a_{j} -\sum _{i}W_{ij} v_{i} \right)} , \tag{3}\] where \(\sigma (x)\) is the sigmoid function. Since the connection between the visible and hidden layers is bidirectional and has the same weight, the conditional probability of the visible layer can be computed with the state of the hidden layer known: \[\label{GrindEQ__4_} P(vh)=\prod _{i}P \left(v_{i} h\right) , \tag{4}\]
The conditional probability here is the probability that the visual layer unit \(v_{i}\) is activated, i.e., the state is 1, given the hidden layer state \(h\) and the model parameter \(\theta\). When the state of the hidden layer is known, the conditional probability of each visual unit can be calculated independently, and the probability of the corresponding visual unit is: \[\label{GrindEQ__5_} P\left(v_{i} =1h;\theta \right)=\sigma \left(b_{i} +\sum _{j}W_{ij} h_{j} \right)=\frac{1}{1+\exp \left(-b_{i} -\sum _{j}W_{ij} h_{j} \right)} . \tag{5}\]
The above RBM model can be used to construct an analytical model to explore the relationship between employee satisfaction and corporate performance and innovative behavior. and two strategies, cross-hybridization and sequential hybridization, are adopted. Sparsity restriction and dropout methods are introduced to improve model performance. In terms of model parameter training and tuning, the stochastic gradient descent method is used to adjust the parameters of the Autoencoder model [9].
Park et al. pointed out the importance of employee satisfaction and corporate innovation performance in today’s highly competitive market environment. It may emphasize that employees are the core driving force of corporate innovation, and employee satisfaction is the key factor affecting employees’ willingness and ability to innovate. When employees are satisfied, they can show innovative behaviors and attitudes, bring more innovative results to the company, and promote the company’s innovation process [14]. Ok, DI studied the relationship between industry conflict management behavior, job satisfaction and innovation performance, and found that when employees are satisfied with their work content and work environment, they show innovative behavior. When employees are satisfied with the communication and interaction at work, it will also promote their innovative behavior [18]. This paper proposes the following assumptions:
Employee satisfaction has a significant positive effect on innovative behavior.
There is a significant positive effect of job satisfaction on innovative behavior.
There is a significant positive effect of communication satisfaction on innovative behavior.
Gao, Q and others have deeply explored the close connection between entrepreneurs’ psychological capital, innovative behavior and corporate performance. It clearly points out the role of entrepreneurial innovative behavior and the key role of innovative behavior in improving corporate performance. indicating that corporate innovation efforts can directly translate into better performance. Project performance focuses on the completion of specific projects, and innovative behaviors can often bring about more efficient working methods and better solutions, thereby improving the efficiency and quality of project completion. Teamwork performance involves the quality of a firm’s interactions with external entities. Innovative behavior is not limited to the product or service itself, but also includes innovative measures taken by enterprises when establishing and maintaining relationships with external entities, such as innovative management of customer relationships, innovative cooperation in supply chains, etc., which all help to improve teamwork performance [6]. Xue, Y. discussed how design thinking can promote the improvement of enterprises’ sustainable innovation capabilities and team performance. Design thinking emphasizes innovative thinking, and its core lies in innovation. Therefore, innovative behavior itself has a direct and significant impact on corporate performance. By adopting innovative methods, introducing new technologies or optimizing processes and other innovative behaviors, the speed and quality of project completion can be effectively improved, thereby directly improving project performance [24]. Based on the research of the above-mentioned researchers. This paper proposes the following assumptions:
There is a significant positive effect of innovative behavior on enterprise performance.
There is a significant positive effect of innovative behavior on task performance.
There is a significant positive effect of innovative behavior on relationship performance.
Merín-Rodrigáñez, J and other researchers focused on exploring the relationship between digital transformation and the performance of innovative SMEs, with a special emphasis on the mediating role of business model innovation in this relationship. The results of the study show that digital transformation has a positive impact on the performance of innovative SMEs and that this impact is transmitted through business model innovation. First, the article emphasizes the positive impact of innovation, embodied in the text as business model innovation, on firm performance. Secondly, digital transformation is seen as an important factor driving this innovation. Therefore, it is reasonable to hypothesize that in a business environment that actively promotes digital transformation and innovation, employee satisfaction may feel increased as a result of participating in the innovation process and witnessing business growth and change. Combining these two points, it can be argued that innovative behaviors mediate the relationship between employee satisfaction and firm performance [11]. Rosdaniati, R and Muafi, M explored the impact of workplace well-being, innovative work behaviors on job satisfaction, Innovative work behaviors play an important mediating role between workplace well-being and job satisfaction. Innovative behaviors not only enhance employees’ job satisfaction, but also promote organizational innovation and development. An organizational culture that encourages innovation can stimulate employees’ creativity, make them more engaged in their work, and generate higher job satisfaction [16]. Based on the above research scholars, this paper proposes the following hypotheses:
Innovative behavior plays a mediating role in the relationship between employee satisfaction and firm performance.
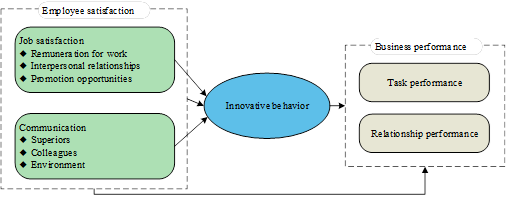
Employee satisfaction moderates the relationship between firm performance and innovative behavior as shown in Figure 2. Scholars such as Mustafa, M found a significant relationship between employee satisfaction and innovative behavior, which is moderated by the employee’s personal residences, such as personality traits. The personal attributes of employees, such as personality traits, moderated this relationship. Employee satisfaction, innovative behavior and firm performance are differentiated on the basis of individual employees [12]. He, X and Dikamona, S. C. K explored the effect of pay satisfaction on innovative behavior and pointed out the role of self-efficacy and organizational commitment in this process the role of self-efficacy and organizational commitment in this process. It can be inferred that employees with different personal attributes may exhibit different patterns and intensities of pay satisfaction, innovative behavior, and the impact of these behaviors on firm performance. For example, personal attributes such as gender and age may affect employees’ expectations and satisfaction with pay, which in turn affects he employees’ willingness to innovate and their behavior. Employees’ innovative behavior may also be influenced by personal attributes. Employees with high self-efficacy may be more inclined to exhibit innovative behavior because employees are more confident in their ability to solve problems. Conversely, employees with low self-efficacy may be more reluctant to try new approaches or come up with new ideas. At the same time, these personal attributes may also influence how and to what extent employees contribute to firm performance [7]. Based on the above research scholars, this paper proposes the following hypotheses:
Employee satisfaction, innovative behavior and firm performance are differentiated in terms of employees’ personal attributes.
This paper sorts out the relevant literature on employee satisfaction, innovative behavior, corporate performance and their impact. Based on a certain theoretical foundation, it adopts a quantitative research method and conducts correlation analysis and regression analysis on the collected valid data one by one through SPSS21.0 statistical software.
This article conducts a correlation analysis on the three dimensions of communication satisfaction, the three dimensions of job satisfaction, The correlation analysis is shown in Table 1. The relationship between employee satisfaction with work and the frequency of innovative work, and the numerical relationship between the two has been confirmed at the 0.01 significance level, and the specific value reaches 0.460, showing a close connection. This means that when employees have higher job satisfaction, they display more innovative behaviors at work. In addition, the Pearson correlation coefficient between innovative behavior and corporate performance is 0.348, which is also significantly related at the 0.01 level, Through the observation and analysis of 358 samples, it was found that there is an overall correlation between employee satisfaction, innovative behavior and corporate performance.
| Norm | Employee Satisfaction | Innovative behavior | Corporate Performance | |
| Employee Satisfaction | Pearson correlation | 1 | .460** | .467* |
| Significance (bilateral) | – | .000 | .000 | |
| N | 358 | 358 | 358 | |
| Innovative behavior | Pearson correlation | .460** | 1 | .348** |
| Significance (bilateral) | .000 | – | .000 | |
| N | 358 | 358 | 358 | |
| Corporate Performance | Pearson correlation | .457** | .348** | 1 |
| Significance (bilateral) | .000 | .000 | – | |
| N | 358 | 358 | 358 | |
Table 2 shows the regression analysis of employee satisfaction on innovative behavior. The regression results show that when innovative behavior is used as the response variable, in the regression model of employee job satisfaction, the unstandardized coefficient is 1.174 and the t value is 8.801, supporting hypothesis H1. When further exploring its sub-dimensions, it was found that in the regression model of employee job satisfaction, the t value was 8.365, revealing the significant effect of work-level evaluation on innovative behavior. In addition, the impact of employee communication evaluation indicators on innovative behavior cannot be ignored. Its t-test value reached 6.147, and the regression results of communication satisfaction also showed a significant relationship. These data results show that both overall employee satisfaction and its subdivided job satisfaction and communication satisfaction have a significant relationship with innovative behavior. The results of the regression analysis confirmed hypothesis H1 and its sub-hypotheses H1a and H1b.
| Satisfaction | Independent variable | Non-standardized coefficient | Factor | t | Sig. | R\({}^{2}\) | F | |
| B | Error | |||||||
| Employee | Employee Satisfaction | 1.174 | .261 | – | 10.258 | 0 | – | – |
| .2689 | .073 | .422 | 8.801 | 0 | .208 | 74.147 | ||
| Job | Innovative behavior | 2.358 | .241 | – | 11.204 | 0 | – | – |
| .456 | .065 | .306 | 8.365 | 0 | .115 | 36.205 | ||
| Communication | Corporate Performance | 2.665 | .179 | – | 5.214 | 0 | – | – |
| .334 | .058 | .524 | 6.147 | 0 | .109 | 48.324 | ||
With innovative behavior as the independent variable and the two dimensions of enterprise performance and its task performance and task performance as the dependent variable respectively, the results of linear regression test are shown in Table 3, which shows that the effect of innovative behavior on different performance indicators can be observed. Overall, innovative behavior has a significant impact on the overall performance index. Its t-test value reaches 6.584, and the significance level is extremely low, 0.000, Hypothesis H 2 is supported. Further detailed analysis shows also has a significant impact on project- level performance indicators, with a t-value of 3.524 and a significance level of 0.000, revealing the significant effect of innovative behavior on project -level performance and supporting hypothesis H2a. At the same time, on the performance of teamwork level, the impact of innovative behavior is more significant, with its t-test value reaching 7.638. The data clearly reveal that innovative behavior has a significant impact at different levels, both overall and specifically on project completion and teamwork management. With a t-test value as high as 7.638 and this impact is statistically highly significant, indicating the significant effect of innovative behavior on relationship-level performance and supporting hypothesis H2b. The results of the regression analysis show that innovative behavior has a significant positive impact on corporate performance and its two dimensions, and this impact is statistically significant.
| Satisfaction | Independent variable | Non-standardized coefficient | Factor | t | Sig. | R\({}^{2}\) | F | |
| B | Error | |||||||
| Employee | Employee Satisfaction | 3.011 | .184 | / | 22.385 | .000 | / | / |
| .258 | .035 | .654 | 6.584 | .000 | .115 | 37.365 | ||
| Job | Innovative behavior | 3.247 | .169 | / | 17.982 | .000 | / | / |
| .188 | .041 | .239 | 3.524 | .000 | .047 | 14.208 | ||
| Communication | Corporate Performance | 2.547 | .146 | / | 18.524 | .000 | / | / |
| .369 | .042 | .417 | 7.638 | .000 | .126 | 55.395 | ||
Employee Satisfaction on Business Performance As shown in Table 4, the Beta test coefficient of Employee Satisfaction on Business Performance is 0.652, the Sig. value is 0.000, which is less than the 0.01 level, the F-value is 90.354, and the Adjusted R2 is 0.289, with a t-value of 8.309, the relationship between the two is positively correlated. In addition, the adjusted R2 of the model is 0.289, which indicates that employee satisfaction explains 28.9% of the variance in firm performance and the model fit is good. Finally, the F-value of 90.354 also further confirms the significance and explanatory power of the regression model. In summary, the results of this regression analysis indicate that employee satisfaction has a significant positive effect on firm performance.
| Model | Non-standardized coefficient | Factor | t | Sig. | R\({}^{2}\) | F | |
| B | Error | ||||||
| Employee Satisfaction | 2.0956 | .209 | – | 10.552 | .000 | – | – |
| .652 | .069 | .488 | 8.309 | .000 | .289 | 90.354 | |
Table 5 shows the regression results of the mediating effect of innovative behavior. X is employee satisfaction with work, Y is the overall performance of the company, and M is innovative behavior. The influence relationships and their significance under different paths can be observed. First, the direct effect X\(\mathrm{\to}\)Y direct path shows a significant effect, which shows that. Secondly, the effect of X\(\mathrm{\to}\)M is also significant, with a coefficient of 0.25 and a p value of less than 0.001, revealing that X can significantly affect M. Furthermore, the effect of M on Y is also significant, with a coefficient of 0.4 0. M can significantly affect Y, and innovative behavior can significantly affect corporate results. Finally, the indirect effect of the results of the analysis supports the H3 hypothesis.
| X \(\mathrm{\to}\) Y (direct effect) | Coefficient (B) | (SE) | t | p | 95% confidence interval |
| X \(\mathrm{\to}\) M | 0.50 | 0.05 | 10.00 | \(\mathrm{<}\)0.001 | [0.40,0.60] |
| M \(\mathrm{\to}\) Y | 0.25 | 0.03 | 8.33 | \(\mathrm{<}\)0.001 | [0.19,0.31] |
| X \(\mathrm{\to}\) Y (indirect effect via M) | 0.40 | 0.06 | 6.67 | \(\mathrm{<}\)0.001 | [0.28,0.52] |
| X \(\mathrm{\to}\) Y (direct effect) | 0.10 | 0.02 | 5.00 | \(\mathrm{<}\)0.001 | [0.06,0.14] |
Employee satisfaction with job, innovative behavior and employee attributes, age and gender as independent variables and overall performance as dependent variable were analyzed using linear regression, and the regression analysis of employee satisfaction, innovative behavior on firm performance is shown in Table 6.
The standardized coefficient is 1.963 and the t-value is 10.961, indicating that the constant part has significant explanatory power on employee performance when controlling other variables. Employee job satisfaction also shows a significant positive impact on employee performance with a t value of 7.458, indicating that for every unit increase in employee job satisfaction, employee performance will increase by an average of 0.458 units. In addition, the age in employee attributes also has a certain impact on overall performance. The standard coefficient is 0.087, the t value is 2.100, and the Sig. value is 0.036, indicating that the age of employee attributes has a significant positive impact on overall performance. The standard coefficient of gender in employee attributes on overall performance is -0.121, and the t value is -3.290. There are indeed differences in employees’ personal attributes satisfaction, innovative behavior and overall performance. It shows that employees of different ages and genders have differences in employee job satisfaction, innovative behavior and overall performance, thus supporting the H4 hypothesis.
| Model | Coefficient | Factor | t | Sig. | R\(^2\) | F | |
| B | Error | ||||||
| Constants | 1.963 | .199 | – | 10.961 | .000 | – | – |
| Employee Satisfaction | .458 | .056 | .469 | 7.458 | .000 | – | – |
| Innovative Behavior | 0185 | 041 | .188 | 3.058 | .004 | 0239 | 51.256 |
| Employee Attribute Age | 0.021 | 0.005 | 0.087 | 2.100 | 0.036 | – | – |
| Employee Attribute Gender | -0.204 | 0.062 | -0.121 | -3.290 | 0.001 | – | – |
In this paper, we will construct a hybrid deep learning model of Autoencoder and RBM to comprehensively analyze this complex relationship. The moderating effect of employee satisfaction on the relationship between corporate performance and innovative behavior Employee satisfaction on innovative behavior is empirically examined through methods such as correlation analysis and regression analysis. The research results are as follows:
Employee satisfaction and innovative behavior Pearson correlation coefficient is 0.460, and the two-sided significance level is 0.000. this indicates that the higher the employee satisfaction, the more innovative behavior.
There is a significant positive correlation between innovative behavior and enterprise performance, with a two-sided significance level of 0.000, and the standardized coefficient of innovative behavior on enterprise performance is 0.654, which indicates that innovative behavior has a significant positive impact on enterprise performance.
The unstandardized coefficient of employee satisfaction on enterprise performance is 0.458, the t-value is 7.458, the Sig. value is 0.000, and the unstandardized coefficient of innovative behavior on enterprise performance is 0.185, the t-value is 3.058, and the Sig. value is 0.004. Adjusted R² is 0.239, which indicates that the employee satisfaction and innovative behavior can explain 23.9% of the variation of enterprise performance. 23.9% and the model fit is good.
Employee age and gender also have a significant effect on enterprise performance, B=0.021, t=2.100, Sig.=0.036 in Employee age and enterprise performance, while B=-0.204, t=-3.290, Sig.=0.001 in Gender and enterprise performance, indicating that female employees perform better in enterprise performance compared to male employees.
This study confirms the positive relationship between employee satisfaction, innovative behavior and firm performance and reveals the mediating role of innovative behavior in the impact of employee satisfaction on firm performance. Also, the study found that there is a differential effect of employees’ personal attributes on these relationships.