
In the new era, five types of education are being promoted together: moral education as the foundation, intellectual education as a priority, physical education as a necessity, aesthetic education as essential, and labor education as fundamental. Early childhood is a critical period for the overall development of human beings. To build a high-quality education development system, it is necessary to start from early childhood [11].
Find the right breakthrough and promote education in a concerted manner
The Kindergarten Work Regulations state that moral education is the first priority in building a kindergarten brand image. Teachers should therefore focus on moral education as the breakthrough point in teaching activities, ensuring that the main thread of moral education is emphasized and guiding children’s development through socialist core values [15]. Activities should integrate moral education, respect the developmental law of young children, and cultivate the new generation with socialist ideals. Teachers should design activities with clear goals, using games as the fundamental activity form to allow children to learn through play and exploration. Education should permeate all aspects of activities, achieving integration among cultural, practical, and collaborative education, and ensuring holistic development [3,7].
Advocate integration and address separation issues
Kindergarten brand image and teaching should not only follow overall nurturing guidelines but also resolve the separation between the two. Teachers should coordinate resources, enhance integration teaching abilities, and design comprehensive activities. Instead of single-form activities, an integrated approach should take one type of education as the main focus, with others as complements, to achieve multidimensional education goals. This provides children with practical opportunities and ensures the complementarity of various educational components [4,13].
Make precise efforts to address shortcomings in education
Poor moral education is harmful, poor intellectual education is inferior, poor physical education is wasteful, poor aesthetic education is lacking in depth, and poor labor education is ineffective [1]. To address this, a balanced approach is needed to ensure that all five types of education progress together. Teachers should identify weaknesses in each area, design activities to compensate for missing components, and focus on cultivating children’s problem-solving abilities. Labor education, often neglected or substituted, should be emphasized, with suitable labor activities that respect children’s autonomy. The goal is to equally value all aspects of education, promoting the holistic development of children while highlighting individuality and fostering growth [12,6,9].
Address both symptoms and root causes
Early childhood is a critical period for lifelong development. However, issues persist in education, requiring steady and systemic efforts. The government should lead by promoting curriculum construction, increasing investment, and conducting regular inspections and evaluations to rectify imbalances among the five types of education. Kindergartens should develop characteristic curricula, improve teacher quality, and foster a culture of high-quality education. Teachers must understand the comprehensive education goals of kindergarten brand image, clarify relationships among educational components, and refine cultivation requirements for young children [8].
As an integral part of basic education, the kindergarten brand image plays an irreplaceable role. It requires significant investment and effort to achieve its goals and fulfill its task of educating children. Integrating concepts into kindergarten brand image and teaching is a vital channel for achieving comprehensive education.
Kindergarten brand image evaluation, as defined in the Evaluation of Preschool Education, assesses the value of education and the extent to which it meets educational objectives. For instance, children aged five or six often exhibit a strong interest in reading picture books, reflecting their developmental needs. Evaluating whether kindergartens and families meet these needs is a key aspect of judging educational effectiveness. Narrowly defined, kindergarten brand image evaluation measures the value and scope of kindergarten brand image in specific areas [14].
By evaluating the quality of kindergarten brand image, educators can determine whether kindergartens meet the physical and mental growth needs of young children. The history of preschool education indicates the integration of education and care as a fundamental direction for young children’s development. Kindergarten brand image evaluation reflects educational levels and concepts while providing feedback for improvement. This ensures the alignment of preschool education with modern educational goals [10,2].
The evaluation of kindergarten brand image quality in China is gradually gaining attention, with ongoing development and refinement of evaluation tools [5]. Examples include interviews about the general condition of kindergartens and observations on teacher arrangements.
In general, the evaluation of kindergarten brand image quality in China focuses heavily on environmental conditions, hardware facilities, teacher capabilities, and healthcare provisions. However, with societal and educational development, evaluation criteria should prioritize the content and quality of kindergarten brand image activities implemented in kindergartens.
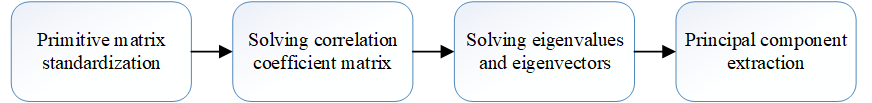
The main idea of Principal Component Analysis (PCA) is to transform correlated indicators into a set of new, independent comprehensive indicators through linear transformation, while retaining as much information from the original data set as possible. PCA is primarily used for dimensionality reduction. The basic process is illustrated in Figure 1.
Assuming the ECE impact indicators are \(P\)-dimensional random variables \(X = ({X_1}, {X_2}, …, {X_p})^T\), and there are \(n\) ECE research samples (\(n > p\)), the original matrix is transformed and standardized using the following equations:
\[\label{e1} \overline{x_j} = \frac{\sum_{i=1}^n x_{ij}}{n}, \quad s_j^2 = \frac{\sum_{i=1}^n (x_{ij} – \overline{x_j})^2}{n-1}. \tag{1}\]
The correlation coefficient \(R_{ij}\) between variables is calculated as:
\[\label{e2} \begin{aligned} R_{ij} = \frac{\operatorname{cov}(Z_i, Z_j)}{s_i^* s_j} = \frac{E[(z_{ji} – \overline{z}_i) \cdot (z_{ij} – \overline{z}_j)]}{s_i^* s_j}. \end{aligned} \tag{2}\]
The eigenvalues \(\lambda_1, \lambda_2, …, \lambda_p\) are obtained by solving the characteristic equation:
\[\label{e3} |R – \lambda I_p| = 0. \tag{3}\]
The number of principal components \(m\) is determined such that the cumulative contribution rate satisfies:
\[\frac{\sum_{i=1}^m \lambda_i}{P} \geq 0.90.\]
The eigenvectors corresponding to the eigenvalues are obtained by solving:
\[R \cdot b = \lambda b.\]
The principal components are extracted, and the \(m\)-th principal components are evaluated as:
\[\label{e4} C_{ij} = Z_i \cdot b_j^T \quad (j = 1, 2, …, m), \tag{4}\] where \(C_1\) is the first principal component, \(C_2\) is the second principal component, and \(C_m\) is the \(m\)-th principal component.
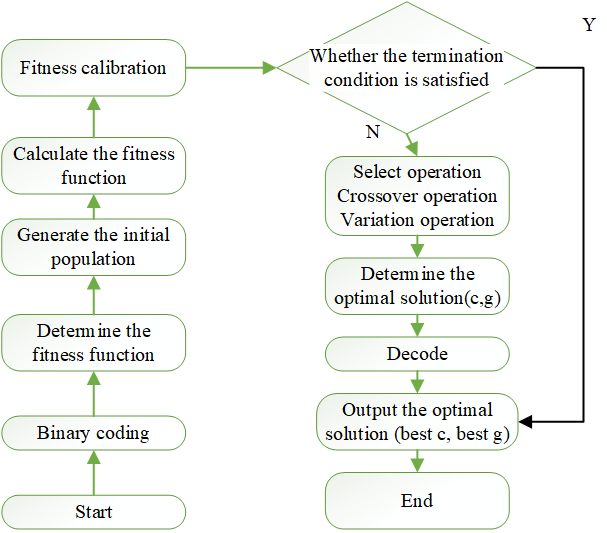
Genetic Algorithm (GA) is inspired by natural evolution, offering strong global optimization and search capabilities. GA optimizes support vector machine (SVM) parameters as follows:
– Encode the initial SVM parameters to construct the first generation population.
– Calculate fitness by determining the error. Larger errors correspond to smaller fitness.
– Inherit high-fitness individuals to the next generation and apply genetic operations (e.g., crossover, mutation).
– Repeat until the parameters meet conditions or reach the maximum iteration limit.
The GA procedure for SVM parameter optimization is illustrated in Figure 2.
SVM is a machine learning method for small samples, with the linear regression function in high-dimensional space expressed as:
\[\label{e5} y_i = W \cdot \phi(X_i) + b, \tag{5}\] where \(\phi(X_i)\) represents the nonlinear mapping of sample data. The optimal solutions \(W\) and \(b\) are obtained by solving:
\[\label{e6} \min_{w,b,\xi^*} \frac{1}{2} W^T W + C \sum_{i=1}^m (\xi_i + \xi_i^*). \tag{6}\]
Here, \(C\) is the penalty parameter that controls SVM classification error tolerance. The quadratic programming problem is transformed into a dual problem:
\[\label{e7} L(w, b, \xi, \xi^*, a, a^*, r, r^\cdot) = \frac{1}{2} w^T w + C \sum_{i=1}^m (\xi_i + \xi_i^*) – \sum_{i=1}^m r_i. \tag{7}\]
The SVM model is expressed as:
\[\label{e8} f(X) = \sum_{i=1}^m (a_i^* – a_i) \phi(X_i)^T \phi(X) + b. \tag{8}\]
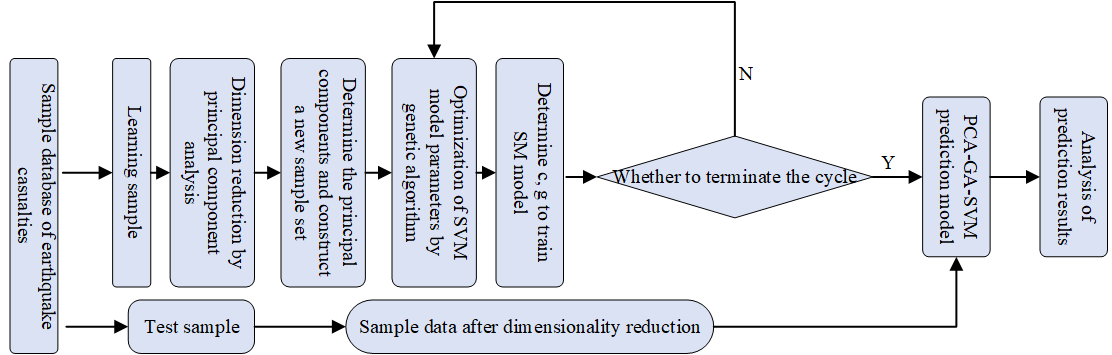
The kindergarten brand image quality evaluation model combines PCA and GA-SVM. The process is shown in Figure 3.
The variance contribution rates of the principal components are provided in Table 1.
| PCs | Eigenvalue | Contribution Rate (%) | Cumulative Contribution Rate (%) |
| PC\(_1\) | 2.6158 | 43.61 | 43.61 |
| PC\(_2\) | 1.3770 | 22.94 | 66.54 |
| PC\(_3\) | 1.2059 | 20.11 | 86.65 |
| PC\(_4\) | 0.7038 | 11.72 | 98.37 |
| PC\(_5\) | 0.0728 | 1.21 | 99.58 |
| PC\(_6\) | 0.0247 | 0.42 | 100.00 |
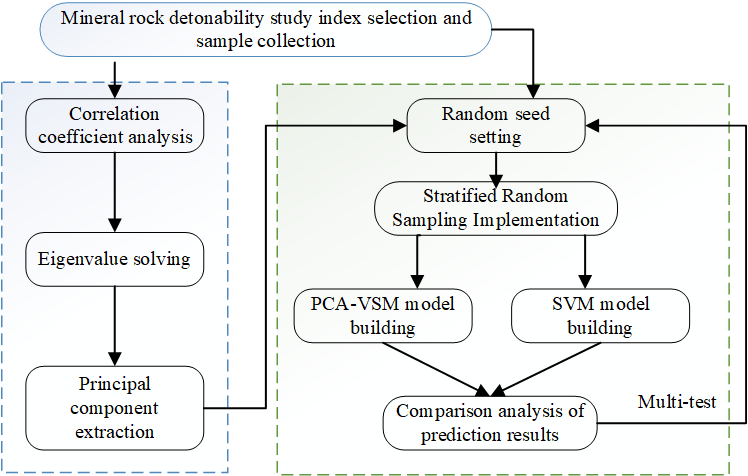
The flow of the kindergarten brand image evaluation model is illustrated in Figure 4.
Since the rate of change of the evolutionary curve and the initial best fitness values differ significantly, the evolutionary curve is presented using the natural logarithm of the fitness value. When the fitness value reaches zero as the algorithm iterates, the curve converges and no further updates are made.
Figure 5 shows the evolution curves of the PCA-SVM algorithm, PCA algorithm, and SVM algorithm for Sphere function optimization. From Figure 5, the evolution curves of PCA-SVM and PCA algorithms show noticeable changes in the early iterations, while the SVM algorithm converges slowly, often falling into local minima. Additionally, the convergence accuracy of the PCA-SVM algorithm is the highest.
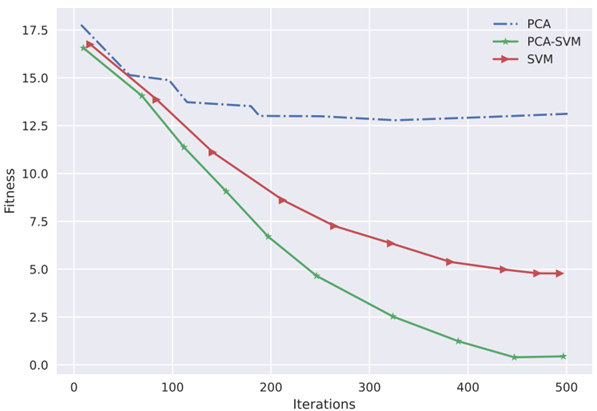
Table 2 summarizes the best, average, and worst fitness values for the Sphere function obtained from 10 tests of each algorithm. The PCA-SVM algorithm achieves better performance in all metrics compared to the PCA and SVM algorithms, demonstrating superior search ability and stability.
| Sphere Function | PCA-SVM | SVM | PCA |
| Best | 4.6952e-42 | 8.8167e-09 | 2.3092e-30 |
| Average | 2.6633e-43 | 0.8570e-08 | 4.5242e-31 |
| Worst | 5.9506e-43 | 0.8368e-07 | 3.9744e-30 |
Figure 6 illustrates the evolution curves for the PCA-SVM, PCA, and SVM algorithms in optimizing the Ackley function. From Figure 6, it is evident that the PCA-SVM and PCA algorithms converge faster compared to the SVM algorithm. Additionally, the PCA-SVM algorithm achieves the highest convergence accuracy.
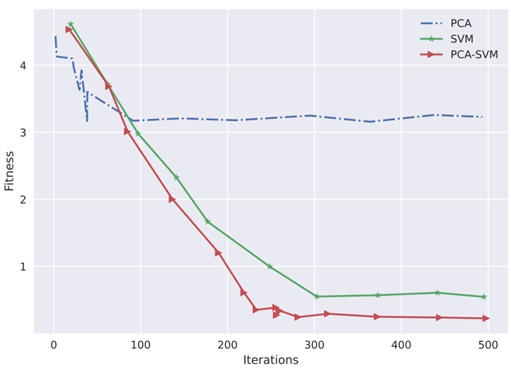
Table 3 records the best, average, and worst fitness values obtained from 10 tests of the Ackley function for each algorithm. The PCA-SVM algorithm consistently outperforms the PCA and SVM algorithms in all metrics, showcasing excellent search ability and stability.
| Ackley Function | PCA-SVM | SVM | PCA |
| Best | 4.4408e-16 | 1.8720e-05 | 7.5496e-13 |
| Average | 6.5724e-16 | 0.0017 | 1.0464e-12 |
| Worst | 7.9935e-16 | 0.0040 | 1.4656e-12 |
The eigenvalues of each dimension of the covariance matrix of the dataset are presented in Table 4.
| Dimensionality | Eigenvalue |
| Dimension 1 | 343178.918123323 |
| Dimension 2 | 50981.94708167 |
| Dimension 3 | 23902.28731717 |
| Dimension 4 | 5832.78923678 |
| Dimension 5 | 3585.23705724 |
The eigenvectors corresponding to the covariance matrix are shown in Table 5.
| Characteristic Coefficient \({a_{ij}}\) | Dim 1 | Dim 2 | Dim 3 | Dim 4 | Dim 5 |
| \(i = 1\) | 0.11046757 | 0.086252404 | 0.16642933 | 0.45867806 | 0.07592697 |
| \(i = 2\) | 0.34976236 | 0.23237076 | -0.86698675 | -0.17260774 | -0.20545233 |
| \(i = 3\) | 0.13579129 | -0.08117845 | -0.20253264 | 0.03355863 | 0.96582873 |
| \(i = 4\) | 0.9203348 | -0.1812 | 0.33861134 | 0.00826711 | -0.07389762 |
| \(i = 5\) | 0.00282768 | 0.40332238 | 0.25486888 | -0.87099165 | 0.11751119 |
The principal components of the 40 original data samples are recalculated in Table 6. The first four principal components are used as input variables for the SVM model.
| Serial No. | \(\mathbf{F_1}\) | \(\mathbf{F_2}\) | \(\mathbf{F_3}\) | \(\mathbf{F_4}\) |
| 1 | -0.63186 | -0.33002 | -0.24498 | -1.04147 |
| 2 | -0.67422 | -0.86936 | 0.47618 | -1.23079 |
| 3 | 0.11956 | 0.05484 | -1.60515 | -0.04320 |
| … | … | … | … | … |
| 39 | 1.65691 | -1.94799 | -0.32238 | 0.90037 |
| 40 | 2.26353 | 0.56459 | -0.59738 | 0.09812 |
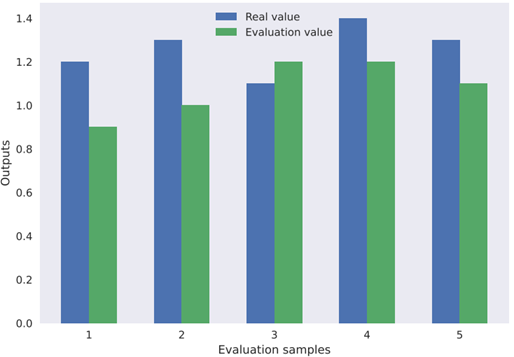
The PCA-GA-SVM kindergarten brand image quality evaluation model was used to evaluate five sets of test samples in Table 6and compare them with actual values. Figure 7 shows the comparison between evaluated and actual values. The PCA-GA-SVM model achieves a maximum absolute error of 0.0922 and a maximum relative error of 9.22%, outperforming the GA-SVM model in accuracy and meeting practical application needs.
China continues to face challenges in the development of adequate tools for evaluating education quality. To address this issue, there is a need to strengthen the development of process-oriented education quality evaluation tools, establish a scientific and reasonable education quality evaluation standard system, and develop practical and operable evaluation tools. Kindergartens should implement different evaluation points at various stages, decompose the evaluation index system, and adopt a phase-focused evaluation mechanism. By emphasizing focus and layering in the evaluation process, assessments can become more relevant and timely, ensuring the developmental functions are fully realized. The evaluation method proposed in this paper effectively addresses the aforementioned issues and provides significant value for subsequent research and development in the field of education quality evaluation.
This paper is the 2023 Guangxi university young and middle-aged teachers’ scientific research basic ability enhancement project “young children’s labor practice living six integration implementation path research” (subject number 2023KY1001), Guangxi education science “fourteenth five-year plan” planning 2021 Guangxi education basic construction research special focus on the topic of “Guangxi”. Research on “Toilet Revolution” in Township Kindergartens (Project No. 2021ZJY1889).