
The global industrial economic landscape is undergoing profound changes. The prices of energy and raw materials are continuously rising, while the constraints on resources and the environment are intensifying. The internal and external dynamics of China’s industrial competition have been impacted [2]. Firstly, the market space for low-end industries in the low value-added segments of the global value chain, previously secured by labor advantages, has been compressed due to low labor costs in developing countries. Secondly, faced with barriers from developed countries and global trade protectionism, China has yet to establish a strong competitive advantage in high-end industries. Thirdly, traditional industries in China lack their own momentum for development, still plagued by inherent drawbacks such as low profit margins, inefficient production models, and fierce competition [4,5]. In the past, when some developed countries addressed these issues, they typically built low-end value chains in developing countries to achieve external expansion by consuming and exploiting the factor resources of those countries [11]. These approaches are now outdated, and it is necessary to explore a new path with Chinese characteristics.
Digital transformation represents a typical “integrated economy.” Leveraging integrated development as an opportunity, it plays a supporting and leading role in the real economy, especially in industries, and has become an important starting point for mode transformation, structural adjustment, and kinetic energy change [6]. First, digital transformation will leverage the driving effect of factors, turning data into a fourth type of production factor. It will penetrate and adjust the allocation of traditional factors such as labor, land, and capital, improving the efficiency of factor allocation and easing the excessive consumption and dependence of traditional industries on tangible assets and energy [1]. Secondly, the network space created by digital transformation breaks the limitations of physical space, enabling the circulation, reorganization, and reallocation of resources across different regions, thereby reconstructing the spatial layout of the industrial chain. This can effectively smooth domestic circulation and enhance the stability and competitiveness of China’s industrial and supply chains [10]. It can ease the pressure caused by the compression of international markets and serve as a crucial factor in enhancing industrial added value. Finally, the empowerment of traditional industries through digitalization and industrial digitalization promotes the full integration of industries with the digital network. By relying on digital platforms, the efficiency and collaboration of all links in the industrial chain, supply chain, and innovation chain are improved. With the aid of digital and intelligent R&D design, production, manufacturing, and logistics, personalized and flexible production is achieved, ensuring continuous renewal of competitiveness [7,14]. In conclusion, digital transformation drives both data-driven and industry-driven effects, changing the efficiency of factor allocation, reducing energy dependence, improving production efficiency, achieving flexible production, enhancing new competitiveness, and comprehensively promoting industrial upgrading. Ultimately, this will elevate China’s industries to the middle and high end of the global value chain [12].
Given this context, it is crucial to address the imbalance in the development of digital transformation, how digital transformation can better serve regional economic development, and how China can build a new model of regional economic development driven by digital transformation. These are urgent issues that require solutions [8].
This paper, therefore, takes the Yangtze River Delta Economic Belt as a case study to explore the spatial effect of digital transformation on the healthy transformation of traditional industrial structures. It aims to provide theoretical support and policy recommendations for building a new regional economic development model driven by digital transformation.
Regional spatial systems are evolving from local to global. Commodity flows, information flows, and capital flows are being recombined globally, and spatial elements are gradually emerging with new connotations [13]. Beyond cities, the industry network actors in the production network have become important nodes. A line serves as an essential channel connecting network nodes. It represents a collection of dynamic and static concepts, including capital flow, commodity flow, labor force, information flow, and the construction of soft and hard infrastructure supporting various “flows,” such as transportation and communication infrastructure, market circulation channels, etc., as shown in Table 1.
| Regional Elements and Their Combinations | Spatial Subsystem | Space Combination Type |
| Point to Point | Capital and information node system | Regional urban system, urban internal functional area |
| Point Line | Capital information hub system | Financial center, information center, and knowledge innovation center |
| Point Face | Urban regional system | Metropolitan area |
| Line to Line | Network facility system | Capital network, information network, high-speed transportation network |
| Line Face | Industrial regional system | Specific high-tech industrial belt |
| Face to Face | Integrated economic system | Specific industrial zones based on division of labor and cooperation |
| Point Line Face | Space economic integration system | Value section labor division area |
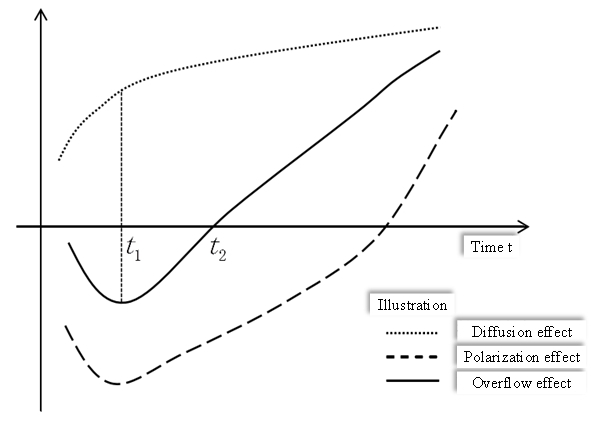
The relationship between the spillover effect of digital transformation and time \(T\) is shown in Figure 1. In the figure, the dotted line with dots represents the diffusion effect of digital transformation, the dotted line with horizontal lines and dots represents the polarization effect, and the solid line formed by combining the two effects represents the spillover effect of digital transformation.
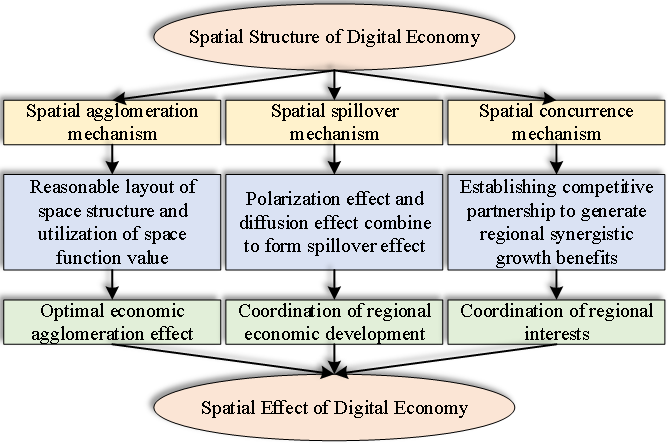
The competition partnership in the digital transformation spatial relationship network is dynamic, changing with the stages of digital transformation development [9]. Specifically:
In the stage of weak regional connection, each region focuses on its development needs. Competition and cooperation intensity between regions is relatively small.
As regional connections strengthen, competition becomes dominant due to increased consumption of digital resources and market rivalry.
When regional connections stabilize, regions seek a win-win development model, promoting resource optimization and coordinated development.
This competitive partnership fosters rational resource distribution among regions, ultimately leading to a coordinated regional economic development pattern, as shown in Figure 2.
Regarding measurement methods, the entropy weight method, known for its objectivity and accuracy, is used to quantify the index weight based on the methods outlined in [13]. To facilitate comparison of the spatial effect level of industrial transformation across regions, the measured index is scaled by multiplying it by 100.
If the year span is \(d\), \(n\) provinces, and \(m\) indicators, the \(j\)-th indicator of province \(i\) in year \(\alpha\) is denoted as \(x_{\alpha ij}\). After standardization, Eqs. (1) and (2) are obtained:
\[\label{e1} X'_{\alpha ij} = \frac{x_{\alpha ij}}{x_{\text{max}}}, \tag{1}\]
\[\label{e2} X'_{\alpha ij} = \frac{x_{\text{min}}}{x_{\alpha ij}}. \tag{2}\]
The index entropy is determined using Eq. (3):
\[\label{e3} e_j = -b \sum_{\alpha=1}^d \sum_{i=1}^n y_{\alpha ij} \ln\left(y_{\alpha ij}\right), \tag{3}\] where \(b > 0\), \(b = \ln(dn)\), and \(y_{\alpha ij} = X'_{\alpha ij}/\sum_{\alpha=1}^d \sum_{i=1}^n X'_{\alpha ij}\).
The utility value and weight of indicator information are shown in Eq. (4):
\[\label{e4} g_j = l – e_j, \quad \omega_j = \frac{g_j}{\sum_{j=1}^m g_j}. \tag{4}\]
The comprehensive score of spatial effect is given by Eq. (5):
\[\label{e5} S_{\alpha i} = \sum_{j=1}^m \left(\omega_j X'_{\alpha ij}\right). \tag{5}\]
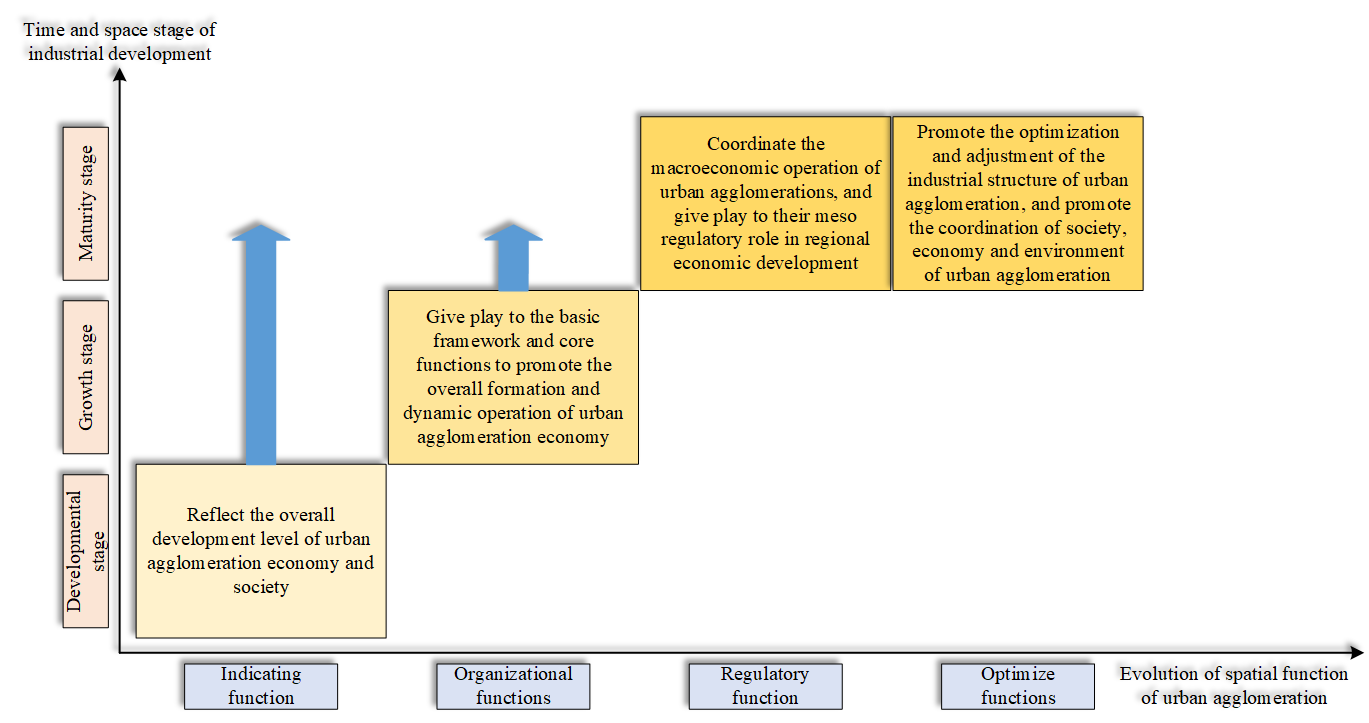
The structure and function of spatial effect, as two interdependent and mutually restricted components, are indispensable in any system. In urban agglomeration spatial systems, the spatial structure exhibits specific functions. The transformation of industrial structure generally progresses through the embryonic stage, promotion stage, and stable stage, producing functions of indication, organization, regulation, and optimization in different stages, as shown in Figure 3.
With the strengthening of infrastructure and institutional mechanism reform brought about by digital transformation, and the continuous expansion of inter-industry and inter-regional links, the stronger the innovation ability caused by capacity accumulation, the greater the profit space for entering new products with high added value. This has improved the innovation momentum of the industry, creating a virtuous circle of interactive enhancement. The maximum benefit of the space effect can be expressed as Eqs. (6) and (7):
\[\label{e6} \text{max } R = nf\delta – \frac{c\delta^2}{2d}, \quad n \geq 1, d \geq 1, \tag{6}\]
\[\label{e7} \delta = \frac{ndf}{c}. \tag{7}\]
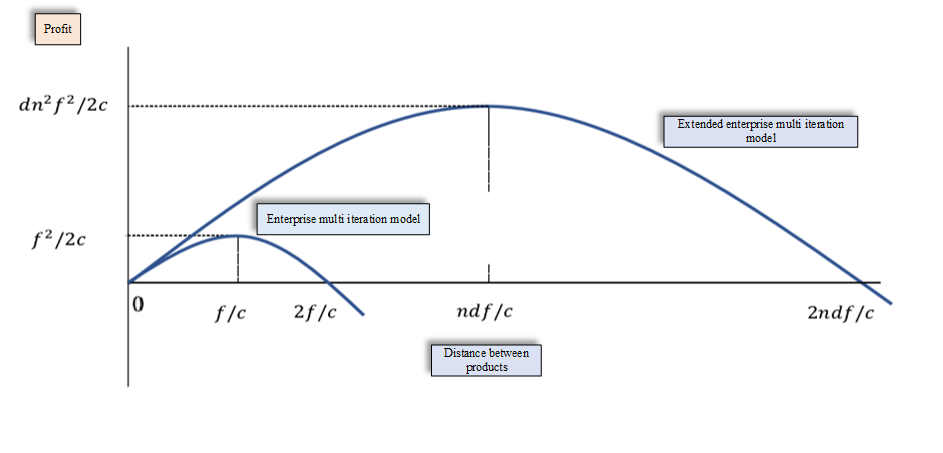
The optimal distance for maximizing industrial income is \(\delta = \frac{ndf}{c}\), and the maximum jumping distance of the industry is \(\delta^* = \frac{2ndf}{c}\). If the initial capacity endowment and production capacity accumulation of the industry can support this jump distance, it will achieve leapfrog path innovation and development, obtaining high value-added benefits.
It can be seen from Figure 4 that the initial capacity endowment of the linear industrial development path can only jump by \(f/c\). At this time, the income is only \(f^2 / 2c\), and the region is more likely to lock into the barren area of product space. The expanded industrial multiple iteration model increases the optimal distance to \(ndf/c\) and the income to \(d n^2 f^2 / 2c\). Products no longer rely solely on the linear path for industrial transformation and upgrading, enabling regional leapfrog path breakthroughs and spatial iteration, as shown in Eqs. (8) and (9), and Figures 4 and 5.
\[\label{e8} \begin{aligned} & \text{max}_{n, \delta_{n, 2}} R_n = f\delta_{n, 1} – \frac{c\delta_{n, 1}^2}{2} + f\delta_{n, 2} – \frac{c(\delta_{n, 2} – \delta_{n, 1})^2}{2}, \end{aligned} \tag{8}\] where \(\delta_{n, 1} = \frac{2f}{c}, \quad \delta_{n, 2} = \frac{3f}{c}.\)
\[\label{e9} \varphi_{n^* n} = \begin{bmatrix} 0 & \delta_{1,2} & \delta_{1,3} & \cdots & \cdots & \delta_{1,n} \\ & 0 & \delta_{2,3} & \cdots & \cdots & \vdots \\ & & 0 & \cdots & \cdots & \vdots \\ & & & 0 & \cdots & \vdots \\ & & & & 0 & \delta_{n-1,n} \\ & & & & & 0 \end{bmatrix}. \tag{9}\]
From the above mathematical formulas and models, we derive two basic assumptions:
The increase in spatial density of industrial areas is conducive to the transformation and upgrading of the industrial structure.
The transformation and upgrading of regional industrial structures follow the spatial development path of existing capacity and endowment advantages.
This study takes the cities in the economic belt of the Yangtze River Delta as the analysis object of the empirical study.
The Yangtze River Delta is located at the “T”-shaped junction along the river and coast of China. With excellent natural endowments and prominent regional advantages, it is the region with the highest level of economic development, the most densely populated, and the most urbanized area in China. It has become an important engine to enhance national comprehensive strength and international competitiveness, driving national economic development [3].
In recent years, in line with the new trend of international industrial development, the Yangtze River Delta has continuously increased its industrial structure adjustment efforts. By developing high-end industries and modern service industries, it has promoted the industrial structure from heavy to light, and from hard to soft. In 2013, the proportion of the added value of the three industries in the Yangtze River Delta was 4.7:47.0:48.3, significantly higher than the national average of 10.0:43.9:46.1 in the same period. It was the first region to achieve a breakthrough from “two-three-one” to “three-two-one” in industrial composition, as shown in Table 2.
| Year | Enterprises | Employees (Avg.) | Output Value | Business Income | Export Value | Profit | Profit + Tax |
| 2005 | 5460 | 1819180 | 11815 | 11915 | 7345 | 426 | 606 |
| 2008 | 8770 | 3025925 | 20510 | 20333 | 13260 | 977 | 1345 |
| 2009 | 9175 | 2952155 | 21248 | 21133 | 12690 | 950 | 1360 |
| 2010 | 9633 | 6445790 | 26590 | 26515 | 16000 | 1495 | 1999 |
| 2011 | 6950 | 3506700 | 30230 | 30065 | 17165 | 1635 | 2226 |
| 2012 | 7770 | 3726958 | – | 33890 | 18530 | 1866 | 2710 |
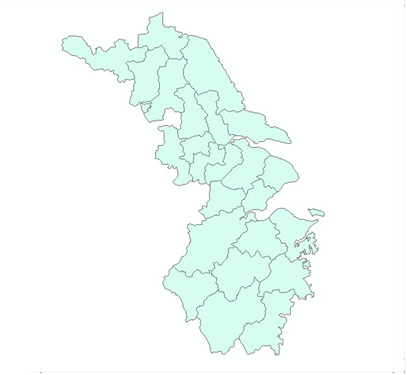
As shown in Figure 6, the spatial distribution of high-tech industries in the Yangtze River Delta demonstrates strong agglomeration. With high-tech parks and industrial bases as the carrier, the spatial pattern of “core, one belt, and one network” has been formed. Shanghai, Nanjing, and Hangzhou serve as the core, with Suzhou, Wuxi, Changzhou, and Ningbo as important nodes. Industrial belts such as the Shanghai-Nanjing-Hangzhou, Shanghai-Hangzhou-Ningbo, and the Torch High-tech Belt along the Yangtze River, along with the Ningbo-Taiwan-Wenzhou Coastal Industrial Belt, form the backbone of this evolution. Spatially, the region is evolving from a “Z”-shaped to an “S”-shaped pattern.
Based on the principle of measuring whether the internal capacity of the industry is improved, this study considers that the changes in industrial transformation, upgrading, and spatial measurement in the entire region are mainly reflected in the improvement of transformation rate and upgrading. These are detailed in Tables 3, 4, and 5.
| Level I Indicators | Secondary Indicators | Third-Level Indicators | Direction | Calculation Formula |
| Efficiency Upgrading | Productivity | Total labor productivity | (+) | \(TLP = \frac{V_z}{L_z}\) |
| Efficiency Upgrading | Profitability | Profit margin of main business | (+) | \(OPE = \frac{OP_z}{I_z}\) |
| Advanced Transformation | High-quality production capacity | Proportion of high-tech industry | (+) | \(PHT = \frac{I_h}{V_z}\) |
| Advanced Transformation | Energy consumption and environmental protection | Energy consumption per unit income | (-) | \(ECI = \frac{E_z}{I_z}\) |
| Advanced Transformation | Energy consumption and environmental protection | Utilization ratio of solid waste | (+) | \(ISW = \frac{W_u}{W_t}\) |
Descriptive statistical results of variables are presented in Table 4.
| Variable | Sample Size | Mean Value | Standard Deviation | Minimum Value | Maximum Value |
| MTU | 270 | 0.303 | 0.105 | -0.292 | 0.574 |
| DE | 270 | 0.205 | 0.086 | 0.073 | 0.545 |
| FDI | 270 | 2.088 | 1.897 | 0 | 12.096 |
| HR | 270 | 9.176 | 0.894 | 7.477 | 12.683 |
| GI | 270 | 0.289 | 0.235 | 0.108 | 1.486 |
| IC | 270 | 0.335 | 0.188 | 0.033 | 0.841 |
| PGDP | 270 | 5.233 | 2.625 | 1.603 | 16.175 |
| KRA | 270 | 0.356 | 0.353 | 0.002 | 1.919 |
| LRA | 270 | 0.242 | 0.177 | 0.002 | 0.884 |
| EI | 270 | 0.788 | 0.353 | 0 | 1.864 |
| MSD | 270 | 0.520 | 0.717 | 0.002 | 4.299 |
Weights of digital transformation development level indicators are listed in Table 5.
| Third-Level Indicators | Weight After Time Decay | Normalized Weight |
| Length of optical cable line per square kilometer (X1) | 0.1008 | 0.0299 |
| Number of Internet broadband access terminals per square kilometer (X2) | 0.2716 | 0.0796 |
| Number of domain names per 100 people (X3) | 0.2916 | 0.0858 |
| Number of websites per 100 people (X4) | 0.2944 | 0.0868 |
| Manufacturing industry in GDP (X5) | 0.1691 | 0.0496 |
| Services in GDP (X6) | 0.2563 | 0.0755 |
| Number of employees in electronic and communication equipment manufacturing industry (X7) | 0.3494 | 0.1024 |
| Technology services (X8) | 0.1931 | 0.0566 |
| Mobile phone penetration rate (X9) | 0.0915 | 0.0266 |
| Internet broadband access user penetration rate (X10) | 0.0658 | 0.0191 |
| Digital TV user penetration rate (X11) | 0.0676 | 0.0196 |
| Number of terminals in electronic reading rooms of public libraries (X12) | 0.0663 | 0.0196 |
| Per 100 people (X13) | 0.1046 | 0.0306 |
| Proportion of enterprises with e-commerce transactions (X14) | 0.0862 | 0.0255 |
| Proportion of e-commerce transactions in GDP (X15) | 0.1744 | 0.0511 |
| Integrated government service capacity index (X16) | 0.0527 | 0.0153 |
| Technical market turnover (X17) | 0.2834 | 0.0834 |
In this study, the adjacent spatial weight matrix of the Yangtze River Delta is selected for spatial autocorrelation tests. To test the robustness of the results, the 0-1 adjacency matrix \({W_1}\) and longitude-latitude adjacency matrix \({W_2}\) are used for measurement. The specific digital transformation development level (DE), industrial production scale (MI), and industrial upgrading (UMI) are measured as explained above, and the test results are shown in Table 6.
| Year | MI/\(W_1\)) | MI/\(W_2\)) | DE/\(W_1\)) | DE/\(W_2\)) | UMI/\(W_1\)) | UMI/\(W_2\)) |
| 2008 | 0.385***(3.663) | 0.274***(4.105) | 0.282***(2.808) | 0.114** | – | – |
| 2009 | 0.192**(1.875) | 0.075*(1.453) | 0.263***(2.657) | 0.111**(2.004) | – | – |
| 2010 | 0.378***(3.499) | 0.297***(4.341) | 0.233***(2.424) | 0.103**(1.912) | 0.386***(3.486) | 0.356***(5.003) |
| 2011 | 0.346***(3.433) | 0.306***(4.301) | 0.207**(2.212) | 0.095**(1.818) | 0.395***(3.614) | 0.345***(4.931) |
| 2012 | 0.343***(3.192) | 0.313***(4.486) | 0.222***(2.346) | 0.106**(2.005) | 0.513***(4.606) | 0.377***(5.314) |
| 2013 | 0.313***(2.893) | 0.303***(4.424) | 0.177**(1.944) | 0.092**(1.775) | 0.525***(4.674) | 0.403***(5.614) |
| 2014 | 0.314***(2.907) | 0.295***(4.331) | 0.178**(1.985) | 0.083**(1.722) | 0.391***(3.525) | 0.355***(5.044) |
| 2015 | 0.299***(2.793) | 0.280***(4.122) | 0.211***(2.313) | 0.097**(1.868) | 0.497***(4.413) | 0.395***(5.575) |
| 2016 | 0.282***(2.655) | 0.265***(3.869) | 0.197**(2.135) | 0.102**(1.931) | 0.563***(4.955) | 0.426***(5.969) |
| 2017 | 0.270***(2.591) | 0.257***(3.784) | 0.195**(2.111) | 0.089**(1.900) | 0.586***(5.153) | 0.454***(6.353) |
| 2018 | 0.275***(2.596) | 0.260***(3.888) | 0.197**(2.122) | 0.085**(1.725) | 0.555***(4.902) | 0.423***(5.924) |
| 2019 | 0.273***(2.576) | 0.266***(3.888) | 0.211**(2.267) | 0.091**(1.744) | 0.577***(5.144) | 0.434***(6.046) |
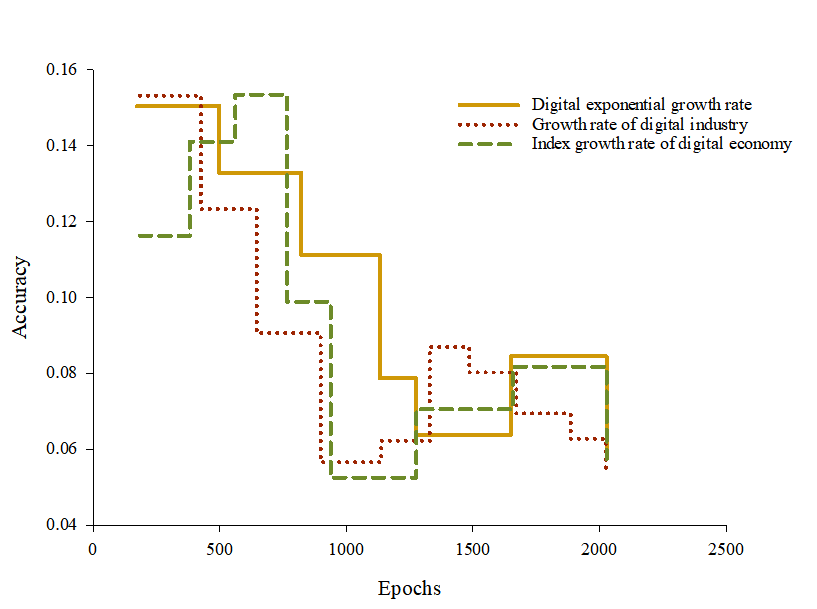
From the measurement results in Table 6, whether based on the 0-1 adjacency matrix or the longitude-latitude adjacency matrix with a threshold, digital transformation and industry show positive spatial correlation, significant at a level greater than 5%. This confirms Hypothesis 1. The trend of exponential growth is shown in Figure 7.
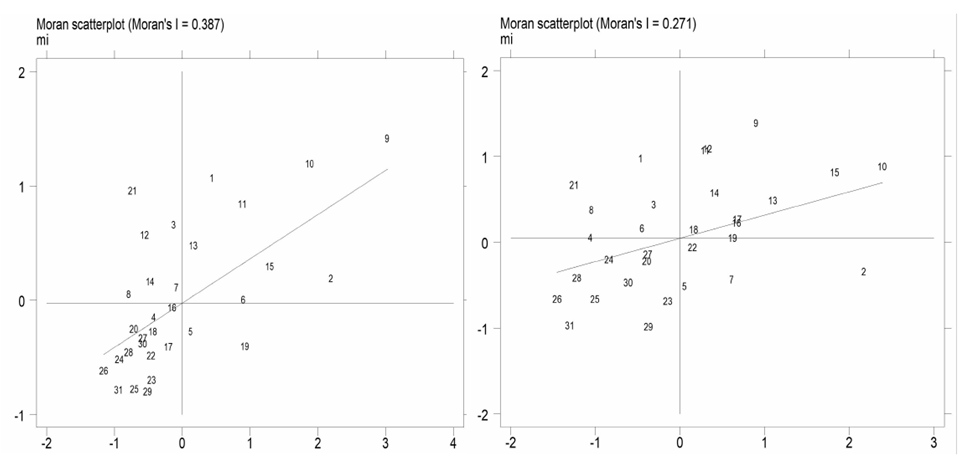
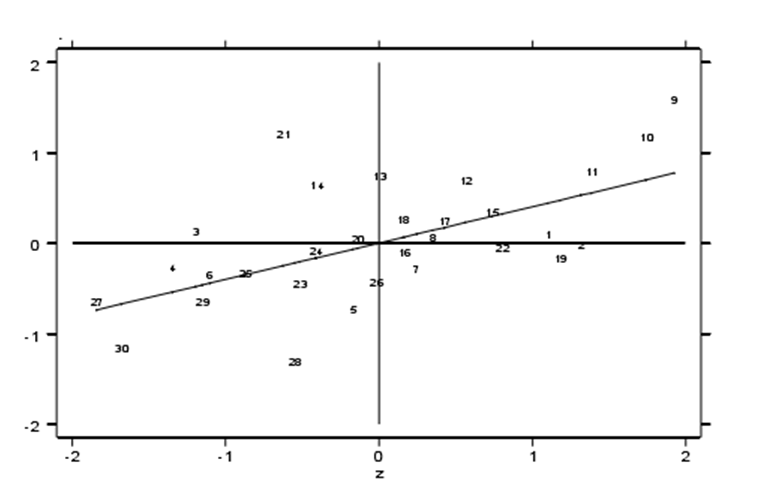
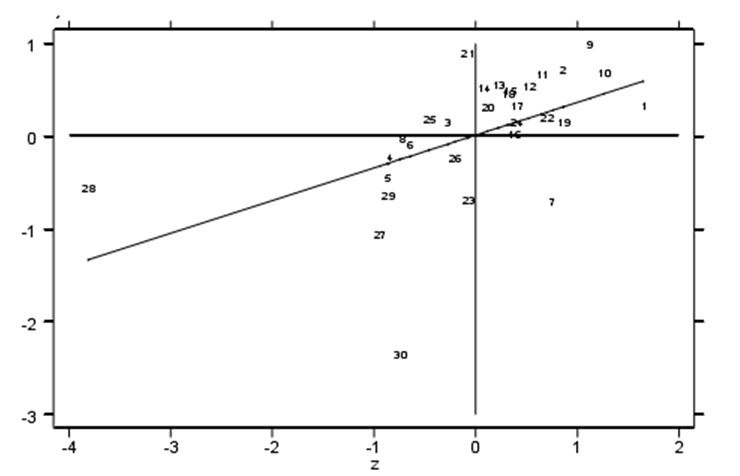
After standardizing the adjacency matrix, we derive the Moran’s I scatter diagram for digital transformation and industry, as shown in Figure 8. Digital transformation and industrial production scale are measured for 2008 and 2019, while industrial upgrading is measured for 2010 and 2019.
The spatial econometric model results under the two spatial matrices are consistent, indicating robust results. The national-level spatial models show that digital transformation significantly promotes industrial upgrading. However, while digital transformation positively affects industrial production scale, its significance level is low. This supports Hypothesis 2, as shown in Figures 9 and 10.
The digital transformation of the industrial chain as a threshold value verifies whether digital levels in industrial chains influence industrial space upgrading driven by digital transformation. The results are shown in Table 7.
| Threshold Type | F Value | P Value | Bootstrap Times | Critical Value (1%) | Critical Value (5%) | Critical Value (10%) |
| Double Threshold | 34.13 | 0.0631 | 500 | 64.4181 | 37.8633 | 28.2543 |
| Triple Threshold | 6.31 | 0.7165 | 500 | 55.6174 | 37.3943 | 23.2791 |
| Single Threshold | 4.78 | 0.8365 | 500 | 28.5644 | 21.9484 | 17.6788 |
This paper conducts a comprehensive study on the digital transformation-driven spatial layout reconstruction and industrial upgrading of the industrial chain through literature review, conceptual interpretation, and development analysis. The theoretical logic behind the spatial layout reconstruction and industrial upgrading of digital transformation-driven industrial chains, the development level of digital transformation and industrial chain digitization, and the spatial effect and threshold characteristics of digital transformation-driven manufacturing upgrading are thoroughly explored. From the perspective of industrial chain spatial layout, this paper constructs a model for the digital transformation-driven industrial upgrading path and conducts empirical research using cities in the Yangtze River Delta Economic Belt as case studies. The experimental results demonstrate that the model is significant at a confidence level greater than 95%, making it suitable for the spatial measurement model selection. The mean square error of the network simulation output is 0.1333, verifying the proposed hypotheses and confirming that digital transformation has a significant spatial driving effect on industrial upgrading. This study provides valuable insights into how digital transformation can effectively drive industrial upgrading and offers a theoretical and practical framework for optimizing the spatial layout of industrial chains in the digital economy era.
This work was supported by the Hunan Provincial Social Science Fund’s 2023 Annual Project, titled ‘Deepening the Influence of RTA on Cross-Border Data Flow and the Dynamic Regulation Mechanism’ (Project No. 23YBA253), and the 2024 Hunan Natural Science Foundation Project, titled ‘Data Elements Embedded in Entity Value Chain: Empowerment and Risk’ (Project No. 2024JJ6199).