
Static stretching is the process of stretching and lengthening muscles and connective tissues at rest to increase their flexibility and extensibility through controlled breathing. Static stretching is usually performed before or after exercise to help prepare the body to begin exercise or to recover muscles after exercise [11,5,2]. It aims to increase muscle flexibility and reduce the risk of muscle strain and injury during exercise. Through static stretching, muscles can be made more supple, range of motion of joints can be increased, and posture and balance of the body can be improved [12,17,8]. Dynamic stretching involves a series of fluid and continuous movements to increase the range of motion of muscles and joints before performing exercise [15]. Compared with static stretching, dynamic stretching is more active and powerful, and can improve flexibility and readiness of the body before preparing the body for high-intensity exercise, which can be fully utilized in fitness training to improve flexibility and prevent sports injuries [3,7,16,13].
Athletes’ reaction speed and agility are very important indicators of ability in all sports. Good reaction speed and agility can not only improve athletes’ performance in competition, but also reduce the risk of injury [6,19,4]. Improving athletes’ reaction speed and agility is a systematic process, which requires comprehensive consideration of training methods, training programs and individual circumstances. Through scientific and reasonable training and efforts, athletes’ reaction speed and agility will be effectively improved, thus enhancing their competitiveness and performance in the competition [1,10,14,9].
Choosing efficient and practical stretching methods is one of the important jobs of every physical fitness coach, and a reasonable stretching program can make the human body form multiple physiological responses, thus enhancing the human body’s performance ability in the process of exercise. As static stretching and dynamic stretching, which are more convenient to operate, are preferred by many coaches. However, an examination of the existing relevant literature reveals that these results are relatively fragmented, with varying experimental designs and interventions. In order to enhance the consistency and comprehensiveness of the findings, this paper utilizes the research methods of systematic review and Meta-analysis, combines and analyzes experimental studies of interventions on athlete agility, expands the sample capacity, and thoroughly investigates and discusses the comprehensive effects of dynamic and static stretching on athlete agility using effect-size analyses, heterogeneity tests, publication bias analyses, and subgroup analyses.
Static stretching (SS) is a method of stretching in which the muscle is slowly lengthened to the point of discomfort (without pain) and maintained at the point of maximum tolerance for a certain period of time. The advantage of static stretching is that static stretching does not lead to the emergence of the tension reflex phenomenon because the muscle is slowly pulled, and therefore is less prone to injury and is effective in improving joint flexibility. Dynamic stretching (DS) is a type of functional stretching that uses general and specialized stretches to simulate the movement patterns required by muscles during exercise, allowing the body to adapt to the specialized movement patterns faster and improve the corresponding joint mobility, as well as elevating the body’s core temperature and regulating the body’s physiological functions. In order to explore the effects of static and dynamic stretching on the agility of athletes, and to provide a theoretical basis and practical reference for scientific stretching training. Integrating the results of previous studies and extracting data to explore the effects of dynamic and static stretching on lower limb vertical jumping ability, to provide coaches with scientific guidelines to design a more optimized stretching training program to improve athletes’ sports performance ability.
Read the relevant literature to understand the advantages and shortcomings of different stretching methods in the literature, the current status of research in this field at home and abroad, and the application of Meta-analysis methods, and use this to make theoretical support for this study [19-20].
Literature included in this study needed to meet the following criteria: (1) the original text was available and had to be published in Chinese or English. (2) The experimental design was randomized controlled trials (RCTs) or self-controlled trials (NRCTs). (3) The subject population was unrestricted and there were no limitations in terms of gender, training status, sport specialty, or body mass index. (4) Interventions were dynamic stretching or tight stretching and other training methods. (5) The outcome metrics are agility test metrics and must be quantifiable. (6) The literature must be able to clearly present data such as sample size, mean, and standard deviation. (7) Studies do not include systematic reviews of the literature. (8) Studies treating movement disorders or a particular disease are excluded.
In this study, four databases, China Knowledge Network (CNKI), Wanfang, Pubmed, Web of science, and EBSCO Comprehensive Library, were searched by two staff members in an independent double-blind manner during the search process, which was conducted from the time of database construction to January 31, 2023. Subject terms were established according to study population, intervention, control, outcome indicators, and type of study design. The English language was searched by a combination of the search terms Stretching training, Stretching movement, Stretching method, Speed, Agility, and Reaction, and the Chinese language was searched by a combination of the search terms Stretching training, Stretching movement, Stretching method, Speed, Agility, and Reaction in a combined hybrid search The Chinese take China Knowledge Network as an example. In Chinese, for example, the keywords “static stretching” and “dynamic stretching” were used as search terms, and “COD agility” was used as the keyword in the search results. In English, take Web of science as an example: search with the subject words “Static stretching” or “Dynamic drawing” or AND “505 test” or “Illinois test” or “speed”.
All relevant literature retrieved from Chinese and English databases was imported into EndNot software, publication information and author details were removed, and duplicates were deleted before the titles and abstracts of each paper were viewed separately for the first screening. Screening criteria: full text must be available, and subjects and interventions must meet the inclusion criteria. The remaining literature after the first screening should be read in full text for the second screening, statistics and screening of experimental test indexes in the papers, the experimental data in the literature should include sample size, mean and standard deviation, the intervention program does not include dysfunction or treatment of a certain disease, to exclude systematic review articles, the data is incomplete or the methodology of the literature is unclear to contact the author, as far as possible, to obtain the complete data information. Data. After the second screening, the literature was reviewed again according to the inclusion criteria, and the literature that the authors could not be contacted and the complete data could not be obtained was excluded.
The relevant data of the included literature were extracted, and the extraction included: the first author of the paper, the year of publication, the population of the experimental subjects, gender, age, subgroup information, the sample size, the intervention program, the intervention period, the frequency of intervention, the intensity of the intervention, and the outcome indicators. Studies with incomplete data information were obtained by contacting the authors via e-mail or other means.
Meta-analysis is a statistical method of quantitatively synthesizing the results of a study to arrive at a single conclusion with greater statistical validity, applying a design scheme that critically evaluates previous studies and statistically combines the results of a single study to analyze the consistency and generalizability of the results as a scientific research process. Meta-analytic results are statistically stronger than single-study analyses because the number of subjects is increased, there is greater variation among subjects, and meta-analyses allow for cumulative effects and results.
Meta-analysis requires the use of effect sizes, which are quantitative synthetic effect scales that are independent of sample size and indicate the magnitude of the overall mean under different treatments, and are used to compare the results of different studies. When the outcome data type is a categorical variable, the effect sizes commonly used in research are OR (odds ratio), RR (relative risk) and RD (risk difference). When the type of outcome data is continuous variables, the effect measures WMD (weighted mean difference) and SMD (standardized mean difference) are used. The evaluation criteria of effect sizes: taking absolute values, 0.2 is a small effect size, 0.2-0.8 is a medium effect size, and greater than 0.8 is a large effect size.
When the unit of measurement of the outcome indicator data in the research literature is consistent, the WMD is used, and when it is not consistent, the effect size SMD is used.The literature included in this study is RCT studies, and the outcome data are continuous data, because the same outcome indicator uses different measurement methods and measurement tools, so the effect size uses the standardized mean difference Hedges’ g, i.e., the SMD after correction for bias.
Meta-analysis involves two models for combining effect sizes, i.e., fixed-effects model and random-effects model [18]. When all the studies included in the Meta-analysis use the same measurement tools, it is more reasonable to use a fixed-effects model, and when the included studies use different measurement methods and tools, it is more reasonable to use a random-effects model. The choice of which model is also related to \(I^2\); when \(I^2\) \(\mathrm{<}\) 50%, a fixed effects model is used. When \(I^2\)\(\mathrm{>}\)50%, a random effects model is recommended. In this study, the random effects model was used for the analysis.
In this study, the heterogeneity among the included literature was examined using the Q test and \(I^2\).In the Q test, the larger the Q value, the smaller the P. Heterogeneity is considered to be significant when P\(\mathrm{<}\)0.01.The larger the \(I^2\), the larger the heterogeneity is, and the heterogeneity of the literature is considered to be significant when the \(I^2\)\(\mathrm{>}\)50%. Heterogeneity among literature is considered less when P\(\mathrm{>}\)0.01 and \(I^2\)\(\mathrm{<}\)50% in Q test.Both Q test and \(I^2\) are affected by sample size and \(I^2\) is more sensitive than Q test.
This study used funnel plots to test for publication bias in the included literature. Since positive studies are more likely to be published than negative, this leads to publication bias. Using a funnel plot, the literature of the included studies can be tested for publication bias. When the funnel plot is symmetrically distributed, there is no publication bias.
The purpose of subgroup analysis is to explore sources of heterogeneity, which is considered to exist between the combined studies when \(I^2\) \(\mathrm{>}\) 50%. Subgroup analysis can be used to further understand the role of different factors on individual differences and to derive what is the specific amount of effect of different factors on individual differences. At the same time, subgroup analysis methods were utilized to determine more precisely the role of the test factors on the overall outcome from different perspectives and at different levels.
Data were extracted and coded as well as analyzed with descriptive statistics using Excel. RveMan 5.3 was used to perform Meta-analysis, heterogeneity test, publication bias test, subgroup analysis, and plotting of forest and funnel plots on the data.
Literature searches were conducted independently by two graduate students in the same field of study, using EndNote software to perform de-duplication operations on retrieved articles, exclude literature that was not relevant to the topic based on the title and abstract, and read potentially relevant literature in full text. The final included literature was then determined based on the inclusion and exclusion criteria. After the literature screening was completed, the two researchers cross-checked each other, and in case of disagreement, a centralized discussion was conducted to determine whether the literature should be included in the study or not. By searching Chinese and foreign language databases, a total of 15 papers were included, involving 2,185 study participants, including 992 in the static and dynamic stretching groups and 1,193 in the control group. Indicators from these 15 papers were analyzed.
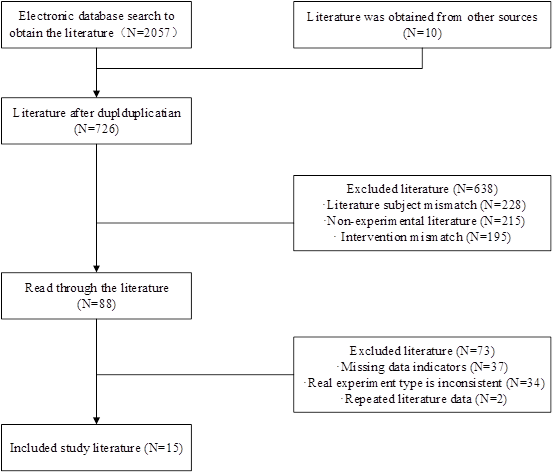
According to the set search strategy, the Chinese database retrieved 1855 documents and the English database retrieved 202 documents. After the de-duplication operation by Endnote document management software, duplicates were eliminated and 726 documents were obtained. Subsequently, 15 documents were finally included by reading the title, abstract and full text and screening according to the nerfing criteria. The flow of literature screening results is shown in Figure 1.
The literature was screened according to the inclusion and exclusion criteria, and two independent researchers finalized the inclusion of 15 relevant literatures into the study and extracted the basic information of these included literatures, including the time of publication of the literature, the sample size, the subjects of the study, the group experimental method, the age, the time of intervention, and the period of intervention, and so on, and organized them. The basic information of the included literature is listed below. Table 1 shows the basic information of the included literature, and Table 2 shows the intervention strategy of the included literature.
Among the selected literature, 4 belong to core journals and 5 are general journals, including 1 foreign language literature and 5 master’s theses. It can be seen that the proportion of foreign language literature is too small, and through an in-depth study and analysis of the other foreign language literature initially included, it was found that most of the foreign studies in this field were conducted on athletes, which conflicts with the inclusion criteria set by this study, and therefore all of them were excluded. The large proportion of master’s theses in the included literature reflects the more ordinary quality of the overall literature. Since the experimental duration period, exercise intensity, and intervention frequency of each study were different, there was some heterogeneity among the results of different studies, and some of the literature might be at risk of bias.
| Serial | Year | Block method | Subject investigated | Sample capacity | |
| Experimental group | Control group | ||||
| 1 | 2007 | Random | University | 178 | 118 |
| 2 | 2011 | Random | University | 56 | 31 |
| 3 | 2013 | Random | University | 68 | 197 |
| 4 | 2014 | Random | University | 60 | 60 |
| 5 | 2021 | Random | High school | 6 | 14 |
| 6 | 2015 | Random | 20\(\mathrm{\sim}\)22 years old | 141 | 709 |
| 7 | 2020 | Random | – | 37 | 7 |
| 8 | 2022 | Random | 19\(\mathrm{\sim}\)24 years old | 59 | 62 |
| 9 | 2020 | Random | High school | 148 | 66 |
| 10 | 2009 | Random | University | 12 | 10 |
| 11 | 2006 | Random | – | 23 | 41 |
| 12 | 2014 | Random | University | 24 | 71 |
| 13 | 2021 | Random | High school | 35 | 33 |
| 14 | 2023 | Random | – | 49 | 138 |
| 15 | 2017 | Random | High school | 30 | 26 |
| Serial | Intervention time | Intervention Frequency | Single duration | Control stretching |
| 1 | 32 Weeks | 2 times / week | 50min | Conventional stretching |
| 2 | 16 Weeks | 4 times / week | \(\mathrm{>}\)35min | Conventional stretching |
| 3 | 12 Weeks | 3 times / week | 90min | Conventional stretching |
| 4 | 24 Weeks | 2 times / week | 70min | Conventional stretching |
| 5 | 8 Weeks | 4 times / week | \(\mathrm{>}\)40min | Non-stretching |
| 6 | 16 Weeks | 3 times / week | 45min | Conventional stretching |
| 7 | 16 Weeks | 3 times / week | 60min | Non-stretching |
| 8 | 12 Weeks | 5 times / week | 60min | Conventional stretching |
| 9 | 12 Weeks | 3 times / week | 45min | Conventional stretching |
| 10 | 15 Weeks | 2 times / week | 45min | Conventional stretching |
| 11 | 16 Weeks | 2 times / week | 45min | Conventional stretching |
| 12 | 12 Weeks | 5 times / week | 50min | Conventional stretching |
| 13 | 9 Weeks | 2 times / week | 70min | Non-stretching |
| 14 | 12 Weeks | 3 times / week | 80min | Conventional stretching |
| 15 | 14 Weeks | 3 times / week | 55min | Non-stretching |
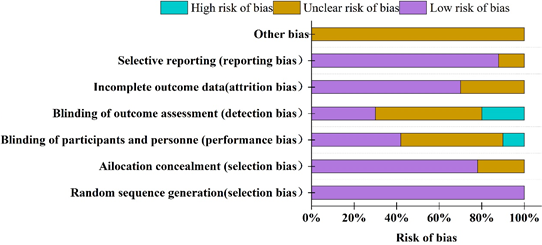
Risk of bias was assessed for the 15 papers included in the study. All included studies were randomized and assigned to protocols. The methodological evaluation of the included literature was performed using the “Risk of bias assessment” tool in the Cochrane system. Figure 2 shows the results of the quality assessment of the literature, and each entry was rated with three outcomes: high risk of bias, low risk of bias, and unclear risk of bias. Among the included literature, five literature reached a score of 5, eight literature reached a score of 4, and two literature reached a score of 3. Among them, 11 literatures related to the implementation of allocation concealment, but there was no mention of allocation concealment in the studies of [5] (2011), [17] (2021), [7] (2020), and [13] (2006). In addition, six papers accounted for lost visits, but they were not mentioned in the studies of [11] 2007, [5] (2011), [8] (2015), [13] (2006), [6] (2014), [19] (2021), [4] (2013), and [1] (2017). Except for [5] (2011), [2] (2013), all other literatures dealt with the reporting situation. The overall literature included in the study presented a low risk with a score of moderate quality.
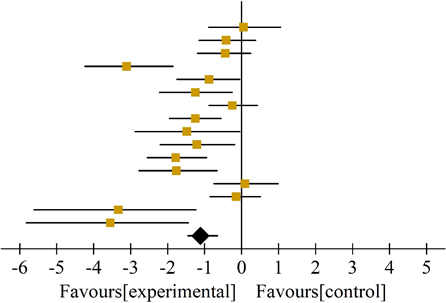
A total of 15 papers were included in this Meta-analysis, with a total of 16 experiments and a total of 322 subjects included in the studies. Since the COD test, an outcome indicator for evaluating the quality of sensitivity, is a continuous variable, and since the units of data for some of the outcome indicators are different and the results of each study are highly biased, SMD was used as a combined effect size scale for the Meta-analysis. After combining the results of each study, Q=31.88,\(I^2\)=65.8%, P=0.0005 was found, which indicated strong heterogeneity among the studies using a random effects model.
Table 3 and Figure 3 show the results of Meta-analysis, the total effect size of the combined studies was (SMD=-1.11,95Cl:-1.45 to -0.65, random effect model), which was statistically significant (P\(\mathrm{<}\)0.05).
| Study or Subgroup | Experimental | Control | Weight | Mean Difference IV, Random, 95%CI | ||||
| Mean | SD | Total | Mean | SD | Total | |||
| [11] | 4.22 | 0.08 | 10 | 4.28 | 0.08 | 10 | 7.9% | 0.05[-0.89,1.05] |
| [5] | 10.15 | 0.49 | 15 | 10.55 | 0.51 | 15 | 3.5% | -0.42[-1.15,0.38] |
| [2] | 11.11 | 0.47 | 16 | 11.36 | 0.81 | 16 | 7.6% | -0.44[-1.19,0.25] |
| [12] | 10.08 | 0.54 | 13 | 11.73 | 0.37 | 13 | 6.4% | -3.11[-4.24, -1.85] |
| [17] | 10.95 | 0.53 | 12 | 11.29 | 0.44 | 12 | 4.2% | -0.88[-1.75, -0.05] |
| [8] | 9.56 | 0.57 | 10 | 10.52 | 0.92 | 10 | 7.9% | -1.25[-2.22,-0.25] |
| [15] | 13.38 | 1.41 | 15 | 14.28 | 1.59 | 13 | 5.4% | -0.25[-0.88,0.43] |
| [3] | 8.95 | 0.61 | 15 | 9.622 | 0.56 | 14 | 7.8% | -1.25[-1.95,-0.55] |
| [7] | 9.16 | 0.31 | 5 | 10.08 | 0.72 | 5 | 5.5% | -1.48[-2.88,-0.05] |
| [16] | 8.92 | 0.24 | 8 | 10.02 | 0.25 | 8 | 8.0% | -1.21[-2.22,-0.19] |
| [13] | 9.08 | 0.27 | 12 | 11.98 | 0.64 | 11 | 8.9% | -1.78[-2.55,-0.94] |
| [6] | 9.77 | 0.78 | 5 | 11.12 | 0.85 | 5 | 7.4% | -1.76[-2.78,-0.66] |
| [19] | 11.21 | 0.52 | 9 | 12.08 | 0.52 | 9 | 5.9% | 0.09[-0.75,0.99] |
| [4] | 9.83 | 0.85 | 7 | 10.11 | 0.79 | 7 | 4.6% | -0.15[-0.85,0.51] |
| [1](L) | 10.02 | 0.76 | 5 | 10.95 | 0.81 | 5 | 4.9% | -3.33[-5.61,-1.23] |
| [1](R) | 8.78 | 0.95 | 6 | 9.56 | 0.88 | 6 | 4.1% | -3.55[-5.82,-1.44] |
| Total(95%CI) | 163 | 159 | 100% | 0.11[-1.45,1.65] | ||||
| Heterogeneity: Tau²=0.35, ch\(I^2\)=31.88, df=10.88(p=0.0005), p=65.8% Test for overall effect: Z= 4.68(p\(\mathrm{<}\)0.00001) | ||||||||
In this study, there was a high degree of heterogeneity (\(I^2\)=65.8%) among the studies in the meta-analysis results by COD-Test metrics, so an article-by-article exclusion method was used to determine whether a study was the main factor influencing the results of the Meta-analysis. Each article was excluded using Review Manager software 5.4 and a source of heterogeneity analysis was done to test whether the effect of each article on the combined effect size was significant. Table 4 shows the results of literature-by-literature exclusion for the COD test indicator. The heterogeneity decreased from 65.8% to 51.5% after excluding the study of literature [4], and the heterogeneity did not change much after excluding other studies, indicating that this study was the main source of heterogeneity.
| Remove the literature | \(I^2\)% | SMD | 95%CI | P |
| [11] | 63.7 | -0.98 | [-1.55,-0.68] | 0.001 |
| [5] | 62.9 | -1.12 | [-1.55,-0.62] | 0.002 |
| [2] | 63.6 | -0.94 | [-1.56,-0.62] | 0.003 |
| [12] | 62.1 | -0.95 | [-1.51,-0.52] | 0.002 |
| [17] | 60.5 | -1.17 | [-1.50,-0.52] | 0.003 |
| [8] | 65.8 | -1.08 | [-1.57,-0.58] | 0.002 |
| [15] | 62.3 | -1.13 | [-1.52,-0.55] | 0.003 |
| [3] | 65.9 | -1.14 | [-1.49,-0.58] | 0.001 |
| [7] | 63.7 | -1.01 | [-1.44,-0.56] | 0.004 |
| [16] | 63.4 | -1.18 | [-1.52,-0.58] | 0.004 |
| [13] | 62.5 | -1.2 | [-1.50,-0.60] | 0.001 |
| [6] | 63.1 | -1.11 | [-1.51,-0.57] | 0.001 |
| [19] | 60.6 | -1.02 | [-1.48,-0.59] | 0.002 |
| [4] | 51.5% | -0.95 | [-1.23,-0.55] | 0.024 |
| [1](L) | 62.2 | -1.17 | [-1.44,-0.56] | 0.003 |
| [1](R) | 63.9 | -0.97 | [-1.58,-0.65] | 0.006 |
After removing the studies from the literature [4] the fixed effect sizes of the remaining 14 papers were combined to combine the results of the studies and found that Q=2.75, \(I^2\)=0.515%, P=0.24, indicating a complete lack of heterogeneity between the studies.The results of forest plots of the Meta-analysis showed that the total effect sizes of the combined studies were (SMD=-0.048, 95% Cl: [-0.45, 0.33], fixed effects model), which was not statistically significant (P=0.75\(\mathrm{>}\)0.05).
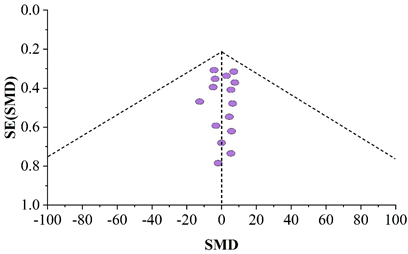
For the analysis of publication bias, Figure 4 shows the funnel plot of the test metrics, and from the funnel plot, it can be seen that the 15 studies are scattered on both sides of the middle dotted line and show a relatively symmetrical pattern, but there is no opposite funnel shape, so it is initially qualitatively judged that publication bias between individual studies may be low.
In order to carry out a deeper quantitative analysis of publication bias, the Meta module of Stata software was utilized to carry out Egger’s test analysis, and finally the bias test results were obtained, and Table 5 shows the results of the Egger’s bias test for COD test indexes. t=-2.25, P=0.048, and the 95% Cl was: [-9.0158771, -0.0857823], which indicates that there is a certain publication bias in the 15 papers of this study.
| Std_Eff | Coef. | Std.Err. | t | P\(\mathrm{>}\)| | [95%Conf.Interval] | |
| Slope | 0.9688542 | 0.8853529 | 1.23 | 0.288 | -0.9665812 | 2.8982515 |
| Bias | -4.6671241 | 2.0048754 | -2.25 | 0.048 | -9.0158771 | -0.0857823 |
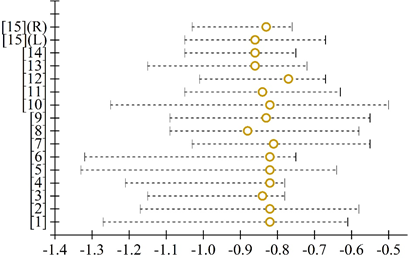
Figure 5 shows the results of the sensitivity analysis, all 16 studies fall within the confidence interval, basically concentrated around the middle line, indicating that the studies have little influence on the variability of the combined results, indicating that the results of the Meta-analysis of this study are more credible.
Frequency of interventions
Table 6 shows the subgroup analysis of the frequency of interventions for the COD indicator, which showed that the heterogeneity was low to moderate (\(I^2\)=44.8%, P=0.05), and a fixed-effects model was chosen. The combined effect size MD=0.11, 95% CI [0.05,0.41] did not pass the “0” value and P\(\mathrm{<}\)0.00001\(\mathrm{<}\)0.001, which resulted in a statistically significant and highly significant difference, i.e., static versus dynamic stretching had a highly significant effect on the athletes’ agility improvement. Among them, five papers had an intervention frequency of less than 3 times/week, and the results of subgroup analyses of the intervention cycles for the COD metrics showed that the heterogeneity was lower-middle (\(I^2\)=44.8%, p=0.12) comparable to the overall effect size, with an MD=0.22, 95% CI [0.11, 0.35] not passing through the value of “0” , the diamonds were located to the right of the null line and P=0.0004 \(\mathrm{<}\) 0.001, and the conclusions were in line with the overall findings. 6 papers (7 studies) had an intervention frequency of 3 times/week, and the heterogeneity (\(I^2\)=65.2%, P=0.05) was increased compared to the overall, with a P \(\mathrm{<}\) 0.00001, and the conclusions had a highly significant difference, which may be the source of the heterogeneity. 4 papers had an intervention frequency of 3 times /week or more, with a heterogeneity of 0, MD = 0.28, 95% CI [0.01, 0.52] without passing the “0” value, and P = 0.0025 \(\mathrm{<}\) 0.05, indicating that the results were statistically significant and significantly different, consistent with the study findings. In a comprehensive analysis, the frequency of intervention may be the source of the influence of heterogeneity.
| Study or Subgroup | Experimental | Control | Weight | Mean Difference IV, Random, 95%CI | |||||||
| Mean | SD | Total | Mean | SD | Total | ||||||
| 10.9.1\(\mathrm{<}\) 3 times / week | |||||||||||
| [11] | 4.22 | 0.08 | 10 | 4.28 | 0.08 | 10 | 7.9% | 0.05[-0.89,1.05] | |||
| [12] | 10.08 | 0.54 | 13 | 11.73 | 0.37 | 13 | 6.4% | -3.11[-4.24, -1.85] | |||
| [16] | 8.92 | 0.24 | 8 | 10.02 | 0.25 | 8 | 8.0% | -1.21[-2.22,-0.19] | |||
| [13] | 9.08 | 0.27 | 12 | 11.98 | 0.64 | 11 | 8.9% | -1.78[-2.55,-0.94] | |||
| [19] | 11.21 | 0.52 | 9 | 12.08 | 0.52 | 9 | 5.9% | 0.09[-0.75,0.99] | |||
| Subtotal(95%CI) | 52 | 51 | 37.1% | 0.22[0.11,0.35] | |||||||
| Heterogeneity: ch\(I^2\)=5.88, df=3.12(p=0.12), \(I^2\)=44.8%, Test for overall effect: Z= 3.52(p=0.0006) | |||||||||||
| 10.9.2=3 times / week | |||||||||||
| [2] | 11.11 | 0.47 | 16 | 11.36 | 0.81 | 16 | 7.6% | -0.44[-1.19,0.25] | |||
| [8] | 9.56 | 0.57 | 10 | 10.52 | 0.92 | 10 | 7.9% | -1.25[-2.22,-0.25] | |||
| [15] | 13.38 | 1.41 | 15 | 14.28 | 1.59 | 13 | 5.4% | -0.25[-0.88,0.43] | |||
| [7] | 9.16 | 0.31 | 5 | 10.08 | 0.72 | 5 | 5.5% | -1.48[-2.88,-0.05] | |||
| [4] | 9.83 | 0.85 | 7 | 10.11 | 0.79 | 7 | 4.6% | -0.15[-0.85,0.51] | |||
| [1]L | 10.02 | 0.76 | 5 | 10.95 | 0.81 | 5 | 4.9% | -3.33[-5.61,-1.23] | |||
| [1](R) | 8.78 | 0.95 | 6 | 9.56 | 0.88 | 6 | 4.1% | -3.55[-5.82,-1.44] | |||
| Subtotal(95%CI) | 64 | 62 | 40.0% | 0.31[0.22,0.48] | |||||||
| Heterogeneity: ch\(I^2\)=8.78, df=3.05(p=0.05), \(I^2\)=65.2%, Test for overall effect: Z= 5.51(p\(\mathrm{<}\)0.00001) | |||||||||||
| 10.9.3\(\mathrm{>}\)3 times / week | |||||||||||
| [5] | 10.15 | 0.49 | 15 | 10.55 | 0.51 | 15 | 3.5% | -0.42[-1.15,0.38] | |||
| [17] | 10.95 | 0.53 | 12 | 11.29 | 0.44 | 12 | 4.2% | -0.88[-1.75, -0.05] | |||
| [3] | 8.95 | 0.61 | 15 | 9.622 | 0.56 | 14 | 7.8% | -1.25[-1.95,-0.55] | |||
| [6] | 9.77 | 0.78 | 5 | 11.12 | 0.85 | 5 | 7.4% | -1.76[-2.78,-0.66] | |||
| Subtotal(95%CI) | 47 | 46 | 22.9% | 0.28[0.01,0.52] | |||||||
| Heterogeneity: ch\(I^2\)=0.18, df=1.0(p=0.77), \(I^2\)=0.0%, Test for overall effect: Z= 2.68(p=0.025) | |||||||||||
| Subtotal(95%CI) | 322 | 100% | 0.11[0.05,0.41] | ||||||||
|
Heterogeneity: Ch\(I^2\)=16.15, df=9(p=0.05), p=44.8% Test for overall effect: Z= 6.88(p\(\mathrm{<}\)0.00001)
Test for subgroup differences: =Ch\(I^2\)=1.78, df=2(p=0.45), \(I^2\)=0.0% |
|||||||||||
Intervention cycles
Table 7 shows the subgroup analysis of intervention cycles for COD indicators, with overall heterogeneity being lower to moderate (\(I^2\)=42.7%, P=0.09), MD=0.27, 95% CI [0.22,0.39] not passing through the value of “0” and P\(\mathrm{<}\)0.00001, indicating statistically significant findings and a very significant difference. 10 literatures with an intervention period \(\mathrm{\le}\)15 weeks had a 1% increase in heterogeneity (\(I^2\)=43.2%, p=0.09) compared to the overall with p\(\mathrm{<}\)0.00001, indicating a highly significant difference in results. There were 6 papers with intervention period greater than 15 weeks, and the heterogeneity (\(I^2\)=47.8%, P=0.11) also increased compared to the overall, P=0.005 \(\mathrm{<}\) 0.05, with a significant difference in the results. Taken together, the intervention period may be the source of the heterogeneity produced by COD.
| Study or Subgroup | Experimental | Control | Weight | Mean Difference IV, Random, 95%CI | |||||||
| Mean | SD | Total | Mean | SD | Total | ||||||
| 10.1 \(\mathrm{\leq}\) 15 weeks | |||||||||||
| [2] | 11.11 | 0.47 | 16 | 11.36 | 0.81 | 16 | 7.6% | -0.44[-1.19,0.25] | |||
| [17] | 10.95 | 0.53 | 12 | 11.29 | 0.44 | 12 | 4.2% | -0.88[-1.75, -0.05] | |||
| [3] | 8.95 | 0.61 | 15 | 9.622 | 0.56 | 14 | 7.8% | -1.25[-1.95,-0.55] | |||
| [7] | 9.16 | 0.31 | 5 | 10.08 | 0.72 | 5 | 5.5% | -1.48[-2.88,-0.05] | |||
| [16] | 8.92 | 0.24 | 8 | 10.02 | 0.25 | 8 | 8.0% | -1.21[-2.22,-0.19] | |||
| [6] | 9.77 | 0.78 | 5 | 11.12 | 0.85 | 5 | 7.4% | -1.76[-2.78,-0.66] | |||
| [19] | 11.21 | 0.52 | 9 | 12.08 | 0.52 | 9 | 5.9% | 0.09[-0.75,0.99] | |||
| [4] | 9.83 | 0.85 | 7 | 10.11 | 0.79 | 7 | 4.6% | -0.15[-0.85,0.51] | |||
| [1](L) | 10.02 | 0.76 | 5 | 10.95 | 0.81 | 5 | 4.9% | -3.33[-5.61,-1.23] | |||
| [1](R) | 8.78 | 0.95 | 6 | 9.56 | 0.88 | 6 | 4.1% | -3.55[-5.82,-1.44] | |||
| Subtotal(95%CI) | 88 | 87 | 60.0% | 0.26[0.15,0.44] | |||||||
| Heterogeneity: ch\(I^2\)=8.00, df=5.00(p=0.09), \(I^2\)=43.2%, Test for overall effect: Z= 6.11(p\(\mathrm{<}\)0.00001) | |||||||||||
| 10.2 \(\mathrm{>}\) 15 weeks | |||||||||||
| [11] | 4.22 | 0.08 | 10 | 4.28 | 0.08 | 10 | 7.9% | 0.05[-0.89,1.05] | |||
| [5] | 10.15 | 0.49 | 15 | 10.55 | 0.51 | 15 | 3.5% | -0.42[-1.15,0.38] | |||
| [12] | 10.08 | 0.54 | 13 | 11.73 | 0.37 | 13 | 6.4% | -3.11[-4.24, -1.85] | |||
| [8] | 9.56 | 0.57 | 10 | 10.52 | 0.92 | 10 | 7.9% | -1.25[-2.22,-0.25] | |||
| [15] | 13.38 | 1.41 | 15 | 14.28 | 1.59 | 13 | 5.4% | -0.25[-0.88,0.43] | |||
| [13] | 9.08 | 0.27 | 12 | 11.98 | 0.64 | 11 | 8.9% | -1.78[-2.55,-0.94] | |||
| Subtotal(95%CI) | 75 | 72 | 40.0% | 0.25[0.05,0.41] | |||||||
| Heterogeneity: ch\(I^2\)=5.29, df=3.00(p=0.11), \(I^2\)=47.8%, Test for overall effect: Z= 2.88(p=0.005) | |||||||||||
| Subtotal(95%CI) | 322 | 100% | 0.27[0.22,0.39] | ||||||||
|
Heterogeneity: Ch\(I^2\)=15.88, df=9(p=0.09), p=42.7% Test for overall effect: Z= 6.57(p\(\mathrm{<}\)0.00001)
Test for subgroup differences: =Ch\(I^2\)=0.95, df=1(p=0.35), \(I^2\)=0.0% |
|||||||||||
This study quantified the effect of static versus dynamic stretching on athlete agility, and Meta-analysis showed a high degree of heterogeneity, SMD = 0.11, which is a higher effect, with a significant difference in results at P \(\mathrm{<}\) 0.00001 \(\mathrm{<}\) 0.05. The results were significantly different for each literature exclusion, and the results were more robust. Intervention frequency \(\mathrm{<}\)3 times/week, 3 times/week, \(\mathrm{>}\)3 times/week, intervention cycle \(\mathrm{\le}\)15 weeks and \(\mathrm{>}\)15 weeks showed significant differences. The results of the study indicate that static stretching with an intervention frequency of about 3 times for an intervention period of about 15 weeks has a more significant effect on COD than dynamic stretching.
Comparing dynamic stretching with static stretching, dynamic stretching can better improve human performance in agility maneuvers and have a positive effect on performance, while static stretching may have some negative effects.
Female athletes, especially those in the same field of competitive sports, may be less affected by SS because of the low stiffness of their tendon units. Stiffness is a characteristic of tendon, mainly related to the ability to transmit force, the higher the stiffness, the faster the rate of transmission, the lower the stiffness, the slower the rate of transmission, so the effect on women is relatively small, and there is no statistically significant difference, but due to the relatively limited research involving the effect of static stretching on agility in women, further research is still needed to be done to obtain evidence to illustrate.
In the process of dynamic stretching, attention should be paid to the dosage effect. If a larger amount is used in the general warm-up process and then dynamic stretching is carried out, it is easy to be counterproductive, which will make the human body’s RPE (Subjective Fatigue Rating Scale) scale show a higher level, which is not conducive to the performance of subsequent exercise at a higher level.
The search strategy was only implemented in four databases, only published Chinese data and English data were considered as limitations of this review, and the limited number of literature that met the screening criteria due to limitations in Meta-analysis methods, number of databases, and screening criteria, and there were problems such as missing some of the important studies or invalid studies. In addition, it is important to recognize that even though the meta-analyses examined similar research questions, they showed methodological differences in search strategies and selection criteria as well as application of analytical methods.
Each piece of literature studies different indicators of sensitivity quality endings, in this paper, only the indicators of COD agility were selected to be analyzed, and other indicator effects were not addressed, the included literature was highly heterogeneous, and a random-effects model was used, and limited literature was included in the subgroup analyses, and only some subgroup analyses were conducted on the average age of sensitivity quality, the period of interventions, the frequency of interventions, and the characteristics of subjects, and no analyses were conducted on the gender of the subjects, the intensity of training, training intervals, training venues, and the characteristics of the subjects. , training interval, and training site were analyzed, and the subgroup literature was small and heterogeneous.
Dynamic and static stretching improves agility in athletes.
Static stretching with an intervention period of about 15 weeks and an intervention frequency of about 3 times was the most effective with dynamic stretching.
Compared with static stretching, dynamic stretching before training strengthens muscle stiffness and potential energy, and dynamic stretching can better improve the human body’s athletic performance in agility-type movements.
The improvement of agility was significantly higher with stretching than without stretching.
For agility movements, dynamic rather than static stretching should be used prior to exercise. Dynamic stretching is effective in mobilizing the body’s physiological systems as well as fully stretching the joints for mobility, but care should be taken to combine it with the amount of training in the general warm-up.
Static stretching should not be performed before explosive sports, as it can easily affect the subsequent performance, and female athletes should also examine static stretching in a conservative manner.
In athlete agility training, programmed stretching training should not be used only. Randomized agility training should be added to the application of stretching training, so that athletes can send out random signals simulating game scenarios according to the coaches and react accordingly, thus enhancing the athletes’ resilience on the field of play.
The quality of agility is the embodiment of the comprehensive sports various physical qualities, soccer players in agility training, should be carried out after the warm-up of the training program, before the strength training, when the athlete’s nerves are in a state of excitement, full of physical strength.