
With the continuous improvement of the competitive level of basketball players, the level gap between various sports teams or athletes will also continue to narrow. When basketball players are in a comparable state of physical fitness and technical and tactical levels, the outcome of basketball games is often determined. The mental quality of the athlete on the field of play [1,5, 17]. Relevant experts and scholars have found through research that for athletes with lower sports levels, their psychological factors account for about 20% of their impact on motor skills, while high-level athletes are just the opposite. The impact of their psychological factors on sports skills is about accounting for nearly 80% [4, 19]. Therefore, the training of high-level athletes should not only be more scientific in training methods and means, but also pay attention to the cultivation and adjustment of the athletes’ psychological quality [15, 2].
In a high-level basketball game, players not only need to bear the consumption of physical energy, but also bear players from different aspects. Athletes need to use reasonable and effective methods or means to control their psychological emotions in the competition, so as to be able to truly exert their competitive state level. However, according to the research results of the literature, there are few studies on psychological factors on athletes’ performance on the court [7,9]. Basketball games are not only a test of physical fitness and skill level, but also psychological factors. The influence of psychological factors is often the key to determining the outcome of the game, psychological factors are increasingly valued by coaches. Therefore, through theory and practice, we find out the psychological factors that can affect players’ shooting percentage and key ball handling, and formulate a scientific and effective psychological training plan, which is an important guiding direction for improving the competitive level of professional basketball players [20,18].
From the perspective of basketball culture, different cultural characteristics of different nationalities in the world have formed different basketball styles and schools. The American’s individualism, heroism, individuality and creative cultural personality show that the basketball style is characterized by excellent personal skills, forming random cooperation, concise and effective, and flexible under personal strong attack. Europeans are frank and confident, pay attention to practical performance, pay attention to skills, and do not get emotional [13]. Their basketball style is overall cooperation, orderly, reasonable and steady. Asians are smart, dexterous, follow the tradition and rely on the cultural personality of the group. The basketball style displayed by Asians is fast and flexible, accurate and balanced, but to a certain extent it appears rigid and mechanical. It can be said that different cultural personalities of basketball players have formed their different basketball styles and schools, different basketball concepts, and different basketball consciousness levels. In short, personality influences and restricts the development level of basketball consciousness. From the perspective of psychology, personality psychological factors generally include emotion, which refers to a kind of positive or negative, positive or negative psychological tendency shown by people when they are stimulated by the outside world, such as liking or not liking, being willing or unwilling, needing or not needing, and being happy or not [6]. Will is the most prominent manifestation of human subjective initiative.
Temperament refers to a person’s typical and stable psychological characteristics, mainly manifested as the dynamic characteristics of psychological activities such as speed, stability, strength and flexibility in the psychological process of people. Motivation refers to the internal reason that motivates people to take action for a certain purpose and requires a certain effect [8,12]. It arises from people’s subjective consciousness, and the main factors that constitute learning motivation are the consciousness of learning and the direct interest in learning. Self-awareness refers to an individual’s understanding of himself and the relationship between himself and the surrounding things, and it is also the unity of an individual’s understanding of himself and his treatment of himself.
In summary, the use of psychological training methods to cultivate basketball awareness of basketball players will be the main subject of basketball teaching and training today and in the future. Psychological training directly, indirectly, and accelerates the formation and development of basketball awareness. The systematic psychological training can not only shape the good psychological quality of athletes, but also solve some psychological problems. It is closely related to basketball consciousness.
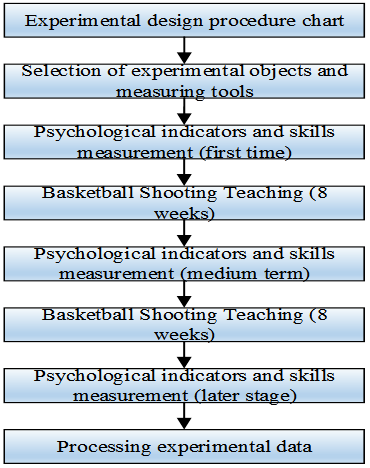
In the middle of teaching (the eighth week) and the later period (the sixteenth week), the two-teaching classes were measured again for the shooting percentage, state anxiety, and athlete level [3]. During the whole experiment, reasonable emotions were required. The therapy experimental group and the control group tried their best not to practice one-handed over-shoulder shooting techniques after class, so as to strive for the reliability of the experimental results (Figure 1).
According to the analysis results in Table 1, the experimental group and the control group of rational emotion therapy are basically at the same level in the pre-experiment level homogeneity test, the shooting rate, state anxiety, and stress total scores are basically at the same level, which meet the statistical requirements [14].
| Experience group | Control group | t | P | |
|---|---|---|---|---|
| State anxiety | 42.73\(\mathrm{\pm}\)6.726 | 43.86\(\mathrm{\pm}\)8.482 | -0.606 | 0.544 |
| Shooting percentage | 2.55\(\mathrm{\pm}\)1.739 | 2.46\(\mathrm{\pm}\)1.422 | 0.375 | 0.705 |
| Total pressure score | 51.81\(\mathrm{\pm}\)8.141 | 50.00\(\mathrm{\pm}\)5.217 | 1.117 | 0.265 |
In the comparison of various dimensions of the athlete level, it was found that there were significant differences in the two dimensions of life and life events, the differences in social and negative events were close to significant, and the other dimensions of learning, development of family, and positive events and life trivia (no significant differences were shown. The differences in overall athlete level scores between the two groups tended to be marginally significant, see Table 2 and Table 3.
| Experience group | Control group | t | P | |
|---|---|---|---|---|
| State anxiety | 39.44\(\mathrm{\pm}\)5.866 | 45.76\(\mathrm{\pm}\)8.766 | -3.521 | 0.001 |
| Shooting percentage | 4.53\(\mathrm{\pm}\)1.266 | 3.53\(\mathrm{\pm}\)1.962 | 2.535 | 0.013 |
| Dimension | Experience group | Control group | t | P |
|---|---|---|---|---|
| Study | 53.25\(\mathrm{\pm}\)5.323 | 53.91\(\mathrm{\pm}\)3.695 | -0.624 | 0.536 |
| Life | 49.88\(\mathrm{\pm}\)5.644 | 52.47\(\mathrm{\pm}\)5.115 | -2.044 | 0.043 |
| Development | 48.86\(\mathrm{\pm}\)4.186 | 49.75\(\mathrm{\pm}\)3.146 | -1.003 | 0.322 |
| Social contact | 49.96\(\mathrm{\pm}\)7.135 | 52.82\(\mathrm{\pm}\)5.678 | -1.856 | 0.066 |
| Family | 43.15\(\mathrm{\pm}\)2.547 | 43.36\(\mathrm{\pm}\)2.494 | -0.286 | 0.777 |
| Positive event | 44.56\(\mathrm{\pm}\)7.582 | 44.43\(\mathrm{\pm}\)5.765 | 0.055 | 0.956 |
| Negative events | 46.53\(\mathrm{\pm}\)4.482 | 48.15\(\mathrm{\pm}\)3.146 | -1.792 | 0.077 |
| Life events | 47.53\(\mathrm{\pm}\)3.223 | 49.15\(\mathrm{\pm}\)2.547 | -2.385 | 0.020 |
| Trivia of life | 51.46\(\mathrm{\pm}\)5.236 | 52.75\(\mathrm{\pm}\)3.333 | -1.223 | 0.222 |
| Total pressure score | 49.15\(\mathrm{\pm}\)3.876 | 50.62\(\mathrm{\pm}\)2.486 | -1.875 | 0.066 |
Based on the analysis and comparison of various algorithms for deep learning convolutional neural network target detection. The emergence of YOLO has further improved the processing speed of target detection, but YOLOv1 and YOLOv2 are not rich enough in multi-scale descriptions, resulting in low accuracy; in YOLOv3 in 2018, the problem of insufficient multi-scale was solved. In the end, this paper chooses Faster-RCNN with high robustness and slightly slower speed as the target detection algorithm.
With a total of 16 pixels in the circumference. It is assumed in the above that international financial cooperation can significantly improve the level of infrastructure construction. Therefore, this paper analyzes the linear relationship between international financial cooperation and infrastructure construction through a multiple regression model [10]. Compare the point q on the circle, with The gray value of point p, the threshold t is set, we consider these two points to be different. If there are consecutive n pixel points q, then p is considered as a feature point: \[\label{GrindEQ__1_} |I(p)-I(q_{i} )|t ,\tag{1}\]
This paper establishes a multiple regression equation for the impact of international financial cooperation on infrastructure construction: \[\begin{aligned} \label{GrindEQ__2_} Z_{it} =&\alpha +\beta _{1} ({\rm \; inve\; }-{\rm \; fund\; })_{i,t-1} +\beta _{2} ({\rm \; Pop\; }-{\rm \; density\; })_{i,t-1} +\beta _{3} ({\rm \; Fina\; }-{\rm \; deve\; })_{i,t-1} \\ &{+\beta _{4} ({\rm \; Lend\; }-{\rm \; rate\; })_{i,t-1} +\beta _{5} ({\rm \; Trade\; }-{\rm \; facil\; })_{i,t-1} } {+\beta _{6} ({\rm \; Inter-user\; -\; rate\; })_{i,t-1}}\\ &{ +\beta _{7} (P-GDP)_{i,t-1} } +\beta _{8} ({\rm \; Elem-edu\; })_{i,t-1} +\beta _{9} ({\rm \; Hesl\; }-\exp e)_{i,t-1} \\& +\beta _{10} ({\rm \; Birth\; }-{\rm \; rate\; })_{i,t-1} +\varepsilon _{it} . \end{aligned}\tag{2}\]
The variables are the number of sovereign fund investments, population density, level of financial development, domestic lending rates, trade facilitation level, and proportion of Internet users. Based on the ORB feature extraction algorithm established above, international financial cooperation on the financial foundation. The impact of facility construction takes the number of sovereign fund investments as the main variable of the study, and the sample data comes from the Sovereign Wealth Fund Research Institute [11]. By comparing the completeness and typicality of the data in various aspects of the number of sovereign fund investments, the final benchmark is the number of investment projects.
So as to avoid the corner points obtained on the image from being too dense. \[\label{GrindEQ__3_} V=\max \sum {\rm pixe1\; values\; }-p|,|{\rm \; value\; }-p>t ,\tag{3}\] where pixel values represents the pixel values of 16 points.
The centroid within the radius of r is used to determine the direction of the feature points, so as to realize the rotation of the feature points without deformation. Moments are defined as the formula: \[\label{GrindEQ__4_} {\rm m}_{pq} =\sum\limits_{x,y\in r}X^{p} y^{q} I(x,y) .\tag{4}\]
Then the position is the formula: \[\label{GrindEQ__5_} C=\left(\frac{m_{10} }{m_{00} } ,\frac{m_{01} }{m_{00} } \right) ,\tag{5}\] \[\label{GrindEQ__6_} \theta ={\rm arctan}\left[\frac{m_{01} }{m_{00} } \Big/\frac{m_{10} }{m_{00} } \right]={\rm arctan}\left[m_{01} /m_{10} \right] .\tag{6}\]
The algorithm first expresses the similarity by converting high-dimensional. A given N high-dimensional data, the similarity of the conditional probability, the formula is as follows: \[\label{GrindEQ__7_} p_{ji} =\frac{\exp \left(-\left\| x_{i} -x_{j} \right\| ^{2} /2\sigma _{i}^{2} \right)}{\sum\limits_{k\ne i}\exp \left(-\left\| x_{i} -x_{k} \right\| ^{2} /2\sigma _{i}^{2} \right)} .\tag{7}\]
For low-dimensional data points corresponding to high-dimensional data points, the mean square error of a given Gaussian distribution is: \[\label{GrindEQ__8_} q_{ji} =\frac{\exp \left(-\left\| x_{i} -x_{j} \right\| ^{2} \right)}{\sum\limits_{k\ne i}\exp \left(-\left\| x_{i} -x_{k} \right\| ^{2} \right)} .\tag{8}\]
The NSGA-II algorithm is currently the most widely used and influential multi-objective optimization algorithm. Compared to the traditional NSGA, its main advantages include improved sorting efficiency, the introduction of elitism, and a novel crowding distance mechanism to maintain diversity among solutions. The crowding distance (also referred to as the crowding factor) plays a key role in ensuring a well-distributed Pareto front. It is calculated by estimating the perimeter of a hyper-rectangle formed by neighboring individuals in the objective space. This distance helps prioritize solutions located in less crowded regions, encouraging exploration and distribution across the Pareto front. An illustration of this concept is provided in Figure 2, where the crowding factor represents the extent of the search space occupied by adjacent solutions.
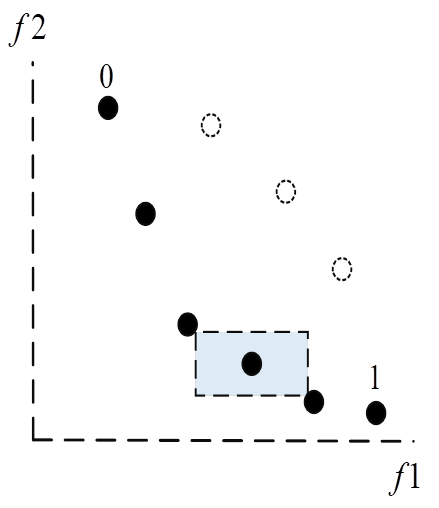
Calculate the crowding degree of other individuals in the population: \[\label{GrindEQ__9_} i_{d} =\sum\limits_{j}^{m}\left(\left|f_{j}^{i+1} -f_{j}^{i-1} \right|\right) .\tag{9}\]
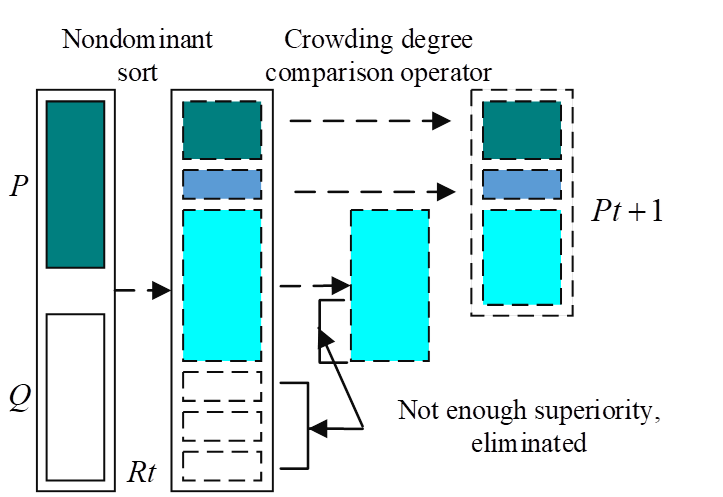
The specific elite schematic diagram is shown in Figure 3.
The basic idea is to use the conditional probability to represent the similarity between each data point, and the advantages and disadvantages of the embedding effect. It is evaluated by the KL divergence of the joint probability distribution of the embedded space and the original space, the KL divergence function is used as the objective function, and the gradient descent method is used to minimize the objective function, and finally the convergence result is obtained.
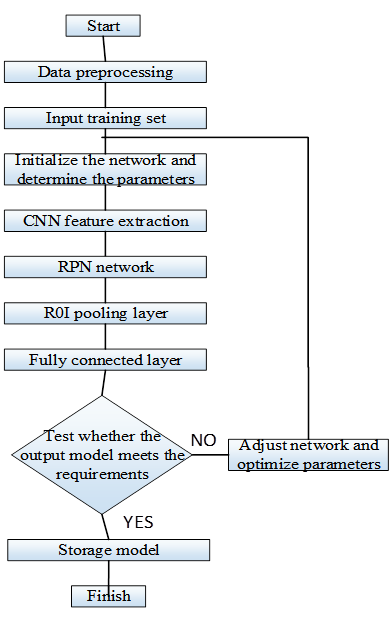
In this paper, a model based on Faster-RCNN is used for player object detection in basketball game videos. The main process of Faster-RCNN model generation is shown in Figure 4.
Hence the basketball players maintain a good and stable emotional state during training or competition, which is an important manifestation of their full use of their competitive level and skills and tactics. An athlete’s ability to resist pressure in competition or training is one of the important conditions that affects his technical and tactical performance.
In order to study the influence of mental fatigue on basketball players’ decision-making, this study adopts the research method with the experimental method as the core and a combination of various research methods, including the literature method.
Based on the review of relevant literature, combined with the purpose of this research, we conducted interviews with experts and scholars who studied sports psychology and sports skills acquisition to understand the influencing factors of basketball players’ sports decision-making and the basic situation of sports-induced mental fatigue, and listened to experts and scholars on this topic [16]. When screening the decision-making videos needed in the sports decision-making system, and editing according to passing, shooting, and breakthrough, consult the advice of basketball experts to determine the number of starting frames and ending frames. At the same time, ask basketball experts to determine the more suitable judgment (passing, shooting, breakthrough) for each task according to the actual situation.
After the subjects arrived at the experimental site, they were given experimental explanations and a questionnaire survey. First, conduct a simple reaction time test, and then conduct decision-making task practice. After being familiar with the “Basketball Decision-Making Test System”, conduct a formal test according to the guidance of the main tester. After the test is completed, the test results are counted. Through the 45-min Stroop cognitive task, the subjects were induced to be mentally fatigued. When conducting the mental fatigue experiment, remind the subjects to ensure the accuracy and speed during the task, and they need to respond quickly and correctly. After the 45-min Stroop task, the basketball decision-making task was performed again to compare the accuracy of decision-making and the changes in response time before and after mental fatigue.
The ABQ questionnaire data, decision-making accuracy rate, decision-making response time and other data were input into Excel software, and then imported into SPSS19.0 statistical software. After excluding invalid data, the influence of mental fatigue on basketball decision-making was explored by means of T test and variance analysis. Twenty-six male athletes in good physical condition who volunteered to participate in Xuchang College were recruited for this study, and they were divided into two groups according to the participants’ basketball years. The main exclusion conditions of the study: staying up late for a long time before the experiment; consuming caffeine 3 hours before the experiment; drinking alcohol 72 hours before the experiment to the start of the experiment; completely ignorant of the rules of the basketball game, and having a long time before the official start of the experiment stressful cognitive tasks.
Cognitive decision-making is considered analytical decision-making, emphasizing that decision-making is a high-level cognitive process. It is believed that there is a process of logical thinking in decision making. Intuitive decision-making mainly believes that it is a quick decision made by athletes without a logical thinking process based on their own training and competition experience in complex and changeable sports situations. Researchers generally believe that there will be a certain time difference between the two decisions due to different thinking styles. Therefore, in the previous decision-making research, the presentation of sports scene materials, whether using pictures or videos, is reflected by the length of the presentation time of the materials. Anchor points are a way to represent candidate regions, an anchor point corresponds to a point in the feature map and has an associated scale and aspect ratio, as shown in Figure 5.
Finally, the model with 20,000 iterations was selected as the target detection model. The actual detection effect of the basketball game is shown in Figure 6. From left to right, the experimental results of the model generated by training with 5,000, 20,000, and 30,000 iterations are respectively. In this experiment, the binary classification method SVM is also used to identify and classify five basketball footwork. The algorithm maps the basketball footwork training set data to a high-dimensional area through nonlinear mapping, and defines a support vector and hyperplane. Correspondingly, to separate the two types of basketball footwork data. In the figure, the yellow triangles and orange circles represent two types of data, respectively, and the solid line C is defined as the hyperplane separating the two types of basketball footwork data. In the sample data, the yellow triangle closest to the solid line A and the one closest to the solid line B The orange circle is the support vector, as shown in Figure 6. Among them, the linear hyperplane can be expressed as: \[\label{GrindEQ__10_} f(x)=\varpi ^{T} x\pm a .\tag{10}\]
In this experiment, by analyzing the original signal waveforms of the five basketball footwork, it is found that the peak value and trough value of the five basketball footwork movements are not very different, and the contribution to the recognition of the five basketball footwork may not be large, so this experiment The two features of minimum and maximum are removed, and the two features of mean and standard deviation are retained. Finally, the 12 features obtained after feature selection on the basketball footwork data. In addition, the selection of different K values also affects the accuracy of KNN’s recognition of basketball footwork. Figure 7 show the accuracy of basketball footwork recognition with different K values. After the above experimental analysis, when the K value is 5 and the feature combination is used, the overall accuracy of basketball footwork recognition is the highest, reaching 80.7%.
As an improved RCNN algorithm, Faster-RCNN inherits the advantages of the first-generation RCNN and the second-generation Fast-RCNN and improves the shortcomings. The biggest highlight is that based on Faster-RCNN target detection, operations such as feature extraction, candidate region selection, regression classification, etc., which are all integrated into a deep network, and the end-to-end network structure is successfully achieved. The framework of Faster-RCNN is mainly composed of: convolution layer, regional proposal network layer (RPN), feature map candidate region frame adjustment (Roi Pooling) classification and regression. As shown in Figure 8.
A schematic diagram of the regional proposal network is shown in Figure 9.

Feature candidate area frame adjustment, Roi pooling is mainly to solve the problem that the size of the feature map may be different when the feature map output from the previous layer is transferred to the fully connected layer, and a fixed size is obtained by adding the sampling of Roi pooling. The main idea is to solve the problem of different image sizes through the pyramid structure. Roi pooling converts proposals of different sizes into outputs of the same size through downsampling, as shown in Figure 10.

There are certain standards for the selection of materials for each sport, and different sports are suitable for athletes of different physiques. Basketball is no exception. For basketball, body shape is also closely related to basketball level. Differences in body shape will cause differences in exercise effects. The indicators that reflect the body shape are: height, sitting height, foot arch height, leg length, arm length, hand length, head length, neck length, foot length and other length indicators, chest circumference, arm circumference, leg circumference, waist circumference, hip circumference Isometric indicators, head width, shoulder width, hip width and other width indicators and body weight, sebum thickness and other body fulfillment indicators, etc. Because this experiment is a freshman of the general department, the basketball foundation is relatively poor, and because of the limited equipment for class, only the physical indicators that are easy to measure are selected for measurement. The body shapes of the two groups of athletes are shown in Table 4:
| Group | N | \(X\pm S\) | T | P | |
|---|---|---|---|---|---|
| Height | Control group | 40 | 169.7335\(\mathrm{\pm}\)5.02447 | 1.147 | >0.05 |
| Experience group | 40 | 169.5433\(\mathrm{\pm}\)5.36124 | |||
| Weight | Control group | 40 | 65.1335\(\mathrm{\pm}\)4.84113 | 1.268 | >0.05 |
| Experience group | 40 | 66.1525\(\mathrm{\pm}\)5.89901 |
With a good level of basketball skills, after training, it will achieve twice the result with half the effort, but if you don’t have a basketball foundation at the beginning, after the same time, the degree to which the level of basketball has improved is definitely not the same. The specific results are shown in Table 5:
| Group | N | \(X\pm S\) | T | P | |
|---|---|---|---|---|---|
| Dribble (sec) | Control group | 40 | 19.5\(\mathrm{\pm}\)0.58 | 0.37 | >0.05 |
| Experience group | 40 | 19.5\(\mathrm{\pm}\)0.75 | |||
| One-handed over-the-shoulder shot(s) | Control group | 40 | 2.15788\(\mathrm{\pm}\)0.02447 | 0.434 | >0.05 |
| Experience group | 40 | 1.98646\(\mathrm{\pm}\)0.36125 | |||
| Half-court round-trip dribble layup (seconds) | Control group | 40 | 37.4345\(\mathrm{\pm}\)0.14144 | 0.237 | >0.05 |
| Experience group | 40 | 38.6575\(\mathrm{\pm}\)0.29905 |
From the data statistics table in the above table, we can see that the test data of the two groups of athletes’ dribbling, one-minute one-handed shoulder shot and half-court round-trip dribbling layup were obtained by T test.
Correct posture is half the battle. The more stable the technical movements, the greater the chance of success and the greater the impact on future learning. The test of basketball skill level, the test results are shown in Table 6:
| Group | N | \(X\pm S\) | T | P | |
|---|---|---|---|---|---|
| Dribble (sec) | Control group | 40 | 67.77\(\mathrm{\pm}\)8.66 | 3.37 | >0.05 |
| Experience group | 40 | 68.54\(\mathrm{\pm}\)7.88 | |||
| One-handed over-the-shoulder shot(s) | Control group | 40 | 66.76\(\mathrm{\pm}\)7.56 | 3.43 | >0.05 |
| Experience group | 40 | 67.88\(\mathrm{\pm}\)8.15 | |||
| Half-court round-trip dribble layup (seconds) | Control group | 40 | 63.53\(\mathrm{\pm}\)6.56 | 3.23 | >0.05 |
| Experience group | 40 | 62.85\(\mathrm{\pm}\)5.94 |
From the data statistics table in the above table, we can see that the test data of the two groups of athletes’ dribbling, one-minute one-handed shoulder shot and half-court round-trip dribbling layup were obtained by T test.
Attitude refers to the expression of emotions and ideas that people like or dislike about something based on their past experience and their own imagination. Attitudes will change with the passage of time and the occurrence of things. In the process of physical education, it is necessary to measure athletes’ physical attitudes in a timely manner, because the changes in athletes’ physical attitudes can reflect the content of physical education and physical education teaching. What kind of impact the method will have on athletes can test whether the teaching content and methods are reasonable, and provide a more objective basis for improving teaching effects and teaching methods. In this experiment, the sports attitude evaluation of the two groups of athletes before the experiment is shown in Table 7:
| Group | N | \(X\pm S\) | T | P | |
|---|---|---|---|---|---|
| Sports attitude (points) | Control group | 40 | 6.96\(\mathrm{\pm}\)1.64 | 1.88 | >0.05 |
| Sports attitude (points) | Experience group | 40 | 7.14\(\mathrm{\pm}\)1.55 | 1.55 | >0.05 |
This study presents a systematic approach to basketball footwork classification by integrating machine learning techniques with combinatorial optimization. The experimental results demonstrate that SVM effectively maps basketball footwork data into a high-dimensional space, enabling the separation of different movement patterns with a well-defined hyperplane. Additionally, KNN achieves its highest classification accuracy (80.7%) when K=5K = 5K=5, highlighting the importance of parameter tuning in machine learning applications for sports analysis.A combinatorial approach is employed to optimize feature selection, addressing the challenge of high-dimensional data representation. By evaluating all possible feature subsets using the combinatorial formula, an optimal feature set is determined, balancing classification accuracy and computational efficiency. This method effectively eliminates redundant features while preserving critical information for footwork recognition.
This research was supported by the Scientific and Technological Innovation Team Project titled “Research on ’Digital Empowerment’ in the Quality of School Physical Education”, under Fund Number: KYTD23309.