
Intelligent construction technology provides an integrated approach to connect the stages of design, construction, and operation through digital modeling, data sharing, and collaborative work, and is a new technological tool with features such as digitization and visualization, which can effectively improve the deficiencies of construction site information management [19, 12]. Intelligent construction technology includes automation, Internet of Things and artificial intelligence technology, which can improve the efficiency and quality of building construction. Intelligent construction technology can be used to design the optimal layout of these systems to ensure that they are coordinated with the overall design of the building, optimize the appearance of the building, insulation, lighting, and reduce energy consumption [26, 5]. Smart construction mainly includes digital modeling and design, automation and robotics, sensors and the Internet of Things, virtual and augmented reality, etc., which use modern technologies and digital tools to take building project management and execution to a higher level, thus increasing efficiency, reducing costs, and providing a safe working environment. Intelligent construction is based on building information modeling, which is a three-dimensional digital model that includes building geometry information, attribute information, and associated data [31, 16, 8, 2].
Smart construction technology features include, integration, collaborative work, visualization, and data-driven [23]. Integration refers to the fact that smart construction technology integrates all the information of a building project, enabling designers, engineers, architects, and contractors to work together on the same digital platform, real-time collaboration refers to the fact that smart construction technology allows multiple team members to access and edit project information at the same time, ensuring that all parties keep up-to-date with the most current designs and data, and visualization represents the fact that smart construction technology provides a visual building model so that team members are can better understand and evaluate the design, and data-driven means that smart construction technology transforms the building design and management process into a data-driven process that allows decisions to be made based on data [1, 22].
Compared with traditional construction technology, the reasonable introduction of intelligent construction technology in the process of engineering construction can not only integrate the green building design concept through engineering design, construction, and post-operation and maintenance, but also achieve the design goal of building energy conservation and consumption reduction, thereby effectively making up for the shortcomings of traditional construction technology, realizing the coordinated development of buildings and the natural environment, creating a healthier and more comfortable living environment, and promoting the sustainable development of China’s construction industry [15, 29].
On the other hand, the crisis of global warming and resource scarcity seriously affects the survival and development of human beings, and has become a focal point of the international community’s general concern, and the World Climate Conference held in Copenhagen in 2009 aimed to seek ways to reduce energy consumption in buildings and reduce carbon emissions to solve global warming [9, 21]. In the face of the increasingly severe situation of environmental pollution and climate change, green building as an important means of realizing sustainable development has gradually attracted people’s attention [25]. Green building is one of the key means to achieve the goal of carbon neutrality, and it is also a construction form that needs to be developed in depth in the current urbanization process. By implementing the construction concept of green building, it can give the building the attribute of “people-oriented”, and at the same time, it can significantly reduce the carbon emissions in the whole life cycle of the building, which is of great significance for realizing the goal of “dual-carbon” [34, 7].
The application of intelligent construction technology in construction projects helped achieve informatization in construction safety management, improved visibility, communication, and coordination, effectively predicted construction risks, and ensured smooth information flow for managerial communication. Baduge et al. [3] introduced the latest research and practical advancements in artificial intelligence, deep learning, and other technologies in the construction field from conceptual design through the implementation process, and discussed future directions for intelligent technologies in construction. Sacks et al. [24] noted that the use of digital information technologies in architecture dated back to dissertation research in the 1970s, and highlighted that digital building information systems underwent extensive periods of testing and refinement before widespread practical application. Li and Cao [20] described the pivotal role of Building Information Modeling (BIM) in smart city development, particularly in ensuring the efficiency and completeness of information exchange throughout the smart construction process, and supporting lifecycle decision-making. Jiang et al. [17] explored a digitally-enabled smart MiC system (DT-SMiCS), which supported on-site assembly redesign and integrated data such as personnel identity, location, cost, and construction progress using digital twin technology. Woodhead et al. [27] presented a longitudinal analysis revealing that Internet of Things (IoT) technologies brought transformative changes to the construction industry, describing these innovations as a wave of disruption and providing forward-looking insights for corporate transformation. Collectively, the reviewed scholars described the evolution of digital and AI technologies in construction, analyzed their application performance, and outlined future research directions grounded in intelligent construction advancements.
The promotion of green buildings emerged as a key initiative within the construction sector to support national goals of energy conservation, emission reduction, and sustainable development – particularly aligned with the “dual carbon” objectives. Zhang et al. [33] emphasized the need to promote green building concepts due to the construction industry’s high energy consumption and greenhouse gas emissions, and analyzed the indicator framework to enhance China’s green building assessment systems. Darko et al. [6] investigated the drivers behind green building technologies through expert surveys and found that energy efficiency, environmental impact, water efficiency, occupant health, and comfort were central motivations. Geng et al. [10] assessed green buildings in terms of indoor environmental quality, user satisfaction, and energy performance, and identified discrepancies between certified energy efficiency levels and actual outcomes. Hwang et al. [14] identified key factors influencing green building construction efficiency, including worker experience, green technologies, design modifications, and work planning. Gui and Gou [11] reviewed green building certification systems and analyzed performance indicators in Australia’s NABERS system—such as energy intensity, emissions, indoor environment quality, and water usage—comparing it with global systems to conclude NABERS provided regionally adaptable assessments. Chel and Kaushik [4] outlined strategies for improving building energy efficiency, including passive design, efficient materials, equipment, and renewable integration across the lifecycle. These studies collectively provided comprehensive insights into green building technologies, their assessment frameworks, performance metrics, and policy implications for the construction sector and environmental regulators.
After analyzing the feasibility of intelligent construction technology in green building design, this paper uses BIM software to model the designed building and optimize the green performance of the building based on intelligent construction technology to ensure the realization of building energy efficiency. Subsequently, a green building energy efficiency assessment index system including energy efficiency, economic efficiency and environmental efficiency is proposed, and the fuzzy Borda method is used to subjectively assign weights to the indexes, and the weights of the indexes are corrected and processed by the CRITIC method. Then the object element topology model is used to calculate the correlation function and correlation degree of energy saving benefits to realize the comprehensive assessment of green building energy saving benefits. In this study, two research cases, namely, hotel and residential building, are validated to detect the changes in energy consumption of the buildings after green retrofit and evaluate the energy saving benefits in order to explore the effectiveness of the implementation of the method.
Intelligent construction technology [32] refers to the integrated fusion of sensing technology, communication technology, data technology, construction technology and project management and other knowledge, the construction of buildings and their construction activities, such as safety, quality, environmental protection, progress, cost and other content of the theory, method, process and technology of perception, analysis, control and optimization, in order to promote safety, high quality, green, efficient construction. Intelligent construction technology is a new mode of construction that integrates information technology and construction engineering. Digital technology is the foundation of intelligent construction, and on the basis of digitalization, construction requires standardized and visualized building models, digital network interaction platforms, and an integrated digital chain drive that carries out the whole industry chain from decision-making to operation and maintenance. The development of intelligent construction requires technological progress in four aspects, including integrated engineering software for the whole industry chain, intelligent site engineering Internet of things, human-machine integration of engineering machinery and intelligent decision-making driven by engineering big data. The characteristics of intelligent construction include six aspects: data-driven, online connection, closed-loop regulation, continuous optimization, cognitive response, and collaborative sharing. Data is the core of intelligent construction and core competitiveness. Connection is the foundation of smart construction, and everything in the project is interconnected through IoT technology. Overall, intelligent construction is carried out in the whole life cycle of construction projects, promoting the construction industry to realize industrialization and upgrade, and ultimately to intelligent construction.
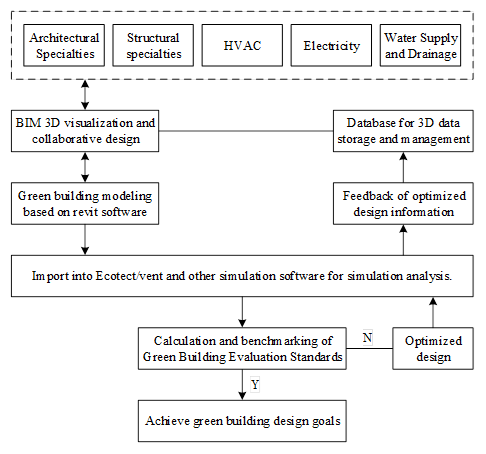
The process of green building design and energy efficiency optimization based on intelligent construction technology is shown in Figure 1. It can help designers and decision makers understand the green performance of the building more comprehensively, optimize the energy-saving design scheme, and improve the energy efficiency and environmental protection level of the building. Firstly, BIM software is used to model the building, including information on building structure, materials, and equipment. At the same time, data related to green performance, such as energy consumption, material properties, and environmental parameters, are collected. Simulate and analyze the green performance based on the modeling data, including energy simulation, lighting analysis, indoor environment simulation, etc. Evaluate the performance of the building in terms of energy consumption, lighting effect, indoor comfort, etc. through the simulation results. Based on the results of the performance simulation, identify the green performance problems of the assembled building, such as excessive energy consumption, insufficient lighting, and excessive indoor temperature. Corresponding optimization measures are then proposed, including adjusting design parameters, improving material selection, and optimizing system configuration. The energy-saving solutions are evaluated, including economic and environmental impact considerations, to provide a basis for the final decision. Based on the assessment results, the optimization scheme is implemented, and the implementation process is monitored and managed using BIM technology to ensure the realization of energy-saving benefits.
In this paper, the platform development architecture adopts B/S architecture, which is a common Web application architecture that divides the application into two main parts, the client side (browser side) and the server side. Browser-side is mainly expressed through front-end development. The front-end interface is constructed by HTML, CSS and JavaScript, which is used to display the structure, style and interactive elements of the page. The back-end application is written in a server-side language and undertakes the important tasks of processing requests, executing business logic and returning responses, simplifying the development process through tools and libraries provided by back-end frameworks.
In this study, a comprehensive assessment indicator system is initially established by systematically summarizing and extracting relevant indicators from three key dimensions: energy efficiency, economic efficiency, and environmental efficiency. These dimensions are selected to ensure a holistic evaluation of the energy-saving performance of green buildings based on intelligent construction technology. The specific indicators formulated within this framework are presented in Table 1 and are categorized into three major groups: energy benefit indicators, economic benefit indicators, and environmental benefit indicators. The energy efficiency indicators primarily focus on metrics that evaluate energy conservation levels and the degree of renewable energy utilization, aiming to reflect the actual effectiveness of green energy practices. To more accurately assess the financial viability of the construction project, the economic benefit indicators are selected from two complementary perspectives: capital recovery time and resource utilization efficiency, thereby ensuring a balanced and scientifically grounded evaluation of economic returns. Lastly, the environmental efficiency indicators are designed to capture both indoor and outdoor environmental quality parameters, recognizing the importance of creating healthy and sustainable built environments for occupants and the broader ecological context.
| Target layer | Criterion layer | Index layer | Index number |
|
Green building efficiency
assessment index |
Energy benefit (A) | Pitch quantity | A1 |
| Electric discharge | A2 | ||
| Renewable energy utilization | A3 | ||
| Economic benefit (B) | Internal rate of return | B1 | |
| Investment recovery period | B2 | ||
| Environmental benefit (C) | \(CO_2 \) emission reduction | C1 | |
| \(SO_2 \) emission reduction | C2 | ||
| \(NO_\rm x \) emission reduction | C3 | ||
| Soot reduction | C4 | ||
| Indoor thermal wet environment improvement | C5 | ||
| Indoor halo improvement | C6 | ||
| Improved indoor air quality | C7 | ||
| Indoor acoustic environmental improvement | C8 | ||
| Extended building life | C9 | ||
| Transformation sustainability | C10 |
Coal saving rate refers to the coal saving capacity of green buildings [13], i.e., the extent to which a building’s coal consumption is reduced after energy-saving green retrofit compared with that before retrofit. The formula for calculating the coal saving rate is as follows: \[\label{GrindEQ__1_} \varepsilon _{c} =\frac{Q_{Bc} -Q_{Ac} }{Q_{Bc} } , \tag{1}\] where \(\varepsilon _{c}\) is the coal saving rate, \(Q_{BC}\) is the coal consumption during the heating period before the retrofit (Kg), and \(Q_{Ac}\) – the coal consumption during the heating period after the retrofit (Kg).
Electricity saving rate refers to the building’s ability to save electricity. The formula for calculating the electricity saving rate is as follows: \[\label{GrindEQ__2_} \varepsilon _{e} =\frac{Q_{Be} -Q_{Ae} }{Q_{Be} } , \tag{2}\] where \(\varepsilon _{e}\) is the power saving rate, \(Q_{Be}\) is the power consumption during heating period and summer air conditioning operation before green retrofit, (Kwh), and \(Q_{Ae}\) is the power consumption during heating period and summer air conditioning operation after green retrofit (Kwh).
The renewable energy utilization rate is expressed in terms of the ratio of the total renewable energy utilization to the total resource consumption after the green building project renovation based on intelligent construction technology, and the calculation formula is as follows: \[\label{GrindEQ__3_} \eta _{r} =\frac{Q_{r} }{Q_{s} } , \tag{3}\] where \(\eta _{r}\) is the utilization rate of renewable energy, \(Q_{r}\) is the utilization amount of renewable energy (KJ), and \(Q_{s}\) is the total energy consumption of the project (KJ).
Internal rate of return refers to the discount rate when the cumulative net present value of the net cash flow of each year in the whole life cycle of the green building project is zero, and the formula is as follows: \[\label{GrindEQ__4_} \sum _{t=0}^{n}\left(CI-CO\right)_{t} \left(1+IRR\right)^{-t} =0 , \tag{4}\] where \(IRR\) is the rate of return, \(\left(CI-CO\right)_{t}\) is the net cash flow in year \(t\), and \(n\) is the project lifetime.
The payback period is the time required for the cumulative net benefits of the retrofit project to offset the initial investment in the retrofit. A static payback period is used for the evaluation, and the formula is as follows: \[\label{GrindEQ__5_} \sum _{t=0}^{P_{t} }\left(CI-CO\right)_{t} =0 , \tag{5}\] where \(P_{t}\) is the static payback period.
The pollutants reduced after the transformation include \({\rm CO}_{2}\), \({\rm SO}_{2}\), \({\rm NOx}\) and soot, this paper mainly considers the \({\rm CO}_{2}\) emission reduction rate indicator, that is, \({\rm CO}_{2}\) the proportion of emission reduction in the building after green transformation to the proportion of emissions before transformation, used to measure the emission reduction ability of green buildings, the calculation formula is as follows: \[\label{GrindEQ__6_} P_{C} =\frac{\Delta P_{C} }{P_{bc} } , \tag{6}\] where \(P_{C}\) is the rate of \({\rm CO}_{2}\) emission reduction, \(P_{bc}\) is the emission \({\rm CO}_{2}\) rate before the retrofit, and \(\Delta P_{C}\) is the reduced \({\rm CO}_{2}\) emission rate.
The formula for \(\Delta P_{C}\) is shown below: \[\label{GrindEQ__7_} \Delta P_{C} =\sum \Delta Q_{i} \times \alpha _{i} , \tag{7}\] where \(\Delta Q_{i}\) is the energy savings of the \(i\)nd energy source and \(\alpha _{i}\) is the \({\rm CO}_{2}\) emission factor of the \(i\)th energy source.
Let \(B_{m}(C_{p})\) denote the rating given by the \(m\)th expert to the indicator \(C_{p}\), where \(m = 1, 2, \ldots, M\) and \(p = 1, 2, \ldots, N\). The following steps outline the procedure for determining the subjective weights of each indicator.
For the \(m\)th expert, the concept of “most important” is defined by the maximum rating \(\max \left\{ B_{m}(C_{p}) \right\}\). The affiliation degree \(D_{mp}\) of each indicator relative to the “most important” rating is then calculated as: \[\label{GrindEQ__8_} D_{mp} = \frac{B_{m}(C_{p})}{\max \left\{ B_{m}(C_{p}) \right\}}, \quad \left(0 \le D_{mp} \le 1 \right). \tag{8}\]
The fuzzy frequency number \(f_{hp}\) of indicator \(C_{p}\) and its fuzzy frequency sum \(R_{p}\) are computed as follows: \[\label{GrindEQ__9_} f_{hp} = \sum\limits_{m=1}^{M} \delta_{m}^{h}(C_{p}) D_{mp}, \tag{9}\] \[\label{GrindEQ__10_} R_{p} = \sum\limits_{h} f_{hp}, \tag{10}\] where \(\delta_{m}^{h}(C_{p})\) is the coefficient of the preferential order relationship of indicator \(C_{p}\) in the \(h\)th position.
Define \(Q_{h}\) as the weight of the \(h\)th position in the preference ranking, calculated by: \[\label{GrindEQ__11_} Q_{h} = \frac{1}{2} (N – h)(N – h + 1). \tag{11}\]
Then, the fuzzy Borda number \(FB(C_{p})\) is computed by: \[\label{GrindEQ__12_} FB(C_{p}) = \sum\limits_{h} \left( \frac{f_{hp}}{R_{p}} \right) Q_{h} = \sum\limits_{h} W_{hp} Q_{h}, \tag{12}\] where \(W_{hp} = \frac{f_{hp}}{R_{p}}\) represents the normalized fuzzy frequency.
Finally, the subjective weight \(W_{p}\) of indicator \(C_{p}\) is obtained by normalizing its fuzzy Borda number: \[\label{GrindEQ__13_} W_{p} = \frac{FB(C_{p})}{\sum\limits_{p=1}^{N} FB(C_{p})}. \tag{13}\]
In this study, the CRITIC method [18] was employed to adjust the initial evaluation score matrix, thereby deriving the objective weights of the indicators.
Assuming there are \(m\) evaluators and \(n\) indicators, let \(x_{ij}\) represent the score assigned by the \(i\)th evaluator to the \(j\)th indicator. The score matrix \(X\) for the comprehensive energy efficiency evaluation of green buildings is defined as: \[\label{GrindEQ__14_} X = \begin{bmatrix} x_{11} & x_{12} & \cdots & x_{1n} \\ x_{21} & x_{22} & \cdots & x_{2n} \\ \vdots & \vdots & \ddots & \vdots \\ x_{m1} & x_{m2} & \cdots & x_{mn} \end{bmatrix}. \tag{14}\]
The min-max normalization method was applied. For positive indicators, the following transformation was used: \[\label{GrindEQ__15_} y_{ij} = \frac{x_{ij} – \min(x_{ij})}{\max(x_{ij}) – \min(x_{ij})}, \tag{15}\] and for negative indicators: \[\label{GrindEQ__16_} y_{ij} = \frac{\max(x_{ij}) – x_{ij}}{\max(x_{ij}) – \min(x_{ij})}, \tag{16}\] where \(y_{ij}\) denotes the standardized value, and \(\max(x_{ij})\) and \(\min(x_{ij})\) are the maximum and minimum values of the \(j\)th indicator, respectively.
The degree of conflict between the \(j\)th indicator and other indicators is denoted by \(R_{tj}\), and calculated as: \[\label{GrindEQ__17_} R_{tj} = \sum\limits_{t=1}^{n} (1 – r_{tj}), \tag{17}\] where \(r_{tj}\) is the correlation coefficient between indicators \(t\) and \(j\), computed as: \[\label{GrindEQ__18_} r_{tj} = \frac{ \sum\limits_{i=1}^{m}(y_{it} – \bar{y}_{t})(y_{ij} – \bar{y}_{j}) }{ \sqrt{\sum\limits_{i=1}^{m}(y_{it} – \bar{y}_{t})^2 \sum\limits_{i=1}^{m}(y_{ij} – \bar{y}_{j})^2} }, \quad t \ne j. \tag{18}\]
The total information content \(C_j\) of the \(j\)th indicator is determined by the variability and conflict degree: \[\label{GrindEQ__19_} C_j = \sigma_j \sum\limits_{t=1}^{n}(1 – r_{tj}), \tag{19}\] where \(\sigma_j\) is the standard deviation of the \(j\)th indicator.
The objective weight \(\omega_j\) of the \(j\)th indicator is given by: \[\label{GrindEQ__20_} \omega_j = \frac{C_j}{\sum\limits_{j=1}^{n} C_j}. \tag{20}\]
After obtaining both subjective weights \(\omega_{sj}\) and objective weights \(\omega_j\), the final comprehensive weight \(W_j^0\) is calculated using a multiplicative synthesis method: \[\label{GrindEQ__21_} W_j^0 = \frac{\omega_{sj} \cdot \omega_j}{\sum\limits_{j=1}^{n} \omega_{sj} \cdot \omega_j}. \tag{21}\]
The establishment of the material element topological model [28] needs to be divided into a reasonable benefit assessment level, the comprehensive energy efficiency assessment index system of green buildings is composed of qualitative and quantitative indicators, which needs to be comprehensively and systematically assessed and researched. In this paper, according to the relevant regulations of green buildings and actual cases, and combining the principles of qualitative and quantitative analysis, the efficiency assessment level is divided into five levels, namely, ‘poor, slightly poor, medium, good, excellent’’, and the corresponding level intervals are (0, 55], (55, 65], (65, 75], ( 75, 85], (85, 100]”, based on the evaluation grade to construct the classical domain, section domain and object elements to be evaluated in the topological model.
The research object \(N\) is the object to be evaluated, and the object element consisting of these characteristics is called the evaluation object element, and the object element matrix \(R_{o}\) is established based on the data values of the indicators of the object element to be evaluated: \[\label{GrindEQ__22_} R_{o} =\left(N_{o} ,C_{i} ,V_{i} \right)=\left[\begin{array}{ccc} {N_{o} } & {C_{1} } & {V_{1} } \\ {} & {C_{2} } & {V_{2} } \\ {} & {\cdots } & {\cdots } \\ {} & {C_{n} } & {V_{n} } \end{array}\right] , \tag{22}\] where \(N_{o}\) is the object to be evaluated and \(V_{i}\) is the value corresponding to the evaluation feature \(C_{i}\).
The classical domain object refers to the domain of values contained in the thing \(N\) with respect to some of the features \(C\). In the case of the object to be evaluated \(N\), the classical domain element \(R_{j}\) for the \(j\)th evaluation level \(\left(j=1,2,\cdots ,n\right)\) is: \[\label{GrindEQ__23_} R_{j} =\left(N_{j} ,C_{i} ,V_{ji} \right)=\left[\begin{array}{ccc} {N_{j} } & {C_{1} } & {V_{j1} } \\ {} & {C_{2} } & {V_{j2} } \\ {} & {\cdots } & {\cdots } \\ {} & {C_{n} } & {V_{jn} } \end{array}\right]=\left[\begin{array}{ccc} {N_{j} } & {C_{1} } & {\left\lfloor a_{j1} ,b_{j1} \right\rfloor } \\ {} & {C_{2} } & {\left\lfloor a_{j2} ,b_{j2} \right\rfloor } \\ {} & {\cdots } & {\cdots } \\ {} & {C_{n} } & {\left\lfloor a_{jn} ,b_{jn} \right\rfloor } \end{array}\right] , \tag{23}\] where \(N_{j}\) is the \(j\)th assessment level of the rating object, \(C_{i}\) is the \(i\)th assessment indicator, and \(V_{ji} =\left\lfloor a_{ji} ,b_{ji} \right\rfloor\) is the interval range of feature \(C_{i}\) corresponding to the \(j\)th assessment level.
The section domain refers to the value range of the thing \(N\) with respect to all the features \(C\). For the assessment object \(N\), the section elements \(R_{p}\) for all assessment levels are: \[\label{GrindEQ__24_} R_{p} =\left(N_{p} ,C_{i} ,V_{pi} \right)=\left[\begin{array}{ccc} {N_{p} } & {C_{1} } & {V_{p1} } \\ {} & {C_{2} } & {V_{p2} } \\ {} & {\ldots } & {\ldots } \\ {} & {C_{n} } & {V_{pn} } \end{array}\right]=\left[\begin{array}{ccc} {N_{p} } & {C_{1} } & {\left\lfloor a_{p1} ,b_{p1} \right\rfloor } \\ {} & {C_{2} } & {\left\lfloor a_{p2} ,b_{p2} \right\rfloor } \\ {} & {\ldots } & {\ldots } \\ {} & {C_{n} } & {\left\lfloor a_{pn} ,b_{pn} \right\rfloor } \end{array}\right] , \tag{24}\] where \(N_{p}\) is all the assessment grades of the rating object, and \(V_{pi} =\left\lfloor a_{pi} ,b_{pi} \right\rfloor\) is the range of intervals of feature \(C_{i}\) corresponding to all the assessment grades.
The correlation function is a function used to determine the correlation value of the benefit grade, and the specific calculation formula is: \[\label{GrindEQ__25_} K_{j} \left(V_{i} \right)=\begin{cases} {-\frac{\rho \left(v_{i} ,v_{ji} \right)}{\left|v_{ji} \right|} } & {v_{i} \in v_{ji} } \\ {\frac{\rho \left(v_{i} ,v_{ji} \right)}{\rho \left(v_{i} ,v_{pi} \right)-\rho \left(v_{i} -v_{ji} \right)} } & {v_{i} \notin v_{ji} ;\rho \left(v_{i} ,v_{ji} \right)\ne 0} \\ {-\rho \left(v_{i} ,v_{ji} \right)-1} & {v_{i} \notin v_{ji} ,\rho \left(v_{i} ,v_{ji} \right)=0} \end{cases} \tag{25}\] \[\label{GrindEQ__26_} \begin{array}{rcl} {\rho \left(v_{i} ,v_{ji} \right)} & {=} & {\left|v_{i} -\frac{1}{2} \left(a_{ji} +b_{ji} \right)\right|}{-\frac{1}{2} \left(b_{ji} -a_{ji} \right)\left(i=1,2,\ldots ,n,j=1,2,\ldots ,k\right)} \end{array} \tag{26}\] \[\label{GrindEQ__27_} \rho \left(v_{i} ,v_{pi} \right)=\left|v_{i} -\frac{1}{2} \left(a_{pi} +b_{pi} \right)\right|-\frac{1}{2} \left(b_{pi} -a_{pi} \right)\left(i=1,2,\ldots ,n\right) , \tag{27}\] where \(K_{j} \left(V_{i} \right)\) is the value of the correlation function of the \(i\)th assessment indicator about the \(j\)th assessment level, \(\rho \left(v_{i} ,v_{ji} \right)\), \(\rho \left(v_{i} ,v_{pi} \right)\) is the distance between point \(V_{i}\) and the classical domain and section domain.
The comprehensive correlation degree \(K_{j} \left(N_{o} \right)\) of the object to be assessed \(N\) with respect to level \(j\) is calculated by the following formula: \[\label{GrindEQ__28_} K_{j} \left(N_{o} \right)=\sum _{i=1}^{n}\omega _{i} K_{j} \left(V_{i} \right)\left(i=1,2,\ldots ,n\right) , \tag{28}\] where \(\omega _{i}\) is the weight of the determined indicators and \(K_{j} \left(V_{i} \right)\) is the value of the determined correlation function.
According to the value of the integrated correlation function, the corresponding benefit assessment level of the object to be assessed \(N\) can be determined: \[\label{GrindEQ__29_} K_{j} \left(N_{o} \right)=\max K_{j} \left(N_{o} \right)\left(j=1,2,\ldots ,n\right) . \tag{29}\]
The maximum value \(K_{j} =\left(K_{1} ,K_{2} ,K_{3} ,K_{4} ,K_{5} \right)\) is the benefit assessment grade corresponding to \(U=\) (poor, poor, medium, good, excellent), and by the principle of maximum affiliation, the benefit assessment grade corresponding to the maximum value is the result of the energy efficiency assessment of the example green building project.
In this paper, a resort paradise project in Rizhao City, the hotel part of one of the research cases, the project is located in Rizhao City, Shandong Province, Donggang District, west of the Bihai Road, east of Shanhaitian two roads, the planning land area of 96524.1\(m^{2}\), the hotel building area of 195426.6\(m^{2}\), the ground floor area of 184,251.2\(m^{2}\), the ground floor area of 6,253.4\(m^{2}\), the building height of 21.64m, the ground floor of 6, the main structure The form is frame structure, the total bidding price of this project is 284152642.62 yuan. This project is a two-star green building, declared on September 15, 2023 to obtain the two-star logo, with an overall score of 69 points. According to the results of the declared evaluation report, the main points of loss are as follows:
1) The design and functional use of the building’s usable space is low and lacks the necessary variable measures, such as separating the building structure from the building’s equipment pipelines.
2) The building has not been designed with adjustable sunshading measures to improve indoor thermal comfort.
3) Failure to adopt mechanical parking facilities or underground parking, mainly utilizing surface parking, and the ratio of surface parking area to total construction land area is more than 8.5%.
4) It does not adopt architectural style design suitable for regional characteristics, and inherits regional architectural culture according to local conditions.
5) The land of the construction project was originally open land, so there is no score for the reasonable selection of the abandoned site construction or making full use of the old buildings that can still be utilized.
Based on this, this paper carries out green transformation and optimization of the hotel building of the project based on the proposed intelligent construction technology to improve the energy efficiency of the building. The green energy-saving optimization design measures for the building using intelligent construction technology mainly include energy saving of maintenance structure and energy saving of equipment operation system. The thermal insulation material of the external wall extends to 500mm to the outdoor ground, and the overhead floor or picket floor in contact with the outdoor air adopts 100-thick rock wool board for thermal insulation; the thermal bridge parts between the external wall and roof and the inner side of the daughter wall adopt 20-thick A-grade glass beads, and the picket components of the external wall and the components attached to the wall (canopies, side wall lights of the windows and doors) all adopt thermal insulation measures. Roof insulation adopts 80mm extruded polystyrene board with B1 grade combustion performance. In terms of energy saving in the HVAC system, the heat source in the heating season is a combination of municipal heating and boiler heating, with 3 sets of 2120KW hot water boilers in the boiler room, and the boilers are dual-use oil and gas boilers. In the energy-saving lighting and electrical system, the lighting method and control method are rationally selected by combining with natural lighting, and energy-saving light sources are preferred. Intelligent lighting control system is set up in public areas and large space areas, and human sensor lamps are used to control the lighting of aisles and stairwells, and multiple modes of automatic control devices are set up for outdoor floodlighting and landscape lighting. The emergency lighting system adopts centralized power supply and centralized control system. In terms of renewable energy, it makes full use of the roofing resources and sets up 450 square meters of solar energy on the roof, which is used to preheat the hot water of the hotel. In addition, all sanitary appliances have reached the required water efficiency level 2.
The results of the weighting analysis of the assessment indicators of energy efficiency of green buildings based on intelligent construction technology are shown in Table 2. The results of the weighting values show that the weighting value of environmental benefits (0.611) is the largest among the first-level indicators, which is mainly because the environmental benefits are directly related to the energy-saving benefits of green buildings, and the environmental benefits are more intuitive compared with the energy and economic benefits.
| Criterion layer | Weight value | Index layer | Index number | Weight value |
| Energy benefit (A) | 0.241 | Pitch quantity | A1 | 0.059 |
| Electric discharge | A2 | 0.102 | ||
| Renewable energy utilization | A3 | 0.08 | ||
| Economic benefit (B) | 0.148 | Internal rate of return | B1 | 0.054 |
| Investment recovery period | B2 | 0.094 | ||
| Environmental benefit (C) | 0.611 | \(CO_2 \) emission reduction | C1 | 0.106 |
| \(SO_2 \) emission reduction | C2 | 0.078 | ||
| \(NO_\rm x \) emission reduction | C3 | 0.076 | ||
| Soot reduction | C4 | 0.089 | ||
| Indoor thermal wet environment improvement | C5 | 0.052 | ||
| Indoor halo improvement | C6 | 0.021 | ||
| Improved indoor air quality | C7 | 0.038 | ||
| Indoor acoustic environmental improvement | C8 | 0.037 | ||
| Extended building life | C9 | 0.062 | ||
| Transformation sustainability | C10 | 0.052 |
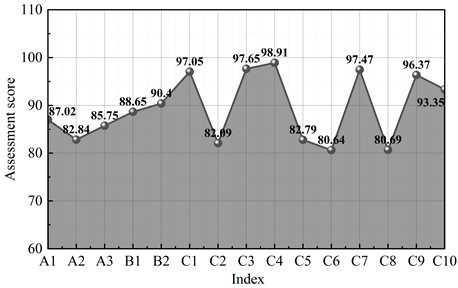
The results of the energy efficiency assessment of the green renovation and optimized hotel building are shown in Figure 2. The energy efficiency rating of the hotel project is between “good” and “excellent”, and the energy efficiency rating is not yet fully excellent. The indicators of economic benefits (88.65 and 90.40 points) are in the “good” range. This indicates that the energy-saving and emission reduction technologies adopted by green buildings are relatively mature in application and can generate considerable benefits. Although the energy efficiency of the energy saving index is evaluated at 82.84, which is “good”, it is undeniable that the project has adopted a large number of green building energy-saving and emission reduction technologies under the application of intelligent construction technology. The project is a high-grade hotel, which has high requirements for the beautification of the building and the comfort of the environment. Green plants have the characteristics of aesthetics, air purification, carbon dioxide absorption and reduction of the urban heat island effect, and the compound green plants around the site and the green plants on the roof have achieved win-win effects of aesthetics and greening. Although the project adopts a variety of energy-saving and emission reduction products and technologies, it still generates a large amount of energy consumption and emits a large amount of carbon dioxide gas every day during the operation period, and there is still a long way to go to achieve a low-carbon building or even a zero-carbon building.
In this paper, a building energy efficiency retrofit project of Building 12 in a neighborhood in Beijing, a northern heating area, is used to demonstrate the comprehensive assessment model of benefits. This project is a Sino-German technical cooperation project of “Energy Saving Retrofit of Existing Buildings in China”. The building is located in Chaoyang District, adjacent to the North Fourth Ring Road, with 15 floors, a total floor area of about 12,425\(m^{2}\), facing south, a form factor of 0.32, a window-to-wall ratio of 0.16, and a total of 154 households. The building is a prefabricated slab structure with internal casting and external hanging, the external wall is composed of 250mm-thick ceramic concrete, the roof is composed of 220mm-thick aerated concrete, and most of the tenants have already replaced the external windows with sliding or casement plastic steel windows on their own, and the heat transfer coefficient of the enclosure structure is relatively high. The site investigation found that after 20 years of use, although the building has been repaired several times, some parts of the external wall have been leaking and broken, resulting in dew and mold on some of the walls and low indoor temperature in winter. The use of infrared thermal imager on the dew moldy place of the inner surface of the external wall detection, the results show that the temperature in 8.6 \(\mathtt{{}^\circ\!{C}}\) or so, which is lower than the neighboring walls of the inner surface temperature of 3 \(\mathrm{\sim}\) 4 \(\mathtt{{}^\circ\!{C}}\). These condensed and moldy walls resulted in heat loss, thus lowering the indoor temperature, and the occupants needed to take additional warming measures to solve the problem of poor thermal comfort. After measuring the heat transfer coefficient of the envelope on site, the specific primary energy demand data of Building 12 is calculated as shown in Table 3, the total primary energy demand is 108.70\(kWh/(m^{2} \cdot {\rm a})\), and the primary energy demand for heating, cooling and ventilation is 39.40\(kWh/(m^{2} \cdot {\rm a})\), which is 105\(kWh/(m^{2} \cdot {\rm a})\) and 35\(kWh/(m^{2} \cdot {\rm a})\) respectively in China’s regulations on existing residential buildings, showing that the primary energy demand of this building is too high, and that it is too high for this building. This shows that the primary energy demand of this existing residential building is too high, which greatly wastes the energy consumption of the building. Therefore, the green building design process based on intelligent construction technology proposed in this paper is used to carry out green energy-saving renovation in this neighborhood, and the energy-saving renovation project was officially launched from the end of October 2023 to the end of January 2024, which lasted 83 days.
| Demand dimension | Demand quantity |
| Heating demand | 8.42 |
| Refrigeration demand | 14.26 |
| Lighting demand | 19.84 |
| Ventilation and dehumidification demand | 16.72 |
| Demand for hot water preparation | 0.84 |
| Life demand | 48.62 |
| Total | 108.70 |
After the construction of Building 12 was completed and successfully passed the completion inspection, the performance monitoring of the residential building was carried out, and the specific monitoring data are shown in Table 4, which shows that the green renovation of the residential building did realize the excellent performance of the building in terms of heating and cooling with a lower primary energy demand in the process of operation and use. The indoor temperature was able to reach 21.4\(\mathrm{{}^\circ}\)C in winter and the room temperature in summer (23.5\(\mathrm{{}^\circ}\)C) was also lower than the performance standard value (26\(\mathrm{{}^\circ}\)C). In addition, the green retrofitted homes have low indoor noise (25dB(A)), which meets the performance standard.
According to the electrical design documents of Building 12 of the neighborhood, this paper calculates the energy consumption table of electrical and lighting energy saving of green building in Building 12 and its energy saving situation as shown in Table 5. It can be found that after remodeling by the green building design method proposed in this paper, the combined cooling and heating energy consumption of the residential building in Building 12 is reduced from 113.26\({\rm kwh}/m^{2}\) to 66.27\({\rm kwh}/m^{2}\), with an energy saving rate of 41.49%. The energy consumption of heating, air conditioning and lighting decreases from 48.72\({\rm kwh}/m^{2}\) and 49.82\({\rm kwh}/m^{2}\) to 9.85\({\rm kwh}/m^{2}\) and 16.52\({\rm kwh}/m^{2}\) respectively, which indicates that the energy consumption of the existing residential building after green renovation has been effectively saved.
| Performance monitoring project | Performance monitoring data | Performance indicator |
| Indoor temperature (winter) | 21.4\(\mathtt{{}^\circ\!{C}}\) | \(\mathrm{\ge}\)20\(\mathtt{{}^\circ\!{C}}\) |
| Indoor temperature (summer) | 23.5\(\mathtt{{}^\circ\!{C}}\) | \(\mathrm{\le}\)26\(\mathtt{{}^\circ\!{C}}\) |
| Indoor relative humidity | 55.4% | 45%-60% |
| Supertemperature frequency | \(\mathrm{\le}\)12\(\mathtt{{}^\circ\!{C}}\) | \(\mathrm{\le}\)12\(\mathtt{{}^\circ\!{C}}\) |
| Indoor \(CO_2 \) concentration | 256-894ppm | \(\mathrm{\le}\)1200ppm |
| Indoor noise | 25 dB(A) |
Daytime\(\mathrm{\le}\)42dB(A)
Night\(\mathrm{\le}\)30dB(A) |
| Indoor wind speed | \(\mathrm{\le}\)0.25m/s | \(\mathrm{\le}\)0.35m/s |
| Air tightness | 0.34 | \(\mathrm{\le}\)0.58 |
| Energy consumption classification | Energy class |
Green building
(\({\rm kwh}/m^{2} \)) |
Basic building
(\({\rm kwh}/m^{2} \)) |
Energy efficiency
(%) |
| Building load | Refrigerating quantity | 49.85 | 84.62 | 41.09% |
| Heat consumption | 16.42 | 28.64 | 42.67% | |
| Cold heat | 66.27 | 113.26 | 41.49% | |
| Cooling power consumption | Central cold source | 2.48 | 18.95 | 86.91% |
| Cooling water pump | 2.67 | 14.26 | 81.28% | |
| Refrigerated pump | 3.59 | 12.48 | 71.23% | |
| Multiple on-line air conditioning | 0 | 0 | 0.00% | |
| Cooling aggregate | 8.74 | 45.69 | 80.87% | |
| Heating consumption | Central reservoir | 0.82 | 15.64 | 94.76% |
| Heating pump | 2.69 | 1.52 | 76.97% | |
| Multiple line heat pump | 0 | 0 | 0.00% | |
| Heating total | 3.51 | 17.16 | 79.55% | |
| Heating and air conditioning | 9.85 | 48.72 | 79.78% | |
| Illumination loss | 16.52 | 49.82 | 66.84% | |
| Combined electricity consumption | 29.64 | 98.67 | 69.96% | |
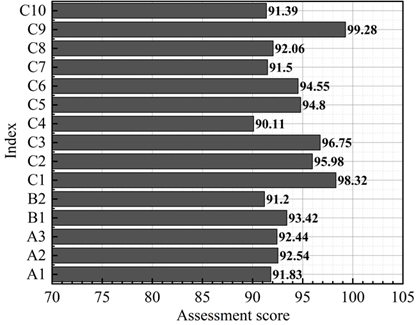
The energy efficiency assessment model is used to assess the energy efficiency of the green retrofit of the existing residential building and to determine the efficiency evaluation level, and the results of the energy efficiency assessment of the green building in Building 12 of this district are shown in Figure 3. The evaluation scores of each index are all between 90.11-99.28, and the corresponding benefit belongs to the interval of “excellent”, which indicates that the goal of the green retrofit project is basically realized, and it has the effect of generating energy-saving benefits, but there are still some problems. For example, although the airtightness of the retrofitted building has been improved, the number of air exchanges is still on the high side compared with that of new energy-saving buildings, which will be a place to pay attention to and strengthen technical improvement in future energy-saving retrofitting.
Based on intelligent construction technology, this paper proposes a green building design scheme process, and constructs a comprehensive evaluation method for the energy-saving benefits of green buildings to verify the feasibility of the scheme implementation. In the first case, the energy-saving benefit level of a resort park project hotel after green renovation is between “good” and “excellent”, although the evaluation score of the energy-saving index in the energy consumption benefit is 82.84 points, which is “good”, it is undeniable that the project has adopted a large number of green building energy-saving and emission reduction technologies under the application of intelligent construction technology. In the second case, after the energy-saving renovation of a residential building, the residential building was renovated and operated with a lower primary energy demand to achieve excellent performance in heating, cooling and other aspects. The total energy consumption of cold and heat was reduced from 113.26\({\rm kwh}/m^{2}\) to 66.27\({\rm kwh}/m^{2}\), and the energy saving rate reached 41.49%. The evaluation scores of each index of energy-saving benefits are between 90.11-99.28 points, and the corresponding benefit membership interval is “excellent”, indicating that the goal of the green transformation project has been basically achieved, and it has been effective and has produced energy-saving benefits. This provides guidance for the smooth implementation of subsequent energy-saving renovation projects and the improvement of benefits.
This work was supported by 2024 Jiaozuo City Government decision-making research bidding project “Jiaozuo City to promote urban renewal countermeasures”.