Nowadays, “Artificial Intelligence + Education” is transforming teaching and learning. In this study, we employ AI-based data mining to innovate educational management by designing an academic monitoring system using K-means clustering and developing an early warning model through stacking multi-model superposition. Targeted management measures, including personalized video recommendations, are implemented based on the model’s predictions to promote individualized student development. By analyzing daily behavior data from 500 college students, the K-means algorithm effectively classified them into four groups, and the academic alert model achieved a prediction accuracy of 84.19%, outperforming single base models. The implementation of this personalized management method significantly improved student performance compared to traditional approaches, demonstrating its potential to enhance educational outcomes.
In the context of the current global education reform and social development, the innovation and exploration of education management mode is particularly important. The traditional education management model is often teacher-centered and lacks attention to the individual differences of students, which limits the effective allocation of education resources and the improvement of education quality [17,7,15]. Therefore, we need to constantly explore and practice innovative education management mode to adapt to this rapidly changing era, and it is urgent to explore a new education management mode to meet the needs of the new era of education development and promote the overall development of students.
Based on the problems existing in the traditional education management mode, a summary is made here. First of all, the traditional education management mode is relatively rigid, and it is necessary to promote the conceptual change of education administrators, teachers, parents and other education stakeholders, from pure knowledge transfer to focus on the overall development of students and quality education [13,8,20]. Secondly, the innovative education management model needs to be supported by a more innovative and professional teacher team, but the current teacher training and development system still needs to be further improved, and also needs to provide diversified educational training and development opportunities [10,3,5,4]. Finally, in the education management model, attention is paid to students’ interests and outstanding characteristics, and rich and diverse educational resources are provided to meet students’ needs, but there is still an imbalance in the allocation of educational resources, and it is necessary to open up educational resources through the efforts of the government and society in various aspects [19,14,6]. Among them, students’ individualized demand is a prominent feature in the new education management model. The new education management model advocates a flexible learning environment and encourages students to personalize their learning and choose their own courses [1,11]. Students can customize their learning plans according to their own interests and abilities, and improve their motivation and initiative in learning. Instead of relying on the traditional score evaluation system, multiple evaluation methods are introduced to emphasize the development of students’ comprehensive quality and ability. In addition to academic performance, students’ innovative thinking, teamwork and practical ability are also evaluated [9]. These aspects of the management model to achieve personalized development of students. In addition, the implementation of education informatization is a big trend, through the Internet technology and artificial intelligence and other means, to realize the intelligent distribution or intelligent sharing of teaching resources, the monitoring of the learning process and the intelligent management, to improve the efficiency and quality of education [21,12,16].
Research on data mining technology based on artificial intelligence for academic early warning, as a way to grasp students’ learning progress and facilitate personalized education management. Firstly, K-means clustering is used for academic monitoring to classify students’ learning level according to their daily behavior data. Then we construct the Stacking multi-model superposition of academic early warning model to predict students’ academic performance in advance, and carry out personalized intervention according to the early warning information prompts. We also recommend learning videos based on students’ video preference and cognitive level, and implement personalized teaching management for students. Finally, a controlled experiment is designed to verify the applicability of the above management methods according to the improvement of students’ performance.
Artificial intelligence is the intelligent behavior exhibited by a computer program. This intelligence can include abilities such as learning, reasoning, problem solving and autonomous action. Artificial intelligence technology applied to education management can help administrators better manage and analyze a large amount of student data, teaching data, and financial data, thus improving the science and accuracy of decision-making [22]. Through data mining, administrators can better understand students’ needs and performance, optimize curriculum and resource allocation, and improve teaching quality and student satisfaction.
Students’ academic status is the core content of education management, through the monitoring and effective regulation of students’ learning progress, it can help students successfully complete their studies. At present, the teaching management system is not intelligent enough to monitor the academic status and manage the students’ academic records, the teacher can’t have a comprehensive understanding of each student’s academic status, and the academic administrators will only check whether each student meets the requirements of the academic level near the end of the semester. Therefore, the effective use of cluster analysis can monitor students’ learning progress in stages, grasp the real learning status of students in a timely manner, form an early warning mechanism, help disadvantaged students, standardize the process of guiding the development of students and the results, and ensure that the requirements of the academic level are reached.
Cluster analysis refers to the process of decomposing a large number of data objects into multiple classes based on their many characteristics without knowing the class of the research object in advance, in the process of decomposition, according to the degree of affinity between the data objects are automatically classified, the sample objects within the class have similarity in characteristics, and the characteristics of the sample objects between the different classes differ greatly.SPSS software mainly provides hierarchical clustering and K-means clustering two methods, of which K-means is its classic algorithm.
K-means is also known as fast clustering method, it is mainly by constantly adjusting the center point of the K clusters until the cohesive point position reaches the convergence criteria, if the number of samples is large or the file is huge, then it is suitable for K-means clustering method.The core steps of K-means are as follows:
1) The user specifies the number of clusters and SPSS will derive a unique solution according to the user’s needs.
2) Specify the initial class center point of these K classes, commonly used methods to specify the initial class center point: empirical selection method, random selection method, min-max method.
3) Calculate the Euclidean distance from each object to the center point of the K classes respectively, and assign all samples according to the principle of closest distance to form K classifications.
4) Redetermine the centroids of the K classes using the mean value method.
5) Determine whether the specified number of iterations has been reached or the degree of offset of the class center point has converged, the above two conditions to meet any one of the end of the clustering, if none of them are satisfied, then return to the third step. In cluster analysis, the class to which the sample belongs will be continuously adjusted until it is stabilized.
Through the academic monitoring and early warning mechanism, schools can count and analyze students’ academic performance in each semester, grasp the real learning status of students, and remind different groups of students of the corresponding warning messages. At the same time, timely support measures are provided to intervene in students’ learning status and standardize the process of guiding students’ development, which will play an important role in improving the quality of teaching and learning.
Cluster analysis can be a batch of sample data according to the nature of the degree of affinity, in the absence of a priori knowledge of the case of automatic classification, to produce multiple classification results, the samples within the class in the characteristics of the similarity, the characteristics of the samples between the different classes differ greatly, so the cluster analysis can be used in many cases to find different learning status of the student group or other groups. In cluster analysis, the degree of affinity between individuals is extremely important, which will directly affect the classification results, and this degree of affinity is measured by the distance between individuals. Since the K-means algorithm is concise and convenient, and is suitable for rapid clustering of large amounts of data, the K-means clustering algorithm will be used in this part to implement academic monitoring and early warning. Applying K-means clustering analysis to academic monitoring can realize that students can be automatically divided into different types of groups according to their average grades, attendance, etc., and there are obvious differences between the groups, so that different warning messages can be proposed for different groups of students [18].
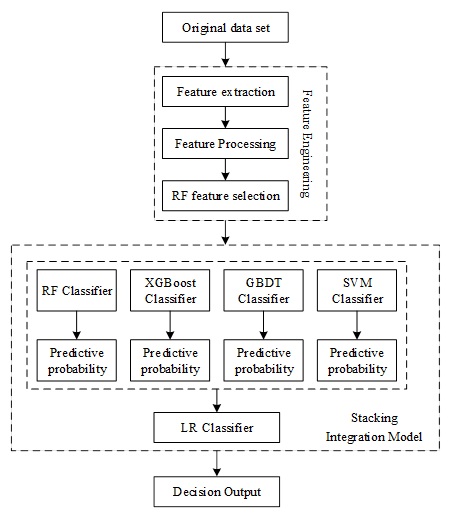
This section provides academic early warning for struggling students through student behavioral characteristics. In order to improve the accuracy and reliability of prediction, a student academic warning model based on Stacking multi-model stacking is proposed. The model uses a variety of single prediction models, including logistic regression, support vector machine, XGBoost, GBDT, and integrates these models through the Stacking algorithm. The student academic alert model using Stacking multi-model stacking can overcome the situation of single-model prediction bias, and the Stacking technique can fully synthesize the advantages of each single model, so as to construct a more accurate prediction model.
When choosing base regressors, each base regressor is required to provide more accurate prediction results, and the similarity between base regressors should not be too high, in order to ensure that the reliability and robustness of the overall prediction results are improved. Only after selecting base regressors with diversity, independence and accuracy can the advantages of the Stacking algorithm be fully utilized to achieve more accurate and reliable predictions. By combining different regressors, a Stacking model is constructed to accomplish the final prediction task. Through the analysis and testing of multiple regressors, Random Forest, SVM, GBDT, and XGBoost algorithms are selected as the first layer of base classifiers, and the principle of each base regressor is described as follows:
1) Forest (RF) is an integrated learning algorithm that integrates multiple decision trees together and arrives at the final result by voting or averaging. Compared with a single decision tree, the random forest algorithm can better cope with problems such as data noise and overfitting, and has high accuracy and generalization ability [2]. In the process of training the random forest algorithm, it not only samples the data randomly, but also introduces a random selection mechanism for attributes, so that the attributes used for each training are different, thus increasing the diversity of the model, reducing the correlation between models, and having better generalization ability.
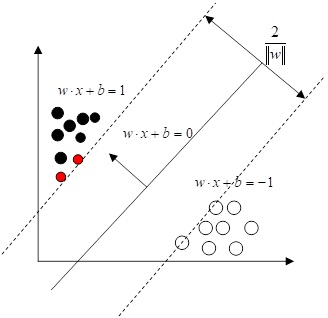
2) Support Vector Machine (SVM) is an algorithm that can solve linear and nonlinear classification problems. Its core idea is that in the original space when it is not possible to find a plane or hyperplane to divide the data into the desired categories, the data can be mapped into a high-dimensional space, so as to distinguish the data differences more clearly and effectively avoid the overfitting problem. The main principle is to achieve the purpose of classification by determining the support vectors on the boundary to have the maximum edge. The geometric space structure of two support vector machines is shown in Figure 1.

3) The Extreme Boosting Decision Tree (GBDT) is an integrated learning algorithm whose core idea is to continuously improve the accuracy of the decision tree through Boosting techniques. Specifically, the algorithm evaluates the error between the prediction result of the previous round and the true value in each iteration, and adjusts the weights of the samples according to the error, so that the misclassified samples get higher weights in the next round of training. This method continuously adds new classifiers and, unlike traditional Bagging, it focuses more on learning from misclassified data. Compared with Random Forest and Neural Networks, it is able to excel in handling high-dimensional sparse data and can adapt to new data with stronger generalization ability.
4) Extreme Gradient Boosting (XGBoost) is a machine learning technique that aims to improve the accuracy and efficiency of a model by optimizing the basic idea of GBDT. Compared with GBDT, XGBoost is optimized in three aspects: first, it expands the choice of learner models to support not only decision trees, but also other models for training. Second, XGBoost adopts a finer regularization strategy to prevent the effects of overfitting and noise errors. It makes the model more robust and reliable, and can handle more complex data. Finally, XGBoost optimizes the loss function to make the gradient descent search more efficient and accurate, which can speed up the training of the model.

Recall indicates the proportion of correctly predicted positive to
the total positive samples. The formula is shown in (3):
The F1-score is a reconciled value that combines Precision and Recall
and is used to reflect the overall metrics, calculated as shown in (4):
In this paper, we set up different early warning information prompts and personalized intervention strategies for students with different achievement levels.
On the one hand, according to the academic early warning model constructed above to predict the academic performance of learners, students with scores of less than 60 points are given a high degree of early warning, the specific measures are to call their parents to inform them of the integration of home and school supervision, and at the same time, personalized learning guidance and similar learning peers are recommended for the learners. For learners with scores between 60 and 70, a medium level of warning will be given, and specific measures will be taken to send out e-mails and study progress notes to urge learners to study in a timely manner. For learners with scores between 70-80, a low alert is given by sending a verbal reminder and a visual learning report to the learner. For students with scores above 80, no warning is given, and a visual learning report is sent directly to allow students to view the details of their mistakes and summarize them.
On the other hand, personalized learning video recommendations are made to all learners. Mining learners’ cognitive level and interest preferences, and combining the difficulty of knowledge points, to build a personalized learning video recommendation model. We recommend learning videos with personalized preferences for learners with different levels of achievement that meet the learners’ mastery of knowledge points.
The quantification of the ancillary domain rating data can be
calculated in terms of both the learner’s preference for the video and
the cognitive level, as shown in Eq. (5):
The learner’s rating of the video is weighted by the auxiliary domain
rating data and the target domain rating data, as shown in Eq. (6):
However, when choosing videos, learners mostly habitually choose
videos with higher popularity and score such videos higher. However, it
is difficult for this type of videos to reflect the differences in
interests among learners, instead, cold videos better reflect the
interests among learners. Therefore, in order to prevent the negative
impact of the above long-tail phenomenon on the similar results, this
paper adds the item popularity penalty factor, as shown in Eq. (7):
The rating data of all learners for video
For most online courses, there is a one-to-many correlation between videos and knowledge points and one or more paths between any two knowledge points, and the distance between these paths can be used to characterize the semantic similarity between videos.
The entity-relationship triad data in the video knowledge graph is
known, and in this paper, we utilize the PTransE model to embed the
existing entity-relationship triad information into a low-dimensional
vector space and generate the corresponding semantic vectors. The
semantic relationship path consists of directly connected knowledge
points and indirectly connected knowledge points. In order to avoid the
path is too long, resulting in reduced computational efficiency, this
paper chooses the length of 3 and the reliability score is greater than
0.01 of the relationship path. In this paper, each video
Firstly, function
For a path
A large number of experimental results have proved that the semantic
effect is best when using the additive model in the PTransE algorithm
for combining multi-path relations. Therefore, this paper adopts the
additive model in the semantic combination, such as the path from
Traditional collaborative filtering algorithms are less likely to
simultaneously consider the sparsity of scoring data, project
scalability, and cold start when similarity is calculated. In view of
this, this paper aims to improve the traditional collaborative filtering
algorithm by considering both the learner’s personalized behavioral
information and the semantic information contained in the videos when
similarity is calculated. Therefore, the similarity of learners’ ratings
of learning videos and the semantic similarity between learning videos
are calculated by linear fusion, as shown in Eq. (13):
The top
The student daily behavior data studied in this section were obtained from 500 undergraduate students of a college in the class of 2022 in University M. The timeframe was two full semesters of the academic year 2022-2023, in which the specific daily behavior data included the usual classroom performance behavior data, the one-card consumption behavior data, and the library borrowing behavior data, and the student’s final exam score data were also obtained as a prediction object.
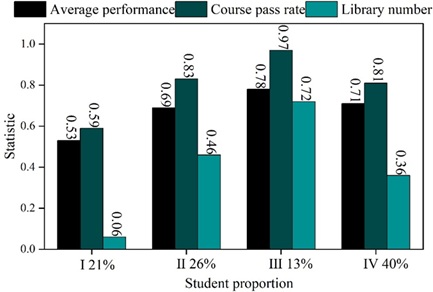
Using K-means algorithm for clustering analysis of student performance data and library access data, the clustering results of student learning data are shown in Figure 3. There are 4 groups of students, each group accounts for 21%, 26%, 13% and 40% respectively.

The average grades and course pass rate of students in Group I are low, and the number of times they go to the library is very small, which indicates that this group of students do not study hard enough, and the teacher should correct the learning attitude of this group of students.
The average grade of students in Group II is in the middle to upper level, the course passing rate is relatively high, and the number of times they go to the library is also high, which indicates that this group of students is particularly hardworking in their study, and belongs to the practical and diligent type of students. However, their performance is not very good because their learning methods are not easy to understand. Teachers should instruct this group of students on learning methods to improve their learning efficiency.
The average score of students in group III is very good, and the passing rate of the course is almost 100%, which means that this group of students belongs to the “bully” type of students who study very hard.
Students in group IV are in the middle of the scale compared to other types of students. Teachers should give encouragement to this group of students to increase their motivation to study.
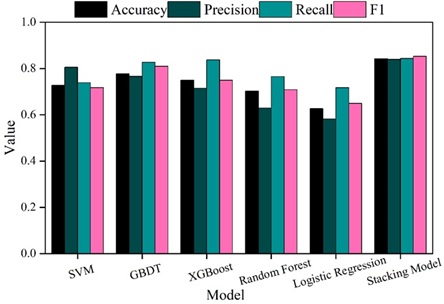
In this section, the performance of Stacking’s multi-model stacked academic alert model is tested through experiments, and after dividing the training set and test set, support vector machine, GBDT, XGBoost, random forest, and logistic regression are used to predict whether a student needs to be alerted or not, respectively, and the prediction results are shown in Fig. 4. It can be seen that Stacking’s multi-model stacked academic warning model has an accuracy, precision, recall, and F1 score of 0.8419, 0.8391, 0.8437, and 0.8522, respectively, which are better than a single base model in the problem of predicting student performance. It shows that the method of this paper can effectively warn the students who cannot reach the academic level, which is important for the educational management of students.

In this section, classes (1) and (2), with 45 students in each of the two classes, of a comparable level of specialization in a college in M, were selected for a controlled experiment. Class (1) as an experimental class uses the personalized management method designed in this paper for teaching management. Class (2) as the control class uses the traditional management mode. Before the beginning of the experiment, students’ test scores in specialized courses A, B, C and D were counted. The students’ examination scores in the four specialized courses are counted again at the end of one semester.
| Specialized course | N | Laboratory class | Cross-reference class | T | P |
| A | 90 |
65.32 |
65.22 |
0.22 | 0.253 |
| B | 90 |
67.63 |
67.59 |
0.16 | 0.224 |
| C | 90 |
69.12 |
69.33 |
0.34 | 0.218 |
| D | 90 |
64.36 |
64.28 |
0.16 | 0.209 |
| Specialized course | N | Pretest | Posttest | T | P |
| A | 45 |
65.32 |
83.96 |
3.26 | 0.006 |
| B | 45 |
67.63 |
86.49 |
2.34 | 0.003 |
| C | 45 |
69.12 |
89.63 |
3.11 | 0.004 |
| D | 45 |
64.36 |
84.74 |
1.96 | 0.000 |
| Specialized course | N | Pretest | Posttest | T | P |
| A | 45 |
65.22 |
68.16 |
1.36 | 0.126 |
| B | 45 |
67.59 |
68.42 |
1.24 | 0.059 |
| C | 45 |
69.33 |
68.51 |
1.11 | 0.076 |
| D | 45 |
64.28 |
68.32 |
2.03 | 0.234 |
| Specialized course | N | Laboratory class | Cross-reference class | T | P |
| A | 90 |
83.96 |
68.16 |
3.56 | 0.000 |
| B | 90 |
86.49 |
68.42 |
3.22 | 0.000 |
| C | 90 |
89.63 |
68.51 |
4.25 | 0.000 |
| D | 90 |
84.74 |
68.32 |
5.33 | 0.000 |
Research on the use of K-means clustering for academic monitoring to grasp the status of students’ learning progress. Construct Stacking multi-model superimposed academic warning model and learning video recommendation model to guide students’ personalized development in a targeted way. Use K-means clustering method to classify 500 student categories in college M. The method reasonably divides students into 4 categories. The accuracy, precision, recall, and F1 score of the designed academic alert model are 0.8419, 0.8391, 0.8437, and 0.8522, respectively, which outperform the single base model. After utilizing the designed academic early warning model and learning video recommendation model for education management, students’ performance is significantly improved compared to the traditional education management model. The method of this paper plays an obvious promotion effect for students’ personalized development.
1970-2025 CP (Manitoba, Canada) unless otherwise stated.