
With the aggravation of the global energy crisis and the improvement of environmental protection awareness, solar energy as a clean and renewable energy source is receiving more and more attention. As one of the core technologies of solar energy utilization, the performance and efficiency of solar cells are affected by a variety of environmental factors [5,24,10].
Sufficient light intensity can provide enough energy to the battery to generate electricity, thus improving the conversion efficiency of the battery. The solar irradiation intensity can be calculated by measuring the solar radiation illuminance meter. The relationship between light intensity and solar cell output power can be obtained through experiments, and then study the effect of light intensity on the performance of solar cells. The change of temperature also affects the current, voltage and conversion efficiency of solar cells [16,14,7,13]. High temperature increases the internal resistance of the cell and reduces the output power of the cell, while low temperature reduces the conversion efficiency of the cell. Therefore, in solar cell experiments, it is necessary to control the range of temperature changes, and analyze the effect of temperature on the battery by comparing the performance of solar cells at different temperatures [18,2,11,22]. Humidity is also another environmental factor in solar cell experiments. Changes in humidity may lead to the formation of water droplets on the surface of the solar cell, which in turn affects the ability of light transmission, reduces the incidence of light, and affects the power generation ability of the cell. Therefore, in solar cell experiments, it is necessary to control the range of humidity to prevent humidity changes from adversely affecting the solar cell [19,21,6,15].
[23] discussed the output performance of -àvis under different environmental conditions and simulated 310Wp polycrystalline modules using PVsyst software in order to analyze their performance, pointing out that, the performance of the modules is affected by factors from irradiance, temperature, shading effect, etc., and that choosing the right site and proper installation and maintenance is an important way to improve the performance of solar PV power plants. [25] explored the historical evolution and relationship between efficiency and stability, showing that if the stability is the same as the lifetime of the technology on the market, the large-scale deployment of PV systems with chalcogenide solar modules will be smooth sailing. [1] with the help of numerical thermal modeling analyzed the performance of silicon-based single-sun commercial PV panels in different physical and environmental states, including physical factors such as heat capacity and density, and environmental factors such as temperature and wind speed, and by varying these factors launched the analysis to produce results of the impact of each factor on the PV panels, and through these results PV designers will pay more attention to the critical areas of the panel to improve the output. [4] examined the effect of changes in temperature and irradiance on different solar cell parameters with the aim of evaluating the performance of solar cells in different environments. And there is a direct correlation between the efficiency of the solar module and the solar parameters, so the variation of solar parameters will have an impact on the efficiency of the solar module. [12] provided a comprehensive overview of photovoltaic cell technology, environmental impacts, and application prospects, and the literature review found that photovoltaics is one of the simplest ways to capture solar energy, and as a result, photovoltaic-based power generation has shown an upward trend. [8] explored the spectral dependence of eco-friendly materials based on dye-sensitized solar cells, CuZnSnSSe 2 and chalcogenide solar cells in different environments. The results of the study revealed that the spectral dependence was most pronounced for chalcogenide and DSSC solar cells, while the spectral dependence was lower for dye-sensitized solar cell based. [3] investigated the influence of solar PV panel performance by different environmental factors. An overview of solar photovoltaic power generation was given and it was emphasized that the output of solar PV systems can be affected by environmental changes such as color and shading. Experiments pointed out that the output power and efficiency are also affected by environmental factors. [9] described the studies related to the impact of environmental factors on the performance of solar photovoltaic cells, analyzing the results specified that the dust distribution and pollution effects are very important, while the humidity and temperature of the environment will affect the performance of photovoltaic modules, and discusses the solution strategies to cope with these influencing factors and their advantages and disadvantages.
In this paper, the solar cell simulation model is constructed through the mathematical model of solar cell on the basis of the working principle and characteristics of solar cell. The maximum power of solar cell operation is tracked and recorded by MPPT algorithm and Boost circuit parameters. Simulation simulation experiments are utilized to initially explore the effects of season and weather conditions on the output power of solar cell operation. Then, the current output of the solar cell is further explored when the environmental factors such as light, temperature and wind speed change, and the current and power output of the solar cell are examined under different light, temperature and wind speed in the same season, in order to explore the sensitivity of the solar cell to environmental changes.
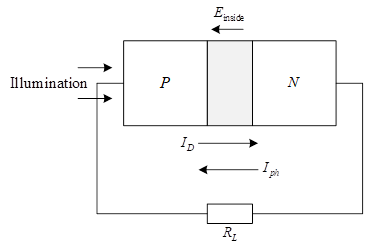
Solar internal structure, the connection of N-type semiconductor and P-type semiconductor, electrons are transferred along the NP direction, holes are gradually expanded, P-type semiconductor one end of the negative charge is more and more, the N end of the positive charge is more, so the battery internal formation of the electric field.PN junction is susceptible to the influence of light, if the photon effect is strong enough, then the internal structure of the battery will be electron movement, by the influence of the internal electric field, the electron and hole Formation is opposite to the above, when the N region gathers a large number of negative electrons, forming the opposite photoelectric field. When the incident light intensity gradually increased, the resulting electric potential will become larger, the load and the battery connection, at this time the line will form a current. The working principle of the solar cell is shown in Figure 1.
Batteries connected to the circuit, if you disconnect the voltage at both ends of the device, this voltage is the open-circuit voltage, recorded as \(U_{\infty }\), which can also be called the battery electromotive force. When the battery is in a no-light environment, \(U_{\infty } =0\). A large number of studies have shown that, in addition to the device preparation materials will affect the performance of the battery, the incident light intensity will also have a greater impact on its performance, and there is a nonlinear positive correlation between the two.
The current in the load circuit of the battery is the short-circuit current, denoted as \(I_{SC}\). In the case of not replacing the battery, when the incident intensity is changed, the load circuit current will be changed accordingly, and there is a certain linear relationship between the two. The main reason for such a situation is that the number of photons gradually increases under the condition of increasing light intensity, and a large number of photons cause greater excitation of holes and electrons, and the short-circuit current formed in the intense reaction becomes larger.
A variable resistor is selected as the line load (denoted as R) and connected to the solar cell. If the incident light intensity in the environment where the battery is located remains unchanged, when the load resistance changes, in addition to the circuit voltage (denoted as U) changes, the current in the line (denoted as I) will also change, record the values of the battery output voltage and current under different load resistances, and plot them as a volt-ampere characteristic curve. Calculate the output power of the battery, mark the maximum value as \(P_{max}\), and mark the current current and voltage values as \(I_{mp}\) and \(U_{mp}\) respectively. According to the values of these two parameters, the load resistance can be calculated as \(R_{mp}\), which is the optimal load resistance for battery operation.
Regarding the calculation of the battery output power capacity, it is obtained by using the filling factor or power curve factor calculation, and the following formula is used: \[\label{GrindEQ__1_} F\bullet F=(U_{mp} \bullet I_{mp} )/(U\infty \bullet I_{SC} ) . \tag{1}\]
According to the relationship between the factors in Eq. (1), it can be seen that the filling factor becomes larger with the increase of the output power, and the performance of the battery will be improved under this condition. In general, the filling factor is able to reach 80%.
Silicon cell is the use of semiconductor photovoltaic effect to convert solar energy directly into electricity, is the most commonly used one. The output voltage, current and power of a single photovoltaic cell are very small, the voltage is only about 15W, and the output power is only 1-2W, which is far from being able to meet the requirements of the application as a power source. In order to improve the output power of photovoltaic cells, it is necessary to encapsulate multiple single cells into photovoltaic modules, and then form multiple photovoltaic modules into photovoltaic arrays, and then output the electrical energy in the form of photovoltaic arrays.
In order to realize solar photovoltaic power generation and optimize the design of photovoltaic cells, it is necessary to carry out an in-depth analysis of the mathematical model of solar cells in order to study and design the photovoltaic power generation system.
The equation of voltage and current (I-V) of silicon solar photovoltaic cell is: \[\label{GrindEQ__2_} I=I_{ph} -I_{0} \left\{\exp \left[\frac{q(U+IR_{s} )}{nKT} \right]-1\right\}-\frac{U+IR_{s} }{R_{sh} } . \tag{2}\]
In Eq. (2), \(I_{d} =I_{0} \left\{\exp \left[\frac{q\left(U+IR_{s} \right)}{nKT} \right]-1\right\}\) is the semiconductor diode junction current, \(q\) is the electron charge (\({\rm 1.6}\times {\rm 10}^{{\rm -19}} {\rm C}\)),\(R_{sh}\) is the shunt resistance (for high resistance values, order of magnitude \({\rm K\Omega }\)), \(K\;\) is the Boltzmann’s constant (\({\rm 1.38}\times {\rm 10}^{{\rm -23}} {\rm J/K}\)),\(I_{ph}\) is the photovoltaic current (A), \(N\) is the diode quality factor, \(I_{0}\) is the reverse saturation current (for photovoltaic systems, it is of order of magnitude \({\rm 10}^{{\rm -1}} {\rm A}\)), \(T\) is the absolute temperature (t+273)K, \(R_{s}\) is the series resistance (for low resistance values, less than \({\rm 1\Omega }\)).
Eq. (2) for the physical principle of photovoltaic cells the most basic analytical expression, due to the formula parameter \(I_{sh} ,I_{0} ,R_{s} ,R_{sh} ,N\) is not only related to the solar light intensity and the temperature of the photovoltaic cell, to determine these parameters is also very difficult, due to the manufacturer to provide the technical parameters is not a suitable for different light intensity of the precise data, so there is not much practical value of the analysis. So it is necessary to establish both practical and more accurate simplified mathematical model of engineering photovoltaic cells.
Under the standard experimental conditions (light intensity of \({\rm 1000W/m}^{{\rm 2}}\), ambient temperature of 25 \(\mathtt{{}^\circ\!{C}}\)) solar module PV of \(I_{sc} ,U_{oc} ,I_{n} ,U_{n} ,P_{n}\) is generally manufacturers provide important parameters, very reference price, which, \(I_{n}\) is the maximum power point at the output current, \(U_{m}\) is the maximum power point at the output voltage, \(I_{sc}\) is the short-circuit current, \(P_{n}\) is the maximum output power, \(V_{oc}\) is the open-circuit voltage.
As when the light intensity is larger, the photocurrent is much larger than \((U+I_{is} )/R_{sh}^{'}\).
Therefore, the item in Eq. (2) can be ignored, which can be simplified to: \[\label{GrindEQ__3_} I=I_{ph} -I_{0} \left\{\exp \left[\frac{q(U+IR )}{nKT} \right]-1\right\} . \tag{3}\]
If the open-circuit voltage and short-circuit current of the solar cell are \(U_{cc} ,l_{se}\) respectively under certain light conditions, then Eq. (3) can be simplified as: \[\label{GrindEQ__4_} I=I_{sc} \left\{1-A\left[\exp \frac{BU}{U_{oc} } -1\right]\right\} , \tag{4}\] A, B in Eq. (4) are constants to be determined, which can usually be determined by the following method.
Turn Eq. (4) into a voltage expression: \[\label{GrindEQ__5_} U=\frac{U_{oc} }{B} \ln \frac{(1+A)I_{sc} -I}{AI_{sc} } . \tag{5}\]
At the point of maximum power of the photovoltaic cell it is known that: \(I=I_{a} ,U=U_{a}\) Substituting into Eq. (5) and organizing it gives expression (6): \[\label{GrindEQ__6_} B=\frac{U_{oc} }{U_{m} } \ln \frac{(1+A)I_{sc} -1}{AI_{sc} } . \tag{6}\]
In the open circuit state, at \(I=0\), \(U=U_{oc}\), then Eq. (5) becomes expression (7): \[\label{GrindEQ__7_} B=\ln \frac{1+A}{A} . \tag{7}\]
The approximate solution for A (A\(\mathrm{<}\)\(\mathrm{<}\)1 at room temperature) is obtained from Eqs. (6) and (7): \[\label{GrindEQ__8_} A=\left[\frac{I_{sc} -I_{m} }{I_{sc} } \right]^{\frac{U_{oc} -U_{m} }{U_{m} } } . \tag{8}\]
It can be seen that according to this model only need to input the usual technical parameters of solar photovoltaic cells \(I_{sc} ,U_{oc} ,I_{n} ,U_{n}\), by the formula (7) and formula (8) conjunction of A, B, and then by the experiment to determine the different light intensity of \(I_{sc} ,U_{oc}\), and finally through the formula (4) can be determined by the solar photovoltaic cells in different light intensity of the \(I-V\) characteristics of the curve.
From Eq. (5) we can obtain the output power expression (9) of the PV cell: \[\label{GrindEQ__9_} P = IU = I \frac{U_{\infty}}{B} \ln \frac{(1 + A)I_{\infty} – 1}{AI_{\infty}}. \tag{9}\]
From the above obtained by the simplified model of photovoltaic cell formula (4) and formula (2) comparison can be seen, formula (4) right does not contain the current I, so that in some simple analysis of the calculation is particularly convenient, the disadvantage is that the simplified model can not directly reflect the temperature and light intensity on the output characteristics of the solar cell. The following further analysis in the establishment of the PV cell model suitable for simulation analysis.
The photovoltaic cell output current \(I_{\rho {\rm h}}\) is jointly affected by the light intensity G and the ambient temperature T. Eqs. (10) to (12) are used to express the relationship between them: \[\label{GrindEQ__10_} I_{ph} =I_{ph(T1)} (1+K_{0} (T-T_{1} )) , \tag{10}\] \[\label{GrindEQ__11_} I_{ph(T1)} =\frac{GI_{st(T1,nom)} }{G(nom)} , \tag{11}\] \[\label{GrindEQ__12_} K_{0} =\frac{(I_{sc(T2)} -I_{sc(T1)} )}{I_{sc(T1)} (T_{2} -T_{1} )} . \tag{12}\]
The reverse current \(I_{0}\) of the diode of the equivalent electrical model of the photovoltaic cell is affected by the ambient temperature T. Their relationship can be expressed by Eq. (13), and the diode saturation current \(I_{0}\) at a certain temperature T can be calculated by Eqs. (13), (14): \[\label{GrindEQ__13_} I_{0} =I_{0(T1)} \left(\frac{T}{T_{1} } \right)\exp \left(\frac{-qE_{g} }{nK} \left(\frac{1}{T} -\frac{1}{T_{1} } \right)\right) , \tag{13}\] \[\label{GrindEQ__14_} I_{0(T1)} =\frac{I_{sc(T1)} }{\exp \left(\frac{qU_{oc(T1)} }{nKT_{1} } \right)-1} . \tag{14}\]
The PV cell model resistance Rs can be calculated from Eqs. (15), (16), which are obtained by differentiating and simplifying both sides of Eq. (3), and \(\frac{dU}{dI} |U_{oc}\) can be obtained from the PV cell manufacturer: \[\label{GrindEQ__15_} R_{s} =-\frac{dU}{dI} |U_{oc} -\frac{1}{X\nu } , \tag{15}\] \[\label{GrindEQ__16_} X\nu =I_{0(T1)} \frac{q}{nKT_{1} } \exp \left(\frac{qU_{oc(T1)} }{nKT_{1} } \right) . \tag{16}\]
The above PV array model of formula derivation arithmetic process is very complex, but in MATLAB can be convenient for simulation calculations, and output current-voltage I-V, power-voltage P-V characteristic curve. Through the formula (10) \(\mathrm{\sim}\) (16) and related photovoltaic cell electrical parameters, and then use the MATLAB language can be established in the photovoltaic array PV computer model, with the form of embedded functions to write the program, through the embedded function call by the voltage U, light intensity G, temperature T can be calculated from the current I, which can be in the computer simulation of photovoltaic array volt-ampere I-V characteristic curve.
The current I in Eq. (3) on the left and right sides from in, and is an exponential function of the relationship, through the voltage V to solve I is very complex, but by using the Newton iteration method to find an approximate solution to Eq. (3) is easier, where the use of five Newton iterations can be calculated.
In the PV cell square array mathematical model, Eq. (3) is changed to: \[\label{GrindEQ__17_} I_{ph} -I_{0} \left\{\exp \left[\frac{q(U+IR_{s} )}{nKT} \right]-1\right\}-I=0 . \tag{17}\]
Expressed as a function: \[\label{GrindEQ__18_} f(I)=I_{ph} -I_{0} \left\{\exp \left[\frac{q(U+IR_{s} )}{nKT} \right]-1\right\}-I . \tag{18}\]
Expression (18) is obtained by derivation on both sides: \[\label{GrindEQ__19_} f'(I)=-1-I_{0} \exp \left[\frac{q(U+IR_{s} )}{nKT} \right]\frac{qR}{nKT} . \tag{19}\]
The initial value is set to \(I=0\), and the value of I can be found by calculating \(I=I-\frac{f(I)}{f^{{'} } (I)}\) through five Newton iteration cycles.
The sub-Newton iteration method is used to find the approximate solution of Eq. (3), which has high accuracy and can meet the requirements of PV system simulation.
The photovoltaic cell power generation system is connected to the DC bus through a DC/DC boost chopper circuit and the voltage connected to the DC/DC is used as the reference voltage for the maximum power tracking technique. The photovoltaic power generation system is mainly composed of three parts: the photovoltaic panel system, the DC/DC boost circuit, and the maximum power controller. The power generated by the PV power generation system is supplied to the load through the DC/DC boost chopper circuit. The basic function of the DC/DC boost chopper circuit is to solve the problem of low output voltage and soft output characteristics by adjusting the duty cycle of the switching devices. At the same time, the active output power of the battery stack can effectively track the changes in the external environment by attaching an MPPT controller [17,20]. The DC/DC boost chopper circuit is shown in Figure 2.
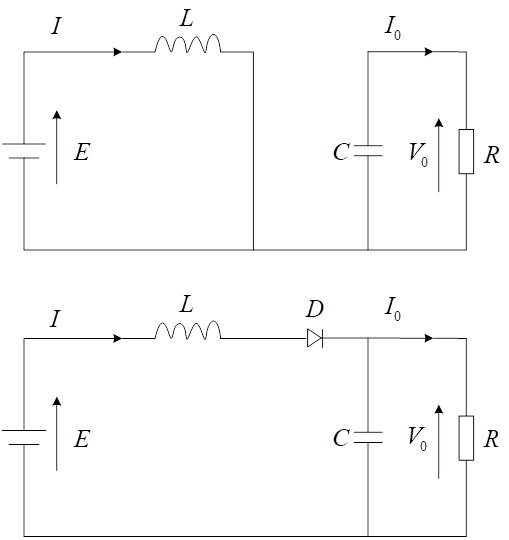
The equivalent circuit diagram of the DC/DC boost chopper circuit for maximum power tracking is shown in Figure 3, where S is the main switch, L is the filter inductor, C is the filter capacitor, and R is the load equivalent resistance.
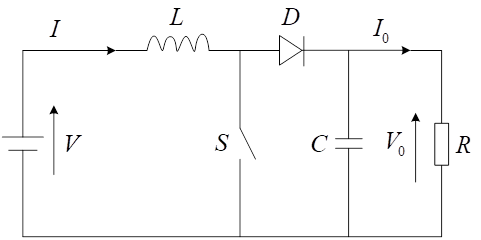
The dynamic process of the DC/DC boost circuit can be described by the following equation: \[\label{GrindEQ__20_} \frac{dI}{dt} =\frac{V}{L} -\frac{(1-D)}{L} V_{0} , \tag{20}\] \[\label{GrindEQ__21_} \frac{dV_{0} }{dt} =\frac{(1-D)}{L} I-\frac{1}{RC} V_{0} , \tag{21}\] where \(I,V,V_{0}\) and \(D\) are the output current of the boost circuit, the input voltage, the output voltage, and the duty cycle of the boost chopper circuit, respectively.
When the converter is in steady state operation, the mean value of the inductor voltage is 0 during a complete switching state switching week, then the output voltage of the boost circuit can be expressed as: \[\label{GrindEQ__22_} V_{0} =\frac{V_{fc} }{1-D} . \tag{22}\]
From Eq. (22), it can be seen that the relationship between the output voltage of the boost circuit and the input voltage mainly depends on the duty cycle of the boost converter. Assuming that the efficiency of the DC/DC boost chopper circuit is 100%, i.e., the input power is equal to the output power, it can be formulated as: \[\label{GrindEQ__23_} R_{in} =\frac{V_{fc} }{I_{fc} } =\left(\begin{array}{c} {1-D} \end{array}\right)^{2} R , \tag{23}\] \(R_{in}\) is the equivalent input resistance of the boost chopper circuit, photovoltaic systems or fuel cells for grid-connected loads remain basically unchanged, so you can adjust the duty cycle of the omni-controllable device, change the equivalent input impedance of the boost chopper circuit, to achieve the impedance matching with its internal resistance, so as to achieve the purpose of maximum power tracking.
When the fuel cell/photovoltaic cell external direct access to the load without boost chopper, will be based on the size of the external load connected to the different power operating point will change, and the existence of a unique load value and fuel cell or photovoltaic cell internal resistance matching, so that it works at the maximum power. When the external environment changes, the main cause of its internal resistance changes, so that it and the connected load does not match, no longer output the maximum active power, resulting in waste of energy and work instability. This requires a maximum power tracker to change the duty cycle of the DC/DC boost chopper in real time according to the changes in the environment, to realize the matching with the internal resistance of the system and to output the maximum active power, which is the basic principle of maximum power tracking.
The DC/DC boost chopper circuit operating modes are categorized as current intermittent and current continuous [26]. The current intermittent and current continuous are shown in Figure 4.
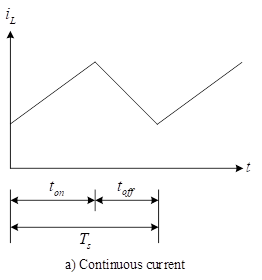
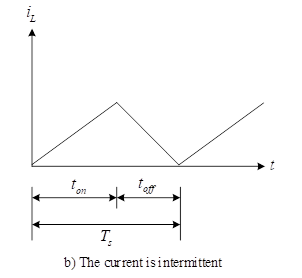
The two modes of operation of the DC/DC voltage-generating chopper circuit are shown in Figure 5, in terms of the opening and closing of the fully controllable devices of the boost chopper circuit. Assuming that the boost chopper circuit operates in the current continuous mode, the current in its inductor increases when switch S is in the closed state. When the switch S is disconnected, the power supply and the inductor charge the capacitor C through the diode D and supply power to the resistor, at which time the inductor current decreases, generating an induced electromotive force and releasing energy to the outside world.
If the inductance and capacitance is not large enough, during the switch S disconnect will make the inductor current gradually drop to zero and maintain for a period of time, wait until the switch S closed, the inductor current will be increased from zero again, the inductor current intermittent state. For this reason it is assumed that the inductor current is in the current-continuous mode, and its inductor capacitance is designed to be greater than its minimum value, see the following equation: \[\label{GrindEQ__24_} L\ge \frac{DV}{\Delta I_{L} f} , \tag{24}\] \[\label{GrindEQ__25_} C\ge \frac{V_{0} D}{\Delta V_{0} fR} , \tag{25}\] where, \(D\) is the duty cycle of the switch, \(\Delta I_{L}\) is the peak-to-peak value of the inductor current ripple, \(\Delta V_{0}\) is the peak-to-peak value of the output voltage ripple, and \(f\) is the switching frequency.
In this paper, through simulation experiments, we initially analyze the effects of weather and season on the current output of solar cells, and then further analyze the changes in the output of solar cells under the changes of environmental factors, such as light, temperature and wind speed, to explore the sensitivity of solar cells to environmental changes.
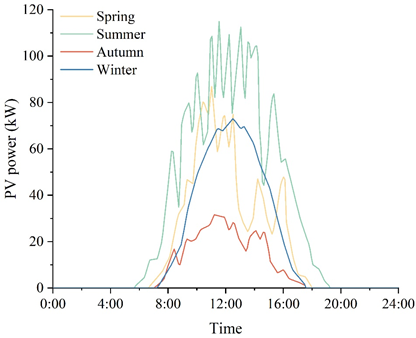
In order to validate the power output of solar cells based on seasonal characteristics, the data of a whole year is selected for comparative analysis in this subsection. The power output of the solar cell under four seasons is shown in Figure 6. Observing Figure 6, it can be seen that the maximum value of solar cell power output in descending order of seasons is as follows: summer \(\mathrm{>}\) spring \(\mathrm{>}\) winter \(\mathrm{>}\) fall, and the maximum output power of solar cell in spring, summer, fall and winter are 86.83 kW, 114.93 kW, 31.58 kW and 72.96 kW respectively. The maximum output power occurs at around 12 noon. The seasonal order of the total output power of solar cells from largest to smallest is: summer \(\mathrm{>}\) winter \(\mathrm{>}\) spring \(\mathrm{>}\) fall. The total output power of solar cells in spring, summer, fall and winter is 4095.19kW, 7407.69kW, 1748.96kW and 4124.13kW respectively.
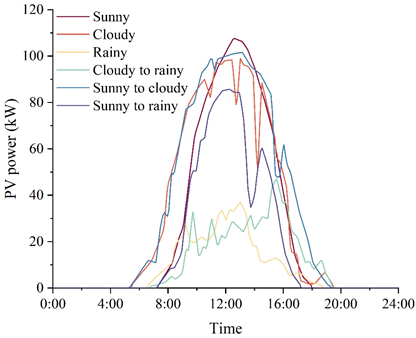
Based on the non-stationary and periodic characteristics and the non-linear relationship between power output and the influencing factors, the analysis of solar cell power output based on weather classification is further proposed on the basis of seasonal division. In this paper, the power output of solar power generation system is categorized into six types based on weather conditions: sunny, cloudy, rainy, cloudy to cloudy, sunny to cloudy, and sunny to cloudy. The power output of solar cell in six types of weather is shown in Figure 7.
As can be seen in Figure 7, the peak solar cell power outputs for the six weather conditions are: sunny (107.56 kW), cloudy (99.00 kW), rainy (37.06 kW), cloudy to cloudy rain (47.10 kW), sunny to cloudy (101.49 kW), and sunny to cloudy rain (85.43 kW), respectively. The maximum peak occurs on sunny days and the minimum peak occurs on rainy days, which is in line with the conventional perception. The total output power of the solar cell for the six weather conditions of sunny, cloudy, rainy, cloudy to cloudy, sunny to cloudy, and sunny to cloudy are 6227.37kW, 7117.13kW, 1955.27kW, 2465.04kW, 7896.93kW, and 4412.73kW, respectively.The top three weather conditions for the total output power are sunny to cloudy, cloudy, and sunny.
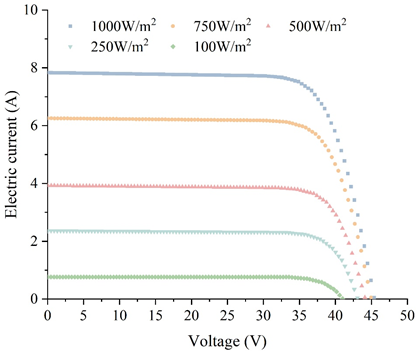
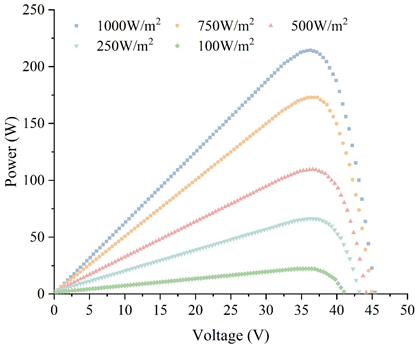
In order to verify the effect of light intensity on the output characteristics, it is necessary to set the ambient temperature at 25\(\mathtt{{}^\circ\!{C}}\) unchanged. At this time, the I-V characteristic curves and P-V characteristic curves of the solar cell were tested under five light intensities of 1000W/m², 750W/m², 500W/m², 250W/m² and 100W/m², respectively, and the power output curves of the solar cell under different light intensities are shown in Figure 8.
When the temperature is kept constant at 25\(\mathrm{{}^\circ}\)C, the current-voltage output characteristic curves of the solar cell under five light intensities are given in Figure 8a, and the power-voltage output characteristic curves of the solar cell under five light intensities are given in Figure 8b, and the analysis of the current-voltage characteristic curves shows that when the light intensity decreases from 1000W/m² to 100W/m², the current at the maximum power point will then When the light intensity decreases from 1000W/m² to 100W/m², the current at the maximum power point decreases from 7.83A to 0.76A. From the analysis of the power-voltage characteristic curve, it can be seen that the maximum power value also decreases along with the decrease of the light intensity from 214.47W to 22.00W, and the voltage at the maximum power point will be shifted a little bit, but the overall change is not significant.
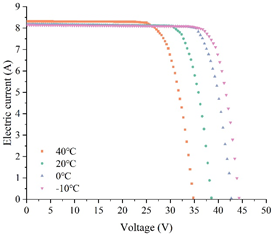
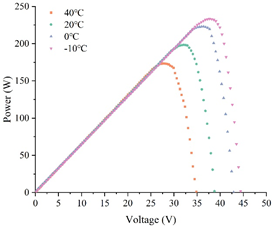
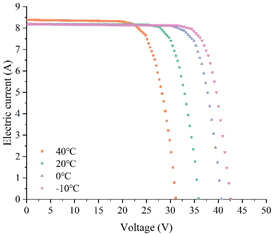
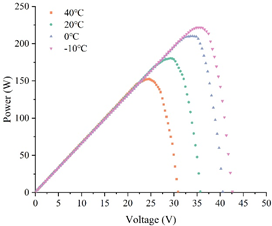
The effect of ambient temperature on the output power of PV cells is discussed here. Considering the effect of dust accumulation, given the solar irradiance of 1000W/m², wind speed of 5m/s, the transmittance \(\beta\) of the dust accumulation solar panel is 0.5, and the selected ambient temperatures are -10\(\mathtt{{}^\circ\!{C}}\), 0\(\mathtt{{}^\circ\!{C}}\), 20\(\mathtt{{}^\circ\!{C}}\), and 40\(\mathtt{{}^\circ\!{C}}\), respectively, which are inputted into the Simulink’s simulation model, then the I-V curves and the P-V curves of the PV cells are obtained respectively, and the I-V curves and P-V curves under the environment with different temperatures in spring, summer and fall are shown in Figure 9, and the I-V curves and P-V curves under different temperatures in winter are shown in Figure 10. The I-V curve and P-V curve under different temperature environments in spring, summer and fall are shown in Figure 9, and the I-V curve and P-V curve under different temperature environments in winter are shown in Figure 10, where Figure 9a is the I-V curve and Figure 9b is the P-V curve.
From Figures. 9 and 10, it can be seen that the effect of ambient temperature on the output characteristics of PV cells is different from the effect of light on them. Specifically, the effect of ambient temperature on the short-circuit current is very small, and as the ambient temperature rises from -10\(\mathtt{{}^\circ\!{C}}\) to 40\(\mathtt{{}^\circ\!{C}}\), the short-circuit current increases slightly. The short-circuit current increases slightly from 8.14 A to 8.32 A. However, the effect of temperature on the open-circuit voltage is very large, and the open-circuit voltage decreases greatly with the increase of temperature from 233.36 W at -10\(\mathrm{{}^\circ}\)C to 176.51 W at 40\(\mathrm{{}^\circ}\)C. At the same time, the decrease of the open-circuit voltage (56.85) is much larger than the increase of the short-circuit current (0.18). In addition, it can also be seen from the P-V graphs in Figure 9 and Figure 10 that the maximum output power of the solar cell also decreases with the increase in ambient temperature.
The results show that the increase in ambient temperature has a negative effect on the output power of the solar panel. This is mainly due to the fact that the ambient temperature affects the surface temperature of the PV panel through heat conduction, so that the panel temperature changes with the ambient temperature, which in turn affects the open-circuit voltage and output power of the solar panel. As solar panels are exposed to the external environment for a longer period of time, and are negatively affected by dust accumulation and other factors, the heat dissipation ability of solar panels gradually decreases, and the surface temperature gradually rises, which ultimately reduces the output performance of solar panels.
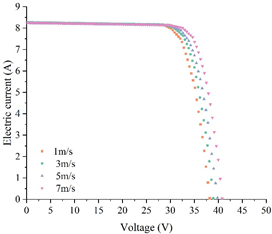
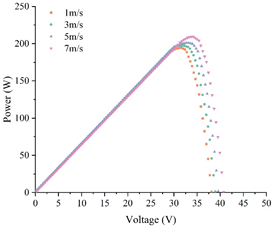
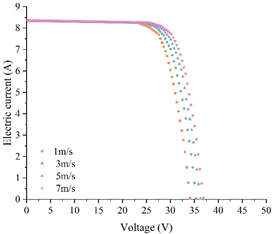
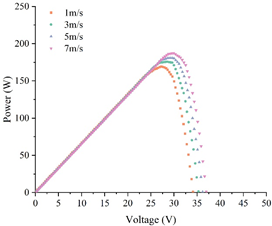
This subsection discusses the effect of wind speed on the output power of solar cells. The selected wind speeds are 1m/s, 3m/s, 5m/s, and 7m/s, and it is assumed that there is dust accumulation on the surface of the solar panel, the ambient temperature is 25\(\mathrm{{}^\circ}\)C, the solar irradiance is 1000W/m², and the transmittance \(\beta\) of the dust-accumulated solar panel is 0.5, and the parameters are inputted into the simulation model of Simulink, which is constructed, and the I-V curves and P-V curves of the solar cells are obtained, and the I-V curves and P-V curves in spring I-V curves and P-V curves under different wind speeds in summer and fall seasons are shown in Figure 11, and I-V curves and P-V curves under different wind speeds in winter are shown in Figure 12.
From Figures. 11 and 12, it can be seen that the ambient wind speed has a small effect on the short-circuit current of the solar panel, while it has a large effect on the open-circuit voltage, and the open-circuit voltage increases with the increase of wind speed. Meanwhile, observing the P-V characteristic curve in Figure 11, it can be found that the maximum output power is about 209.30W when the wind speed is 7m/s, 201.05W when the wind speed is 5m/s, 200.33W when the wind speed is 3m/s, and 194.28W when the wind speed is 1m/s, which shows that the wind speed also has a large effect on the output power of the solar panel, and the open-circuit voltage increases with the increase of wind speed. The results show that the wind speed also has a greater effect on the output power of the solar panel and the maximum output power increases with the increase in wind speed and the same conclusion can be obtained by observing Figure 12. This indicates that different wind speeds affect the heat dissipation efficiency of the solar panel, and the higher the wind speed, the higher the heat dissipation efficiency, which directly changes the operating temperature of the photovoltaic module, so that the module temperature decreases with the increase of wind speed, which in turn changes the output power of the solar panel, so that it increases with the increase of wind speed.
In this paper, after studying the working principle, characteristics and mathematical model of solar cells, we establish a solar cell simulation model and use MPPT algorithm to track the maximum power of solar cell operation. Simulation simulation experiments are conducted to explore the effect of environmental changes on the power output of the solar cell.
The peak maximum value of solar cell power output is in summer with a peak value of 114.93kW and the minimum value is in fall with 31.58kW. The maximum value of total solar cell power output is 7407.69kW, which occurs in summer. The minimum value is 1748.96kW which occurs in fall. The maximum peak solar cell power output is 107.56kW (sunny day) and minimum is 37.06kW (rainy day). The maximum and minimum values of total solar cell power output for the six weather conditions are 7896.93kW and 1955.27kW which occurs in the sunny to cloudy and rainy days respectively.
The current at the maximum power point of the solar cell decreases with decreasing light intensity, and the maximum power value also decreases with decreasing light intensity. The ambient temperature has little effect on the short-circuit current, the output current increases slightly (0.18) with increasing temperature, the open-circuit voltage decreases sharply (56.85) with increasing temperature, and the maximum output power also decreases with increasing temperature. The maximum output power of the solar cell increases with the increase of wind speed, when the wind speed increases from 1m/s to 7m/s, the maximum output power increases from 194.28W to 209.30W.