
With the rapid development of artificial intelligence and Internet information technology, the application of Internet technology in financial technology (financial technology; Fintech) is born in response [1,2]. Therefore, it is an important direction in the field of financial technology to use robots to process huge financial data to assist investors in financial investment analysis. Machine learning is based on a large number of data, through automatic learning algorithm to identify complex data styles, and then make intelligent decisions [3]. For the problem of stock price forecasting, the traditional research mostly uses multivariate regression [], generalized automated regression conditional variables [6,7].
With the rapid development of information technology, the effective application of information technology in a short period of time to consider many indicators, stock price forecasting is a topic of concern to investors. Therefore, using intelligent data analysis method to predict stock price is one of the important topics in the field of financial technology. However, the stock market is affected by many uncertain factors and is not easy to predict accurately, so the prediction of stock price is considered to be a very challenging topic. Therefore, many scholars use machine learning algorithm to predict the stock price. [8] used artificial neural networks (ANN); ANN and support vector machines (SVM)), using 10 technical indicators to predict the performance of Istanbul Stock Exchange (ISE) National 100 index. [9] used neural network to predict the stock price of Brazil Distribution Company in Sao Paulo stock exchange, and evaluated its performance with mean absolute error (MAE), mean absolute percentage error (MAPE) and root mean square error (RMSE). [10] used neural network, support vector machine, random forest and simple Bayesian method to predict the rise and fall of Indian stock market. Therefore, it is an important trend to use machine learning algorithm to predict the rise and fall of stock price to provide investment decision and analysis.
However, there are many technical indicators and factors affecting the prediction of stock price rise and fall, and the characteristics of indicators and the subjective cognition of investors will affect the accuracy of the prediction of stock price rise and fall. Therefore, using fuzzy semantics to express the cognition of investors’ semantic judgment can reduce the uncertainty and fuzziness in the process of stock price rise and fall prediction, and then provide investors with more flexible decision analysis results [11,12]. Therefore, based on machine learning algorithm, through the selection of important technical indicators and the combination of fuzzy inference method, this study constructs a stock price forecasting system to predict the stock price trend and range, so as to facilitate investors’ decision-making and analysis [13].
[14] applied support vector machine to solve the estimation problem of multidimensional function. SVM is to find a classification hyperplane in high-dimensional space, and separate different types of data, so as to maximize the interval between different types of points. After that, SVM is also applied in various fields, including text classification, image recognition and financial forecasting [15].
Decision tree selects branch variables according to goal setting, and presents the results in a hierarchical structure. It uses a tree structure to deal with classification problems, and the visual effect is very rich [16]. The internal nodes of the decision tree represent the properties of the test, each branch represents the possible test results, and the leaf nodes represent the category labels.
K nearest neighbor method is a nonparametric classification method [17]. KNN uses the similarity between a test data and a group of training data to classify according to the nearest neighbor. If K neighbors need to be considered, it is k nearest neighbor method [18,19]. The advantage of KNN lies in its simple concept, intuitive algorithm and easy implementation, but when the number of sample data is large, the main disadvantage of KNN is that the calculation times of its distance will be too many.
Artificial neural network; Ann is a non-linear system, which consists of multiple neurons to simulate the physiological model [20,21]. A neural network is composed of many artificial neurons and their connections, and can form a variety of network models. Among them, back propagation neural network (BPNN) is a multi-layer network structure with learning ability, and it is also the most widely used neural network algorithm [22,23].
2.2. Analysis of Stock Price ForecastIn recent years, with the rise of financial technology, smart finance or investment analysis has become an important development trend [24]. Among them, the stock market is one of the most important channels for financial management. However, due to many factors affecting the stock market and the uncertainty of human and economic environment, stock market forecasting is considered to be a challenging issue. This study summarizes the literature on the application of machine learning in stock price forecasting, as shown in Table 1.
| Author’s name | Forecast method |
| Atsalakis and Valavanis | Neuro-Fuzzy |
| Hadavandi et al. | Genetic Fuzzy Artificial Neural Network) |
| Chen and Chen | Back Propagation Neural Network |
| Kara et al. | Artificial Neural Network Support VectorMachine |
| Chang | Evolving Partially Connected NeuralNetworks |
| Lahmiri | Support Vector Machine |
| Laboissiere et al. | Artificial Neural Network |
| Patel et al. | Artificial Neural Network Support VectorMachine Random Forest Naive-Bayes |
| Patel et al. | Support Vector Regression + ArtificialNeural Network Support VectorRegression + Random Forest SupportVector Regression + Support VectorRegression |
| Wang et al. | Support Vector Regression + PrincipalComponent Analysis + Beam SearchOptimization |
| Lahmiri | Particle Swarm Optimization+Back Propagation Neural Network |
| Chen and Hao | Feature Weighted Support VectorMachine Feature Weighted K-NearestNeighbor |
As a matter of fact, it is not easy for people to express their feelings about many things or problems in daily life by using binary explicit values. Using the logical concept of fuzzy set, we can express subjective opinions more flexibly [25-27]. Fuzzy inference is to use membership function to calculate the degree of membership of input value to each rule. After synthesizing the degree of membership of all rules, appropriate inference results can be obtained.
Because the data preprocessing and discretization will affect the effect and accuracy of data analysis, it is necessary to fuzzily the data appropriately to construct the membership function [28]. However, if the membership function is determined by users or experts themselves, it will not be able to truly present the situation of data dissemination and objectively classify the data [12, 28,29]. Therefore, a systematic method should be used to construct the membership function of data attributes. The main methods for generating the center point of membership function include K-means clustering [30], fuzzy c-means clustering [31], quartile method and the method of adding and subtracting standard deviation of mean value.
When there is not only one inference rule, Mamdani’s min max method is generally used to integrate inference rules [32].
Generally speaking, there are three main methods to solve fuzziness, namely discrete barycenter method, continuous barycenter method, and maximum mean method [21]. In this study, the membership function of the inference result is divided into k intervals, and the discrete barycenter method is used to solve the fuzziness [22]:
\[\label{e1} y^*=\frac{\sum_{k=1}^K y_k B\left(y_k\right)}{\sum_{k=1}^K B\left(y_k\right)},\tag{1}\] here, \({y^*}\)is the numerical value of the solution.
2.4. Evaluation of Forecasting EffectivenessThe commonly used method to evaluate the predictive effectiveness of categorical data is the binary classification confusion matrix analysis. However, when the prediction results have multiple classifications, the chaos matrix of multiple classifications must be used, as shown in Table 2.
| Predicted value | ||||
|---|---|---|---|---|
| \(A_1\) | \(A_j\) | \(A_n\) | ||
| True value | \(A_1\) | \(N_{11}\) | \(N_{1j}\) | \(N_{1n}\) |
| \(A_i\) | \(N_{i1}\) | \(N_{ij}\) | \(N_{in}\) | |
| \(A_n\) | \(N_{n1}\) | \(N_{nj}\) | \(N_{nn}\) | |
The calculation formula of the overall prediction accuracy is as Eq. (2):
\[\label{e2} \text { Accuracy }=\frac{\sum\limits_{i=1}^n N_{i i}}{\sum\limits_{i=1}^n \sum_{j=1}^n N_{i j}},\tag{2}\] where, \({{N_{ii}}}\) represents the number of class \(i\) real values and class \(i\) predicted values, \({{N_{ij}}}\) represents the number of class \(i\) real values and class \(j\) predicted values.
This study summarizes 18 technical indicators (A1 to A18) with high frequency in the literature, as shown in Table 3. The objective variable of this study is O19 to predict the “up”, “flat” and “down” of stock price. This study uses the selection method of technical indicators and machine learning algorithm to find out the important technical indicators, and selects three listed companies as the research objects, namely, Dali light, TSMC and Hon Hai, whose stock price changes greatly, whose stock price changes more generally and whose stock price changes less. The data were collected from October 13, 2014 to June 5, 2017, with a total of 646 records, including 100 records from December 30, 2016 to June 5, 2017.
| A1. Opening spread (yuan) | A2.Maximumprice difference (yuan) | A3. Lowest price difference (yuan) | A4. 12 day relative strength index(RSI) |
| A5.5 daily average (MA) | A6.10 day average(MA) | A7.20 day average (MA) | A8.12 index(W%R) |
| A9.6-day departure rate(BIAS) | A10.12 day deviation rate(BIAS) | A11.6 psy | A12.9 fast random index(K) |
| A13. 9 day slow random index (D) | A14.9 convergence divergence index of daily moving average(MACD) | A15. Turnover(1000 shares) | A16.10 daily momentum index(MTM) |
| A17. A/D | A18. 10 day homeopathy index (CCI) | – | O19. Share price up and down |
This study first calculates the Pearson correlation coefficient between each technical index and the stock prices of the three companies, and selects the top 10 technical indexes with higher correlation coefficient to predict the stock prices, and gradually reduces them to 5 technical indexes. At the same time, the prediction accuracy of different companies in different machine learning algorithms under different number of indicators is calculated, and the results are shown in Table 4 to Table 6. According to the analysis results of dialoguing, TSMC and Hon Hai, SVM has the highest accuracy in predicting the rise and fall of stock price. When the number of technical indicators is gradually reduced to 5, the accuracy of using different machine learning algorithms to predict the rise and fall of stock prices of the three companies is more than 80%. ” The five important technical indexes selected by dialoguing are A12 (9-day fast random index), A4 (12 day relative strength index), A17 (trading power index A/D), A3 (lowest price difference) and A9 (6-day deviation rate) The five important technical indexes selected by TSMC are A12 (9-day fast random index), A3 (lowest price spread), A17 (trading power index A/D), A2 (highest price spread) and A4 (12 day relative strength index) The five important technical indicators selected by Hon Hai are A17 (trading power index A/D), A4 (12 day relative strength index), A13 (9 day slow random index), A3 (lowest price spread) and A2 (highest price spread). Therefore, this study focuses on the five important technical indicators selected by “daliguang”, “TSMC” and “Hon Hai” as the indicators of stock price rise and fall prediction, and develops the prediction system based on them.
| – | SVM | KNN | BPNN | DT |
|---|---|---|---|---|
| 10 | 88.45% | 85.45% | 85.71% | 85.45% |
| 9 | 87.64% | 84.55% | 84.79% | 84.54% |
| 8 | 87.18% | 83.18% | 84.79% | 84.54% |
| 7 | 86.64% | 82.45% | 84.43% | 83.63% |
| 6 | 86.36% | 81.64% | 83.63% | 82.45% |
| 5 | 84.36% | 80.00% | 83.51% | 81.81% |
| 4 | 76.36% | 75.45% | 78.89% | 76.36% |
| – | SVM | KNN | BPNN | DT |
|---|---|---|---|---|
| 10 | 88.18% | 82.72% | 85.32% | 84.54% |
| 9 | 86.36% | 82.72% | 84.79% | 83.63% |
| 8 | 85.45% | 81.81% | 83.48% | 82.72% |
| 7 | 85.45% | 80.90% | 83.48% | 82.72% |
| 6 | 84.54% | 80.90% | 81.35% | 80.90% |
| 5 | 84.54% | 80.00% | 81.35% | 80.90% |
| 4 | 77.72% | 73.63% | 77.83% | 74.54% |
| – | SVM | KNN | BPNN | DT |
|---|---|---|---|---|
| 10 | 88.77% | 84.69% | 87.15% | 84.54% |
| 9 | 86.34% | 82.65% | 84.40% | 82.72% |
| 8 | 84.69% | 82.65% | 83.51% | 82.72% |
| 7 | 83.67% | 81.63% | 83.51% | 81.81% |
| 6 | 82.65% | 80.90% | 82.23% | 81.81% |
| 5 | 81.81% | 80.00% | 81.68% | 80.27% |
| 4 | 74.48% | 72.44% | 77.83% | 75.45% |
This study is mainly through the selection of indicators, and the use of machine learning algorithm for forecasting performance analysis, in order to select important technical indicators,and then build a fuzzy inference system to predict the extent of stock price rise and fall and the range of rise and fall.
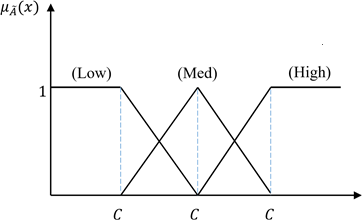
4.1. Inferential Prediction of Stock Price Rise and FallIn this study, six data russification methods are used to determine the center of membership function of semantic variables, which are quartile, mean plus minus one time of standard deviation (±). Average plus or minus 0.5 standard deviation (±5), average plus or minus 1.5 times standard deviation (±5), K-means and fuzzy C-means, and the data of important technical indicators are divided into three semantic variables, namely “low”, “medium” and “high”. And its membership function is shown in Figures 1, 2 and 3.
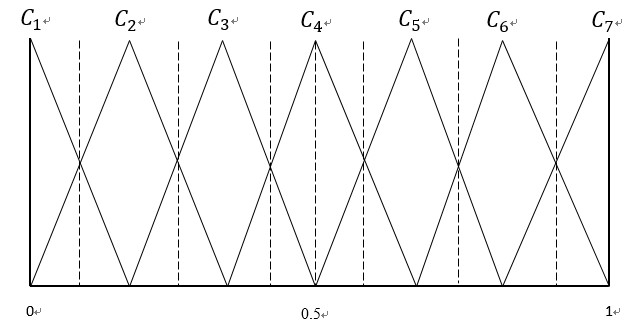
This study uses two different types of semantic variables to express the possibility of stock price rise, namely “five point semantic variables” and “seven point semantic variables”. The expressions are shown in Table 7.
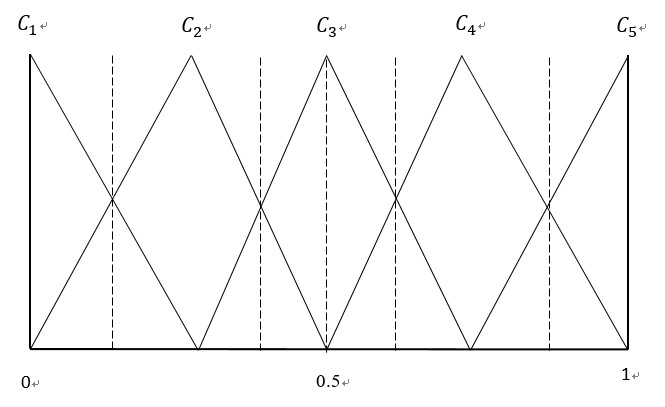
| Type | The possibility of stock price rising | Membership function |
| Five point | Extremely low(C1), low(C2), no rise, no fall(C3), high (C4), extremely high(C5) | Figure 2 |
| Seven point | Very low (C1), low (C2), slightly low (C3), no rise, no fall (C4), slightly high (C5), high (C6), extremely high(C7) | Figure 3 |
In this study, the number of semantic variables “low”, “medium” and “high” of technical indicators is used to establish the rule base. The five point and seven point semantic rule bases are defined as shown in Table 8 and Table 9.
| – | Low (number) | Mid (number) | High (number) | The possibility of output rising |
|---|---|---|---|---|
| Rule 1 | 0 | 0 | 5 | Extremely high |
| Rule 2 | 1 | 0 | 4 | Extremely high |
| Rule 3 | 0 | 1 | 4 | Extremely high |
| Rule 4 | 2 | 0 | 3 | High |
| Rule 5 | 1 | 1 | 3 | High |
| Rule 6 | 2 | 1 | 2 | No rise, no fall |
| Rule 7 | 0 | 4 | 1 | No rise, no fall |
| Rule 8 | 1 | 2 | 2 | No rise, no fall |
| Rule 9 | 0 | 5 | 0 | No rise, no fall |
| Rule 10 | 1 | 4 | 0 | Low |
| Rule 11 | 2 | 3 | 0 | Low |
| Rule 12 | 3 | 2 | 0 | Very low |
| Rule 13 | 4 | 1 | 0 | Very low |
| Rule 14 | 5 | 0 | 0 | Very low |
| – | Low (number) | Mid (number) | High (number) | The possibility of output rising |
|---|---|---|---|---|
| Rule 1 | 0 | 0 | 5 | Extremely high |
| Rule 2 | 1 | 0 | 4 | Extremely high |
| Rule 3 | 0 | 1 | 4 | Extremely high |
| Rule 4 | 2 | 0 | 3 | High |
| Rule 5 | 1 | 1 | 3 | High |
| Rule 6 | 0 | 3 | 2 | No rise, no fall |
| Rule 7 | 2 | 1 | 2 | No rise, no fall |
| Rule 8 | 0 | 4 | 1 | No rise, no fall |
| Rule 9 | 0 | 5 | 0 | No rise, no fall |
| Rule 10 | 1 | 4 | 0 | Low |
| Rule 11 | 2 | 3 | 0 | Low |
| Rule 12 | 3 | 2 | 0 | Very low |
| Rule 13 | 4 | 1 | 0 | Very low |
| Rule 14 | 5 | 0 | 0 | Very low |
In this study, the min max method is used for rule integration and inference calculation, and the discrete barycenter method is used to demystify the membership function of inference results. If the value of solution russification is greater than 0.5, the stock price is predicted to rise or fall. On the contrary, it is predicted that the state of stock price rise and fall is “fall”.
4.2. Steps of Forecasting SystemThe operation steps of the fuzzy inference prediction system proposed in this study are as follows:
selecting the company’s stock system will display the description of the company’s important technical indicators.
Select the russification method and the semantic variable of the output result.
The center point of membership function of each technical index is displayed, and the important technical index values are input for fuzzy inference analysis.
The membership value is displayed, and the fuzzy rules are generated and defuzzified.
The results of different semantic variables are provided by de russification, and the value of up and down possibility is provided.
This paper makes an empirical analysis on the stock price data of three companies, namely, dialoguing, TSMC and Hon Hai. Data were collected from October 13, 2014 to June 5, 2017, with a total of 646 cases. At the same time, 80 of them were randomly selected from 2016/12/30 to 2017/06/05 as the prediction data.
5.1. Analysis ProcessIn this study, six data russification methods are used to define the central point of the membership function of the important technical indicators, and two semantic variables are used to output the possibility of rising to make fuzzy inference, and the accuracy of stock price rise and fall prediction is calculated by solving the fuzzy value. Secondly, we use the solution of fuzzy value to predict the range of stock prices.
5.2. Data Analysis ResultsThis paper uses six fuzzy methods and 12 different combinations of semantic variables of two output results to make fuzzy inference. Based on the stock data of “dialoguing”, “TSMC” and “Hon Hai” (2016/12/30 to 2017/06/05), 80 of them are randomly selected to make 10 predictions and calculate the average accuracy. The results are shown in Table 10 to Table 12. From this result, we can see that in the “average plus or minus 0.5 times of the standard deviation” (± the three companies have the highest prediction accuracy under the combination of fuzzy method and “seven semantic variables”. Therefore, this study used the “average plus or minus 0.5 times the standard deviation”(± 5 s) and the “seven semantic variables” of the possibility of rising. Ten data were randomly selected to forecast the range of rising and falling for 10 times. The average accuracy of the three companies was more than 83%, as shown in table 13.
| – | Quartile | Standard deviation(0.5 times) | Standard deviation(1 times) | Standard deviation(1.5 times) | K-mean | Fuzzy C-mean |
| Five semantic variables | 77.50% | 80.63% | 66.13% | 58.63% | 75.63% | 78.00% |
| Seven mood variables | 78.00% | 82.75% | 69.50% | 60.00% | 77.13% | 78.88% |
| – | Quartile | Standard deviation(0.5 times) | Standard deviation(1 times) | Standard deviation(1.5 times) | K-mean | Fuzzy C-mean |
| Five semantic variables | 72.13% | 77.50% | 64.88% | 48.00% | 71.38% | 76.38% |
| Seven mood variables | 82.88% | 85.38% | 68.88% | 53.00% | 80.63% | 84.63% |
| – | Quartile | Standard deviation(0.5 times) | Standard deviation(1 times) | Standard deviation(1.5 times) | K-mean | Fuzzy C-mean |
| Five semantic variables | 77.88% | 79.88% | 70.88% | 55.75% | 70.75% | 70.95% |
| Seven mood variables | 79.75% | 82.13% | 69.75% | 58.25% | 73.88% | 79.63% |
| Times | |||||||||||
| Company | 1 | 2 | 3 | 4 | 5 | 6 | 7 | 8 | 9 | 10 | average |
| Daliguang | 80% | 80% | 80% | 90% | 80% | 90% | 90% | 80% | 90% | 70% | 83% |
| TSMC | 80% | 90% | 90% | 90% | 80% | 90% | 90% | 80% | 90% | 70% | 85% |
| Hon Hai | 90% | 90% | 80% | 90% | 80% | 70% | 90% | 80% | 80% | 80% | 83% |
Through the analysis of 12 combinations of “data russification method” and “semantic variable of rising possibility output result”, it is found that the accuracy of stock price rise and fall prediction of the three companies is more than 82.13% when using the data russification method of “average plus minus 0.5 times standard deviation” and the rising possibility output result is “seven semantic variable”. In addition, the average accuracy of the prediction method for the range of stock price fluctuation is over 83%. Therefore, the fuzzy inference prediction system of stock price rise and fall and the prediction method of range of stock price rise and fall proposed in this study have practical value and contribution, and can effectively assist investors in stock price prediction and analysis.
In recent years, with the rapid development of artificial intelligence and information technology, the application of machine learning method to predict the stock price is one of the most important topics in the field of financial technology. Therefore, this study uses machine learning algorithm to gradually cut the number of technical indicators for three companies’ stocks, and carries out accuracy analysis to screen out important technical indicators. In addition, in order to consider the attribute of the data and the fuzziness of subjective judgment, this study develops a fuzzy inference prediction system based on the important technical indicators and using the fuzzy inference method to predict the rise and fall of the stock price. At the same time, this study also puts forward the prediction method of stock price range. In this study, six methods of data russification are used to divide each technical index into three semantic variable clusters, and two different semantic variables are used to express the results of inference output. Through empirical analysis, it is found that the prediction accuracy of “stock price rise and fall” and “range of rise and fall” proposed in this study is quite high and has a certain degree of stability. To sum up, the fuzzy inference prediction system constructed in this study uses fuzzy semantics to express the possibility of stock price rise and fall, which makes it easier for investors to understand and conform to the real situation. In addition, the prediction of the range of stock price rise and fall can accurately predict the range of stock price change, so as to provide investors with specific reference value. On the whole, the analysis method and fuzzy inference prediction system proposed in this study not only have theoretical basis, but also have practical reference value.
In the future, we can consider multiple companies or industries, and integrate non numerical index data, such as market reputation, news event perception, company operator image and so on, in order to predict the fluctuation of stock price and the range of fluctuation, so as to improve the accuracy of prediction. In addition, different machine learning algorithms, such as genetic algorithm, particle swarm optimization algorithm, ant algorithm, deep learning algorithm and so on, can be added, and the fuzzy inference system can be built into a real-time dynamic updating information system, so as to provide investors with real-time investment decision information and strengthen practical application.
The experimental data used to support the findings of this study are available from the corresponding author upon request.
Author declares no conflict of interest regarding this work.
This work was supported by the Network data management model based on Naïve Bayes classifier and deep neural networks in heterogeneous wireless networks(No. 2019L0915).