
As the foundation of machinery manufacturing industry, casting industry has always been an important, basic and irreplaceable industry in the national economy [1]. With the development of intelligent manufacturing technology, China’s foundry industry is gradually moving towards intelligent direction [2, 3]. However, there is still a significant gap between the automation level of the domestic casting industry in the field of casting post-processing and that of foreign countries. Enterprises are faced with problems such as unstable product quality, increasing environmental protection and safety requirements, and rising human costs [4, 5]. Therefore, how to develop high-quality, efficient, intelligent and environment-friendly casting post-processing equipment has become an urgent problem to be solved. A series of post-treatment procedures, such as sand cleaning, shot blasting and heat treatment, are required for the casting blank obtained after casting. At present, the transportation of castings between processes is mainly completed by manually operating the truss car, which not only has low production efficiency, but also has high labor costs.
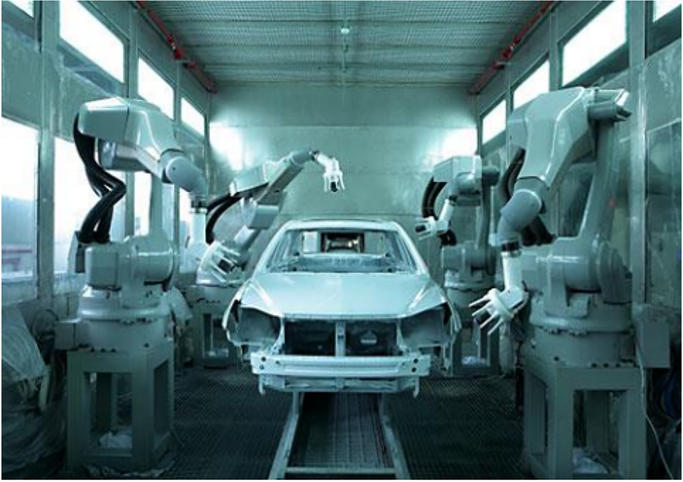
In recent years, loading and unloading robots have been more and more widely used in the post-processing production of castings. However, loading and unloading are mainly completed in the form of teaching, and the intelligent level is still not high [6, 7]. Visual servo technology enables industrial robots to have “eyes” by using visual sensors. By processing the images collected by visual sensors, the coordinate information of workpieces can be obtained. According to the real-time feedback of workpiece coordinate information, industrial robots can quickly and accurately identify and locate workpieces to be grasped independently, avoiding problems such as collision and extrusion caused by workpieces deviating from the teaching point during teaching grasping [8, 9] as shown in Figure 1.
Through the analysis of research at home and abroad, it can be found that after more than 50 years of development, the frame structure and overall control system of robot visual servo system have been relatively mature, and can achieve good control effects in most robot grasping tasks. In the task of grasping moving objects, the dynamic performance of robot visual servo system has higher requirements. At present, there are two key factors limiting the dynamic performance improvement of robot visual servo system: one is the system delay caused by the long image processing time of the visual system; The other is the problem of multi sampling rate, which is composed of low image sampling frequency of vision system and high sampling frequency of servo controller. In this paper, first of all, through the research of the moving object visual tracking algorithm. First, the fast positioning method of workpieces in complex background is studied, and then the visual tracking algorithm based on unscented Kalman filter is used to achieve target tracking according to the positioning results. Aiming at the problems of delay and multiple sampling rates in the visual tracking algorithm, an improved adaptive two rate unscented Kalman filter visual tracking algorithm is proposed, and the real-time performance and stability of the proposed algorithm are verified through comparative experiments [10, 11].
As the basis of visual tracking and visual servo control, feature selection is an important research content. It refers to selecting some features from the existing features. Although we all hope that the simpler the problem, the better, feature selection has been proved to be a NP complex problem. The reason why feature selection is very challenging is that a single feature cannot show relevance independently of other features [12]. Only two, three or more features can show relevance. This leads to a feature that may seem unimportant. After it is added to a feature subset, it may significantly improve the classification results. Secondly, some features among the interrelated features are redundant, so we need to reduce the redundant features to reduce the complexity of classification. However, as mentioned above, the reduction of redundant features will also encounter many possible problems among multiple features. Moreover, it seems that the dimensions that are not highly correlated do not mean that there is no complementarity between them. In this paper, we use the generation countermeasure network combined with feature selection to generate false data, adjust the proportion of the original data, in order to better use the classifier to find a few classes in the unbalanced data set [13, 14].
Heuristic algorithm is an algorithm inspired by nature, social behavior or biological group behavior. Many researchers have proposed different calculation methods to find the best solution to the problem by imitating the foraging behavior of species. When applied to feature selection, the heuristic algorithm is reversible for feature selection or deletion, so it can search the huge feature subset space more efficiently. Genetic algorithm is almost the first heuristic algorithm applied to feature selection. It uses the gene of genetic algorithm to express all features, and uses the exchange and mutation operators of genetic algorithm to change whether features are selected. In feature selection, each gene expression of GA usually regards a dimension as a bit, and the dimension of an example is equal to the total number of features in the dataset. In a binary GA, each bit is represented by a binary, 1 is selected, 0 is not selected, and in a continuous GA, each bit is represented by a continuous number. The genetic algorithm also uses the traditional feature selection method to improve the performance. [10] add to the mutation operation of GA, and use SFFS to enhance the selected feature set in chromosomes. The proposed algorithm can effectively improve the effect of feature selection, but the introduction of SFFS brings a large computational burden. In terms of gene expression, [11] proposed a binary expression method, which includes two pieces of content. The first piece is the number of features of the selected optimal feature subset, the second piece is n feature subsets, and each subset is also binary coded as an integer. A hybrid algorithm called SAGA is proposed in [12], which combines simulated annealing algorithm, GA, generalized regression neural network and greedy search algorithm. SAGA combines the advantages that SA is not easy to fall into local optimum, the ability of fast convergence brought by GA’s cross operation, the strong local search ability of greedy search algorithm and the strong computing ability of generalized regression network. The results show that SAGA has good global search ability and fast convergence for feature selection, and the time consumption of the algorithm is not increased too much because the filtering method is not used.
When the motion of the target object is not constrained, the motion track of the target cannot be obtained in advance, and the traditional control method of teaching industrial robot is no longer applicable. In view of this situation, scholars combined machine vision technology with robot servo control technology and proposed the concept of visual servo [13]. Since then, the research on robot visual servo control has been more and more extensive[14].
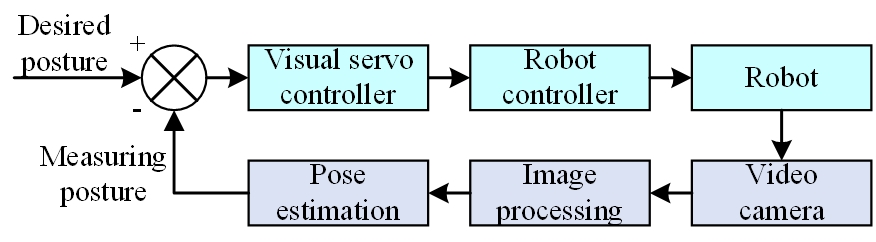
The basic structure of PBVS is shown in Figure 2. The servo system first needs to determine the corresponding relationship between image coordinates and robot pose through camera calibration. During the servo process, the controller obtains the control command by comparing the current position and the desired position and attitude, so as to control the motion of the robot [15]. The advantage of this kind of visual servo is that it separates the visual processing from the robot control, which is convenient for research. At the same time, it can directly use mature control methods to control the robot. However, PBVS also has its own limitations. First of all, the accuracy of the pose information obtained from the image information directly affects the accuracy of the visual servo control. Secondly, there is a large delay in the control system due to the need for real-time image processing. To solve these problems, [16] proposed to use particle filter to track the target, reducing the impact of camera calibration and image noise on visual servo control accuracy. A dual rate fading Kalman filter algorithm is proposed to compensate the visual information delay, which realizes the precise timing coordination between the encoder and the visual feedback [17].
For the data set with high data dimension and imbalance, we cannot directly apply the ordinary algorithm to the above data set due to the defects of the ordinary algorithm. In this paper, we use neural networks to process unbalanced data. The deep neural network will have more layers, generally with two or more hidden layers. Each hidden layer contains a large number of neurons. In addition to having a more complex structure than shallow neural networks, deep neural networks also have more complex optimization algorithms. In this paper, we use the powerful simulation ability of WGAN generator to simulate the data consistent with the real data distribution, so as to increase the number of positive samples, so as to improve the proportion of positive samples in the data and make the classification effect of the classifier better. But real data usually has the problem of large data volume and low information density, which leads to that most dimensions in the data are useless for machine learning, and may even hinder the experiment. In the face of unbalanced and high-dimensional data sets, we need to note that it is difficult for unbalanced and high-dimensional data to generalize the data distribution of a small number of classes in the sample in the limited sample space, and such induction is likely to cause the problem of over fitting in subsequent experiments. Therefore, before using WGAN to generate data for minority samples, we need to select features for minority samples to select feature subsets that are favorable for data generation and subsequent classification. While avoiding the problem of data over fitting, it also reduces the possibility of dimension disaster in the classification process through feature selection [18].
The heuristic algorithm has strong expression ability and strong search ability in feature selection. Therefore, we hope to use the heuristic algorithm to select features from the original dataset and select the most appropriate feature subset for subsequent data fitting and classification. We propose Wasserstein generation countermeasure network based on heuristic algorithm feature selection (hereinafter referred to as WGAN-EFS). In an unbalanced dataset, a few classes have a limited amount of information, which makes it difficult to confirm the distribution of minority data and find the rules in the distribution. When using ordinary classifiers to classify unbalanced data sets, if the classification indicator is classification accuracy, we will find that the accuracy of ordinary classifiers is still very high, because negative samples account for the majority. When negative samples are classified, the overall accuracy is very high, but we do not recognize the very critical data that accounts for the minority [19].
For WGAN, which has two mutually antagonistic networks, the number of hidden layers of each network and the size of each hidden layer are different. During training, it is necessary to determine the structure of one network before adjusting the structure of the other network. Then, according to the experimental results, the newly adjusted network is fixed for the adjustment of another network structure. This is not only time-consuming, but also a method that is difficult to find the optimal solution. This also makes the structure of WGAN more difficult to optimize. In view of the strong expression ability and search ability of the heuristic algorithm, we use the heuristic algorithm to optimize the structure of WGAN. First, code the hidden layers of WGAN. The number of each hidden layer corresponds to a positive integer. The total number of hidden layers is the total number of all hidden layers. The value range of \({n_h}\) is set as:
\[\label{e1}\tag{1} {\log _2}{n_I} \leqslant {n_h} \leqslant {n_I} – 1.\]
We use EBO to optimize the structure of generator and discriminator in WGAN. Because the results of each feature selection are different, and the results of feature selection will affect the output size of the generator and the input size of the discriminator, the results of a feature selection need to correspond to a WGAN structure.
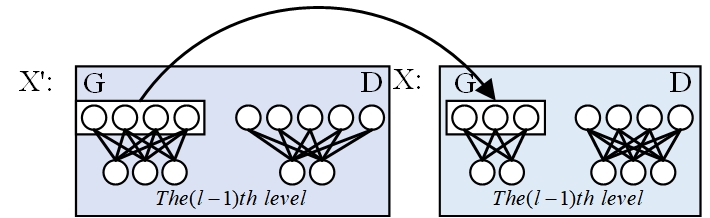
Figure 3 shows the migration process of the network structure. When we train the first hidden layer of the generator, a solution x contains the structure of a generator and discriminator, and the hidden layer of each network is displayed. Each hidden layer contains many components, and each component represents a neuron of the layer and the connection weight between the neuron and the neuron of layer (l-1). Suppose that the first layer of the generator of solution x ’is selected and migrated out, and the first layer of the generator of solution x is the migration target. The first layer of the generator of solution x will be replaced by the first layer of the generator of solution x’ to generate Wanfang data. After each migration operation, the size of each hidden layer will change, and the corresponding weight and deviation of the hidden layer will be redefined accordingly. After we have trained the network structure, we will use the gradient descent algorithm to retrain the weights and deviations [20].
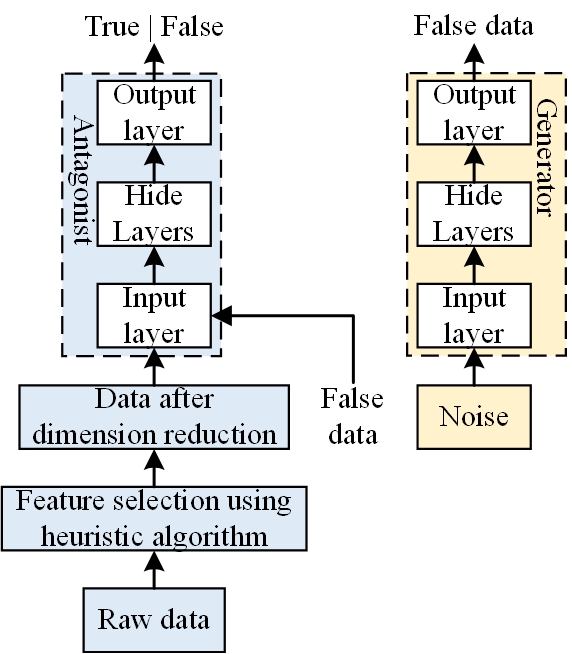
When the iteration reaches the maximum stop condition we set, stop the iteration. The last step of feature selection is the verification of subsets. According to the size of the input layer of the two networks, the upper and lower limits of each hidden layer are re determined, and a heuristic algorithm is used to adjust the structure of the generated countermeasure network. The WGAN with the determined structure will use gradient descent method to train the weight and deviation, and obtain the pre training results. According to the results of pre training, repeat the above process until the stop conditions are met. In this algorithm, we will use EBO twice [21]. The first time is to use EBO to optimize feature selection, and operate each dimension of feature selection according to the EBO process. The results obtained are used to determine the data for the next test. The second time, EBO is used to optimize the structure of WGAN, and the input size of discriminator and the output size of generator are re determined using the results of feature selection. Then, each hidden layer of the two networks in WGAN is operated according to the flow of EBO as shown in Figure 4.
For the dynamic grasping control of the robot, the position based robot visual servo (PBVS) control method is adopted. Its overall control structure is shown in Figure 5. The whole control process is divided into two parts: trajectory tracking and interception grasping.
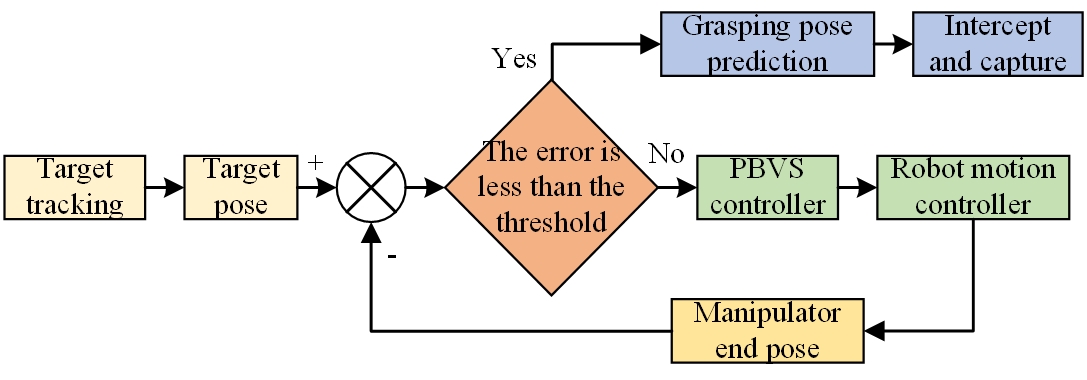
When the visual tracking system recognizes that the target has entered the field of vision, the dynamic grasping control system starts to control the robot to track the moving track of the target and gradually approach the target. At the same time, the robot controller feeds back the end pose of the robot at the current time. The input error of the PBVS controller is the difference between the target pose and the current end pose of the robot [22]. The expression of the error is:
\[\label{e2}\tag{2} e = P_{obj}^W – {P_e},\] where, \({P_e}\) represents the current end pose of the robot. The output of the PBVS controller is the terminal speed of the robot, including linear speed and angular speed. Its expression is:
\[\label{e3}\tag{3} V_e=\left[\begin{array}{l} V \\ \omega \end{array}\right].\]
Wherein, \(V\) represents the linear velocity of the end of the robot, and the robot can track the target position by controlling the linear velocity. represents the angular velocity at the end of the robot, and the robot can track the target attitude by controlling the angular velocity. When solving practical engineering problems, we often encounter the situation that the system information can not be obtained completely, which leads to many control methods can not be used normally [23].
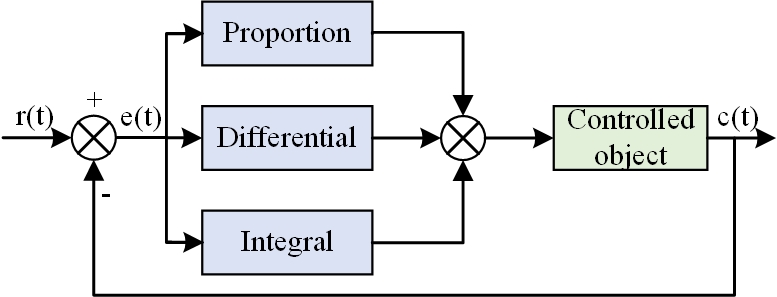
The system structure of PID controller is shown in Figure 6. The PID controller takes the difference between the output \(c(t)\) and the input \(r(t)\) as the system error, and uses the proportion, integral and differential to adjust the system error, so that the system error converges to zero.
The delay of image information feedback is mainly composed of the imaging time of the camera sensor, the data transmission time of the image from the camera to the image processing unit, and the image processing time. For a CCD camera, the camera manufacturer’s highest frame rate generally refers to the reciprocal of the camera’s shortest imaging and transmission time. For a camera with a maximum output frequency of 15fps [24], it can be considered that the camera’s imaging and transmission time is about 66ms. The time consumed for image processing will vary according to the image resolution and image processing algorithm. In the vision system established in this paper, the image resolution is \(2456*2058\). The sampling period of the visual servo controller is about 10ms. The time sequence of the visual servo control system is shown in Figure 7.
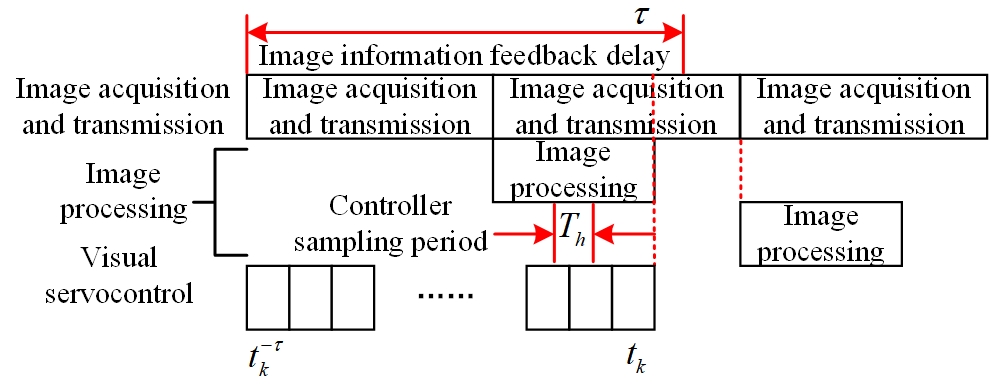
It can be seen from Figure 7 that the time when the visual servo controller receives the feature information fed back by the \(k\) frame image is \({t_k}\), and the information reflected by this frame image is actually the position of the target at \(t_k^{ – \tau }\). There is a time delay of \(\tau\) between them. Therefore, the target information received by the controller cannot fully reflect the target state of the real system, which seriously affects the real-time performance of the system. At the same time, it can also be seen that the time required for image information feedback is much longer than the sampling period of the controller. Set \(\tau = L{T_h}\), which means that in one feedback period of the visual system, there is only one effective command among the \(L\) control commands sent to the robot by the visual servo controller, and the rest of the commands will be the same as the last control command due to the lack of receiving a new target pose, resulting in the robot can not move smoothly.
In order to solve the above problems, a dual rate unscented Kalman filter algorithm is proposed to estimate the real-time position and orientation of the target, so as to achieve target tracking. The algorithm flow is shown in Figure 8. At this time, considering the delay of the image feedback information, adjust the steps of the traditional Kalman filtering algorithm, first correct according to the state estimation at the previous time, and then predict the estimation of the target at the current time through the corrected state estimation value. Then, single step prediction is performed at a high sampling rate before the next image feedback information arrives.
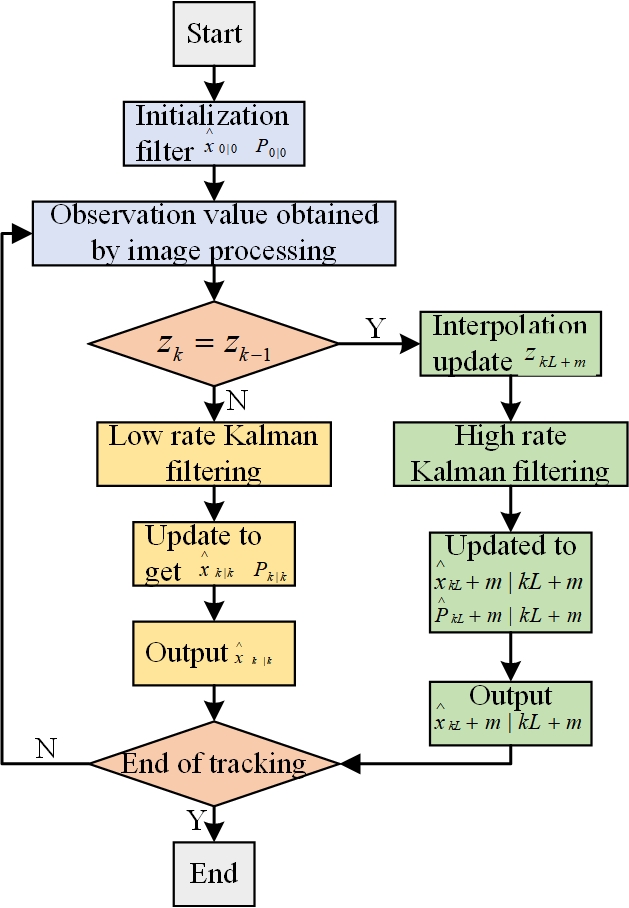
Due to the frequency mismatch between the visual sensor and the controller, the filter is designed with double rate, corresponding to the high sampling rate of the controller and the low sampling rate of the visual sensor respectively. If the high rate sampling frequency is \(L\) times of the low rate sampling frequency, the low rate data is available every \(L\) sampling steps. The state space model of the low rate filtering is:
\[\label{e4}\tag{4} \left\{\begin{array}{l} x_{k+1}=A_l x_k+\gamma_k, \\ z_k=H\left(x_k\right)+v_k. \end{array}\right.\]
The expression of the state matrix is:
\[\label{e5}\tag{5} A=\left[\begin{array}{llll} a_l & 0 & \ldots & 0 \\ 0 & a_l & \ldots & 0 \\ 0 & 0 & \ldots & 0 \\ 0 & 0 & \ldots & a_l \end{array}\right], \quad a_l=\left[\begin{array}{lll} 1 & \tau & \frac{1}{2} \tau^2 \\ 0 & 1 & \tau \\ 0 & 0 & 1 \end{array}\right].\]
Considering the delay of the image feedback information, adjust the steps of the traditional Kalman filtering algorithm. After receiving the image feedback information, obtain the state estimation value according to the last iteration.
There are three datasets used in the experiment, namely SCADI, Arrythmia and Micromass. The tested datasets are from the UCI Repository. We use positive samples to train WGAN, and select features for negative samples according to the feature subset after training. In the data we selected, positive samples account for about 10% of the total samples. In order to change the proportion of various types in unbalanced data, WGAN will generate a false positive sample set with the same size as the current positive samples. During classification, we mix all real data (including positive samples and negative samples) with false data to change the proportion between positive samples and negative samples. We use five equal cross validation. Each time we use four mixed data to train the discriminator, and then we use the original data to test the discriminator’s resolution. In order to judge the optimization result of WGAN network, we judge according to the Wasserstein distance between the real distribution and the generated distribution. To be fair, all algorithms set a maximum number of iterations as the stop condition. The population size of each algorithm is the same. Each algorithm runs 20 times, and the results take the average of 20 tests. The comparison standard of the algorithm is to compare the mean value of the algorithm after optimization and classification at the beginning, and compare the robustness of the algorithm if the mean value is the same.
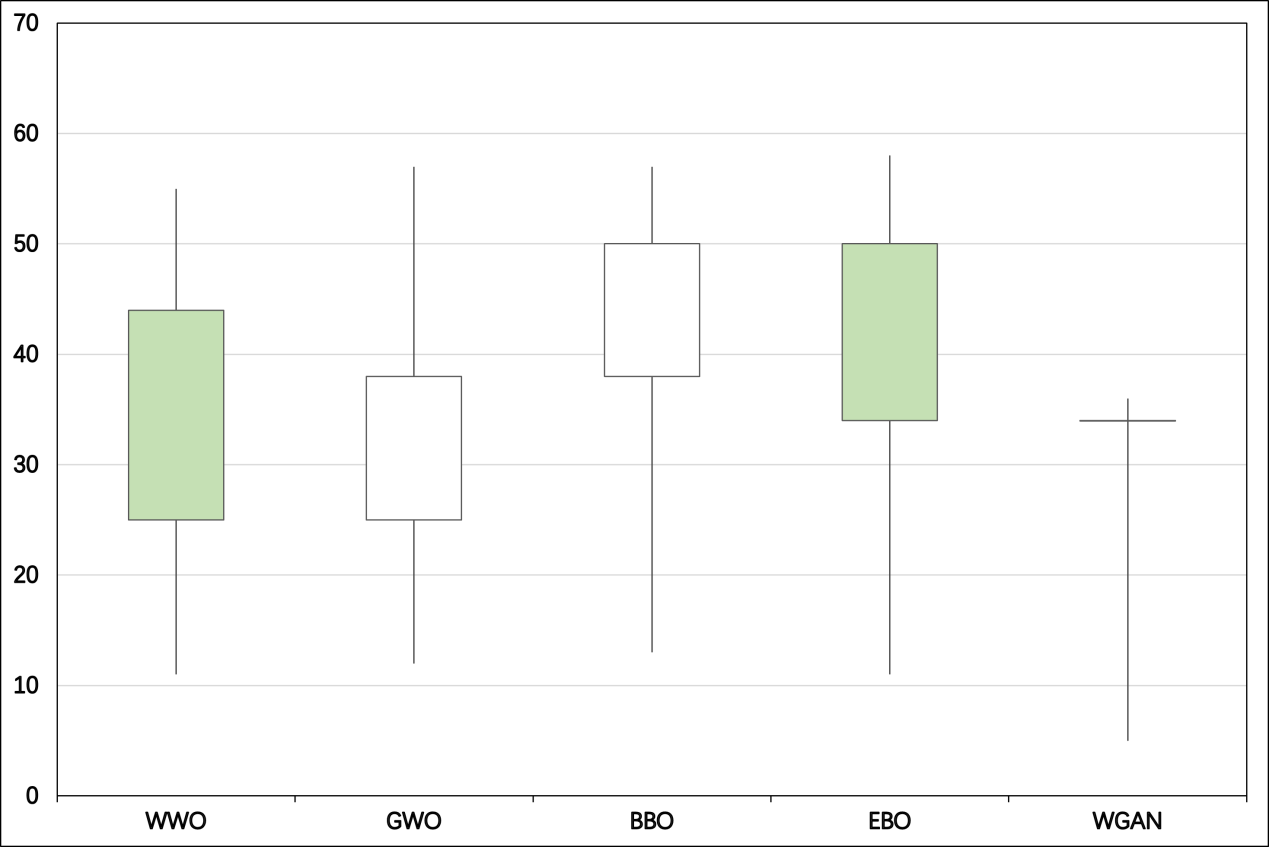
Figure 9 is the comparison of fitness obtained after WGAN structure optimization, in which the histogram represents the average fitness, the upper end of the error bar is the maximum fitness, and the lower end is the minimum fitness. As shown in Table 1, in the Arrythmia dataset, EBO has achieved the best results in the average fitness estimation, which is significantly improved compared with WWO, GWO, BBO and WGAN. In Micromass, WWO has the best average fitness and minimum fitness compared with the other four algorithms, but the results of EBO and WWO are not very different. Compared with the other three algorithms, EBO also has a great improvement. In SCADI, BBO has the best average fitness and minimum fitness compared with other algorithms, and EBO is in the second place. However, the difference between the optimization results of EBO and BBO is not very big, and EBO has a great improvement compared with the other three algorithms. In these three data sets, the standard deviation of EBO is the smallest, which indicates that the robustness of using EBO to optimize WGAN is the strongest. By comparing the optimization results of EBO and WGAN, it can be seen that when the heuristic algorithm is not used to optimize WGAN, the result of WGAN will fluctuate greatly and the standard deviation will also be large. When the heuristic algorithm is added, not only the average fitness of the network will improve rapidly, but also the standard deviation of the fitness will be small, which indicates that the heuristic algorithm can effectively optimize the structure of WGAN. Although EBO may not always achieve the best results in optimization, its performance is the most stable. Even if the effect is not the best, its experimental results can rank second. Compared with other algorithms, the performance of EBO is very stable. Therefore, we believe that EBO has the best optimization effect on WGAN structure.
| Data set | Fitness | WWO | GWO | BBO | EBO | WGAN |
|---|---|---|---|---|---|---|
| Arrhythmia | Max | -13.488 | -13.037 | -14.503 | -15.974 | 8.566 |
| Average | -5.727 | -17.105 | -17.336 | -17.598 | 0.135 | |
| Min | -19.39 | -19.815 | -20.377 | -19.122 | -13.257 | |
| Std | 1.838 | 1.966 | 1.546 | 1.076 | 6.925 | |
| Micromass | Max | 21.477 | -19.204 | -19.435 | -21.176 | 18.334 |
| Average | -24.605 | -23.322 | -23.921 | -23.956 | 1.715 | |
| Min | -28.913 | -25.255 | -28.670 | -28612 | -32.115 | |
| Std | 2.720 | 2.084 | 3.090 | 2.025 | 14.444 | |
| SCADI | Max | -12.926 | -11.803 | -14.104 | -14.412 | 20.163 |
| Average | -15.227 | -14.333 | -16.435 | -16.057 | -1.959 | |
| Min | -18.966 | -16.744 | -21660 | -18.382 | -14.274 | |
| Std | 1.626 | 1.720 | 2.123 | 1.165 | 9.977 |
Firstly, the slope response experiment is carried out. In the slope response experiment, the moving curve of the target is a straight line with a fixed slope, indicating that the target is moving at a constant speed. Simulate that the target moves along the direction at a speed of under ideal conditions, use the control framework and visual servo controller designed in this paper to send motion control commands to the robot at a frequency of 100, and draw the real-time position curve and error change curve of the robot end under slope response, as shown in Figure 10 and 11.
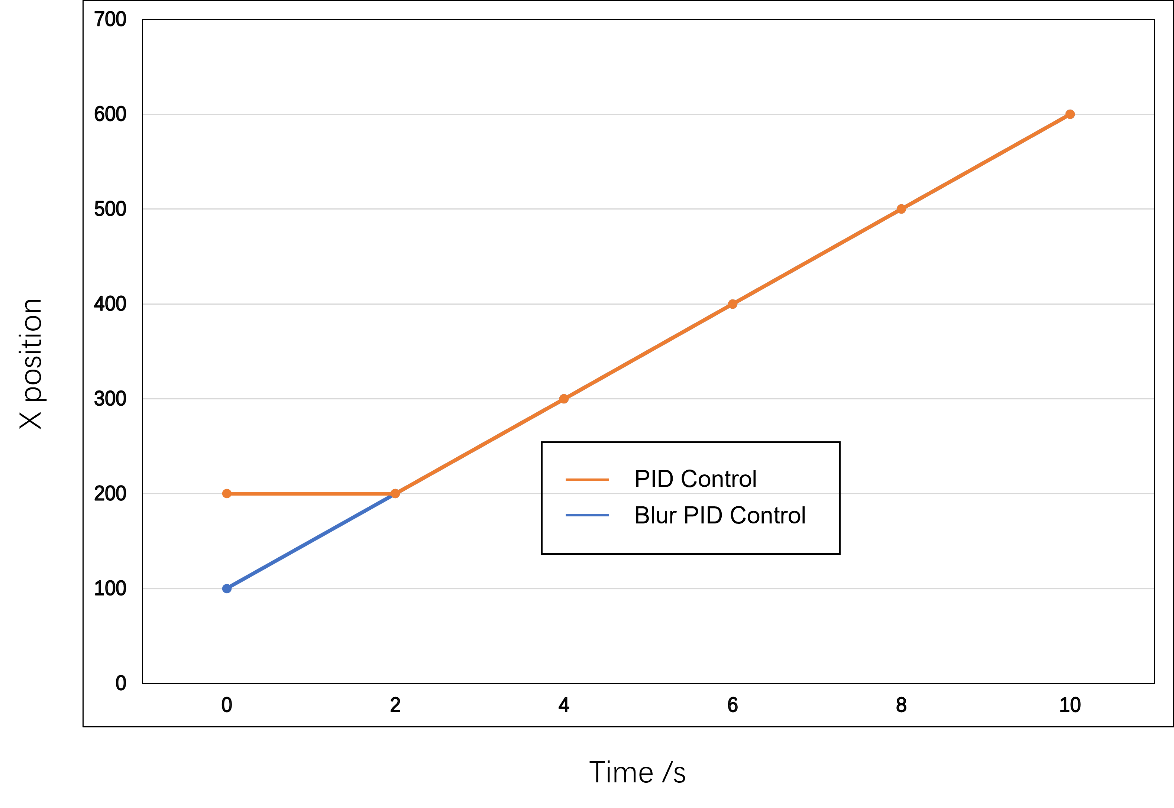
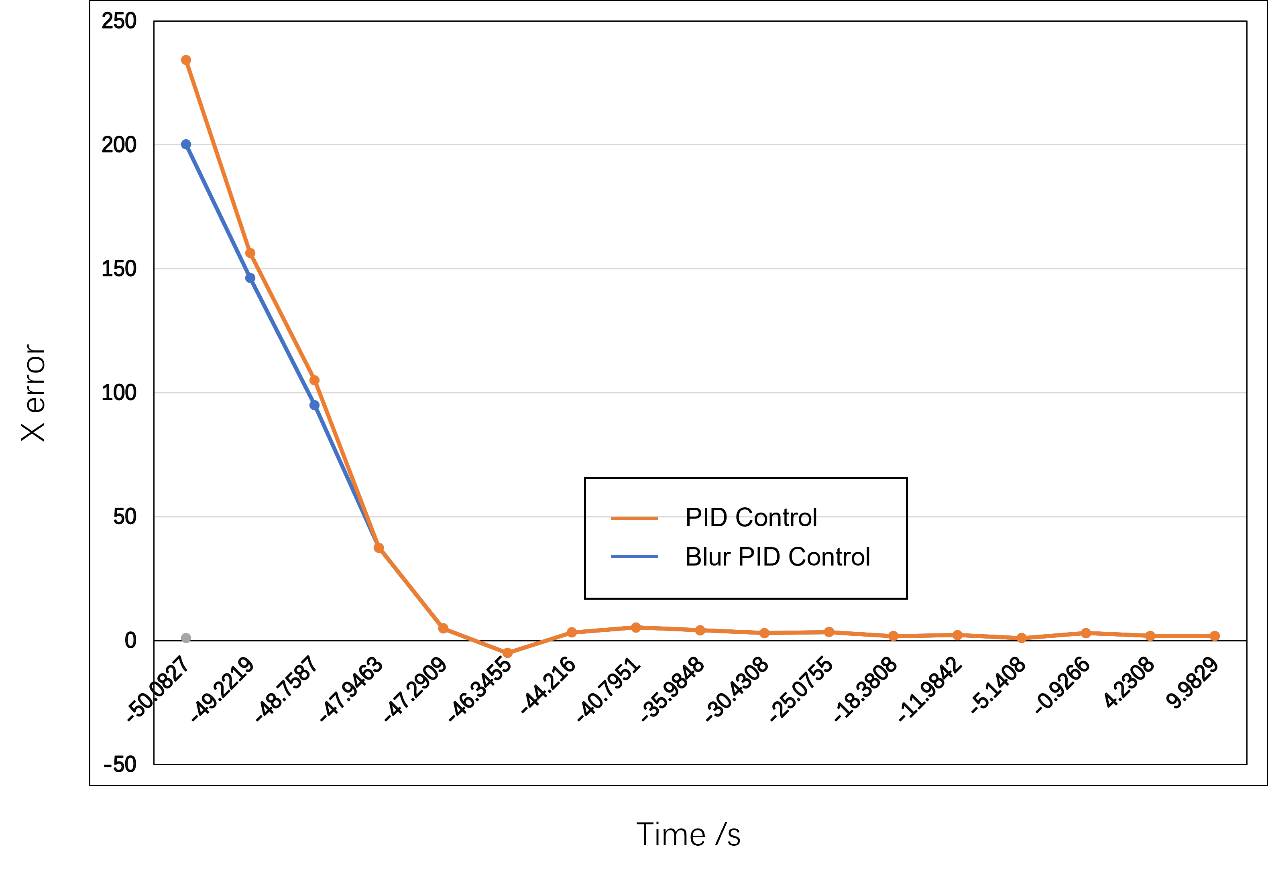
It can be seen from Figure 10 and 11 that, in the case of slope response, the PID controller can obtain basically the same response time as the fuzzy PID controller when the control parameters are adjusted well, and the overshoot of the fuzzy PID controller is slightly smaller than that of the PID controller, indicating that the control effect of the fuzzy PID controller is slightly better than that of the PID controller in the case of slope response.
In order to verify the effectiveness of the improved adaptive dual rate unscented Kalman filter visual tracking algorithm (ADUKF), this paper will carry out several groups of experiments to verify the performance of the ADUKF algorithm by comparing the position and attitude tracking results of the ADUKF algorithm and the UKF algorithm. The CCD camera is used to continuously collect images, and the coordinates of the four corners of the tracking plane in the target coordinate system are in millimeters. The following two groups of experiments specifically illustrate the advantages of the ADUKF algorithm [8].
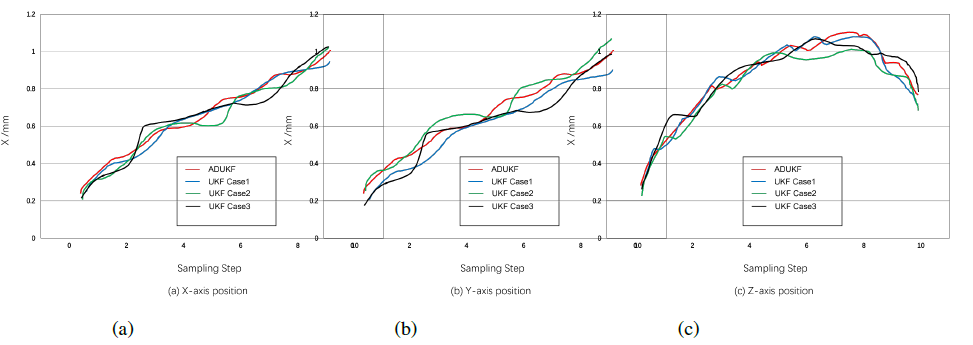
Set the initial value of the mean and covariance of the process noise in the AUKF algorithm, observe the initial value of the noise statistical characteristics, and conduct a visual tracking experiment. In actual production, the statistical characteristics of the observation noise are not easy to change. Set the mean and covariance of the observation noise in the UKF algorithm. The process noise is greatly affected by environmental factors, so given the different process noise covariance of the UKF algorithm, set the mean value of the process noise of the UKF algorithm to, and the covariance are respectively Case 1, Case 2, Case 3, and carry out visual tracking experiments.
The visual tracking results of the two algorithms are compared, and the experimental results are shown in Figure 12 and Table 2. From the experimental results, it can be seen that the pose tracking accuracy of UKF algorithm in Case1 is high, which indicates that the given process noise covariance matrix is closer to the actual value at this time, while in Case2 and Case3, the given process noise covariance matrix gradually deviates from the actual value, and the pose tracking accuracy gradually decreases. Therefore, the UKF algorithm is sensitive to the statistical characteristics of the system noise. When the set value deviates from the actual value, the filtering effect is poor. However, the ADUKF has high accuracy in position and attitude tracking, and it does not need to accurately set the system noise statistical characteristics.
| ADUKF | UKF Case1 | UKF Case2 | UKF Case3 | |
|---|---|---|---|---|
| \(X/mm\) | 0.2370 | 04237 | 1.0566 | 2.2732 |
| \(Y/mm\) | 0.3192 | 0.5896 | 1.8344 | 4.2887 |
| \(\theta /deg\) | 0.3690 | 0.3926 | 0.4121 | 0.6416 |
In this paper, we focus on the high-dimensional feature processing, moving object tracking and visual servo control in robot. First of all, this paper proposes a training method of generation countermeasure network based on heuristic algorithm, which improves the positive and negative proportion between unbalanced data through Wasserstein generation countermeasure network, and also uses heuristic algorithm to reduce the dimension of unbalanced data to extract the data that is beneficial to classification. In order to reduce the difficulty of deep neural network optimization, heuristic algorithm is used to optimize the structure of deep neural network. Then, we constructed a position based visual servo dynamic grasping control structure, designed a visual servo controller based on fuzzy PID control, and verified the performance of the controller to meet the actual needs through simulation experiments.
This study is supported by School level teaching reform project of Cangzhou Jiaotong College (Project Name: Reform and exploration of training mode for new engineering electrical majors based on virtual simulation and practice, Project No. CJ202302004); Hebei Province higher education teaching reform and research project (Project Name: Construction of ideological and political teaching target system and evaluation system of electrical professional courses under the background of new engineering, Project No. 2021GJJG639).
The authors declare no conflict of interests.