
In recent years, with the rapid development of technologies such as big data, the Internet of Things and cloud computing, digital technology has continued to improve and innovate. This wave of technology has not only changed our way of life, but also profoundly affected all aspects of the education field. In particular, the new idea of “combining artificial intelligence and multimedia technology with education management in higher education” brings new perspectives and possibilities for higher education.
Artificial intelligence technology can improve the efficiency and scientificity of higher education management, and significantly reduce the cost of teaching management [4,15]. With the arrival of the 5G era, the full coverage and high bandwidth of the wireless network can enable intelligent terminal devices to access the Internet quickly and conveniently, and colleges and universities can manage students and teachers accurately and serve them efficiently with the help of AI products [5,12,14]. All management situations of students can be scientifically presented in the form of data, which makes it easy for schools to improve their management methods based on objective data information, and improves the management efficiency of colleges and universities [6,2,3,17]. Teachers’ management work can also be accomplished with the help of artificial intelligence products, which largely reduces the work pressure of administrative staff in colleges and universities [8,11,13,22]. And multimedia technology using modern educational technology display methods, for modern higher education intuitive, dynamic, three-dimensional injected new vitality, has become one of the important aspects of higher education teaching management reform [9,21,7,10]. Multimedia technology has the advantage of being significantly better than other traditional educational management methods in improving the way of demonstrating knowledge, presenting the process of occurrence and development of things and the simulation display of situations, which has become an irreplaceable means of educational management in the practice of modern higher education [18,20,1].
We should actively explore and apply artificial intelligence and multimedia technology to inject new vitality and power into the educational management of higher education, to better meet the educational needs, to improve the quality of education, and to promote the sustainable development of higher education [16]. At the same time, we should also pay attention to the risks and opportunities faced by college education management in the context of the intelligent era, and look for innovative paths of college education management in the intelligent era to ensure that its application in the field of education can truly benefit human society [19].
In this paper, these two emerging technologies were subtly integrated into the traditional higher education management data analysis algorithm, which greatly improved the algorithm’s ability to collect data, process data, and analyze data and output results. A new type of higher education management data analysis algorithm model was constructed to further optimize university management and teaching efficiency. Only when teachers do not waste time on unnecessary trivial matters, would they have more time to deal with teaching-related matters and improve the ability of higher education to cultivate senior talents. The new higher education management data analysis algorithm realized the rapid processing of higher education management data and improved the accuracy of output results, and provided higher convenience for colleges and universities to cultivate talents.
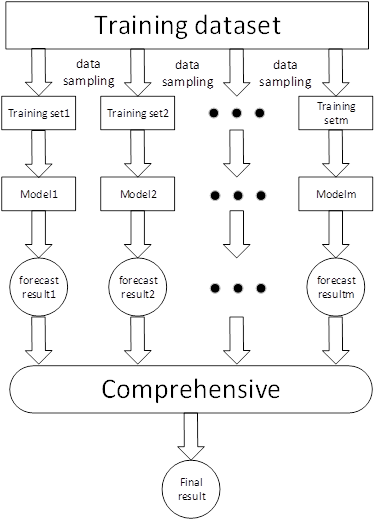
The principle of bagging is to put together many basic models and finally find their average. Bagging adopts the parallel form, which can quickly obtain the basic model. The advantage is that they do not interfere with each other and can be visualized. However, their disadvantages are also obvious: they may delay the overall calculation progress due to the slow speed of individual tree models.
The core idea of bagging is to operate some basic models in parallel, and finally calculate the average of the output results of these models. However, there are still some problems with this algorithm. If the input basic model is a weak model, then the output result is likely to be weak. The detailed operation process is shown in Figure 1.
The Boosting algorithm better solves the problem that the output probability of the Bagging algorithm is weak. Boosting continuously calculates the algorithm formula, and selects some stronger models to join the forest for operation together. Finally, all the operation results are added to get the final result.
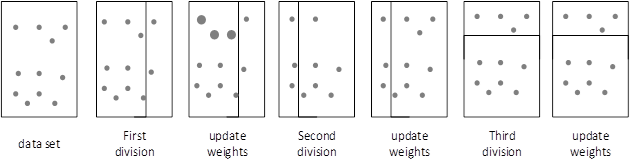
The Adaboost algorithm also establishes multiple basic models and then concatenates them one by one. The algorithm calculates the model sample score one by one, and then makes a simple judgment on the model sample score. If it is correct, it would reduce its weight and reduce the attention to the model. If it is wrong, its weight is increased and the attention of the model is increased. This continues until the final result is obtained, and the output of the algorithm is closer to reality. The Adaboost algorithm calculates and judges the weight of the basic model as shown in Figure 2.
All of the above algorithms can be applied to traditional higher education management data analysis algorithms, and can have a greater impact on the further optimization of the algorithm. This paper also uses the three algorithms in the integrated learning strategy and intelligent multimedia technology to optimize the traditional higher education management data analysis algorithm.
In recent years, most of the management data analysis algorithms in colleges and universities have more or less applied technologies such as information networks, but there are still many points that can be improved. For example, higher education schools can combine information management with basic school work and make full use of the huge data in schools to serve teachers and students, and so on.
The restructured higher education management data analysis algorithm would be able to optimize the three main work directions of higher education schools, such as network, teaching and management. At the same time, it provides more convenience for teachers, students and service personnel in the school combined with the existing network critical infrastructure in the school.
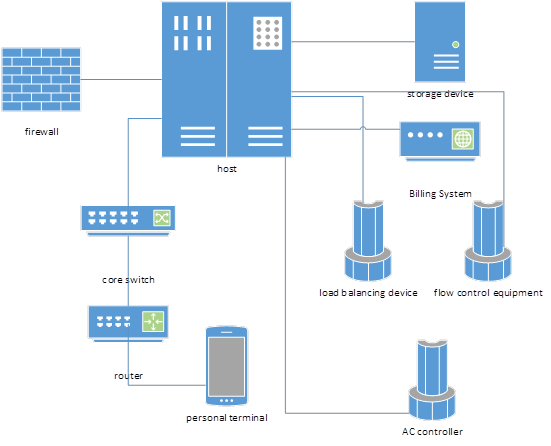
Today’s college campus network is a complex network that includes students’ personal terminal equipment, aggregation switches, AC controllers, core switches, load balancing equipment, traffic control equipment, billing systems, firewalls, storage devices and many other large-scale equipment. These devices store various log-in, access and data logs of everyone in the school, and these data are input into the higher education management data analysis algorithm, which can efficiently analyze the daily life of school staff and students, and can detect and deal with some abnormal problems in time, as shown in Figure 3.
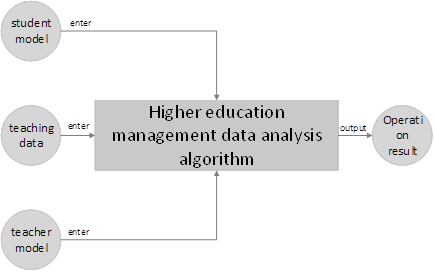
As the main responsibility of colleges and universities, teaching is of great significance to the analysis of teaching data. Traditional higher education management data analysis algorithms cannot process higher education teaching data. However, teaching is mainly based on teachers relying on their own teaching experience and feeling over the years, and there is no intuitive data that can let teachers know which knowledge point students have not mastered thoroughly enough. The reconstructed higher education management data analysis algorithm that combines artificial intelligence integrated learning strategies and intelligent multimedia technology can effectively collect the teaching data of each classroom in higher education. Based on these teaching data, each student is modeled separately, and then these models are analyzed and judged to visualize the relatively complete knowledge points and omissions that each student has mastered, which is convenient for colleges and universities to carry out teaching work more efficiently. The process is shown in Figure 4.
Although the main function of colleges and universities is to teach and educate people, as the first operating unit, colleges and universities also need to have “input” and “output” to carry out scientific research and other activities. The optimized algorithm can analyze the data of scientific research and management and other items of higher education projects, and judge the proportion of input and output of the project, which can save some time and money.
In order to optimize the traditional higher education management data analysis algorithm, this paper integrates artificial intelligence-derived integrated learning strategies and intelligent multimedia technology into the traditional higher education management data analysis algorithm. The main algorithms used in this optimization are three commonly used algorithms under the integrated learning strategy: Bagging algorithm, Boosting algorithm and Adaboost algorithm. First of all, the Bagging algorithm strengthens the ability of the original algorithm to calculate the average value. Its algorithm core Formula (1) is as follows: \[\label{GrindEQ__1_} f\left(x\right)=\frac{1}{M} \sum _{m=1}^{n}f_{m} \left(x\right) . \tag{1}\]
In the algorithm, the sample is randomly sampled, and then multiple basic models are calculated together, and finally the average value is calculated. In order to ensure the diversity of the target model and make the final result closer to reality, the algorithm introduces the method of double randomness for sampling.
The second is to use the Boosting algorithm to model strong data to calculate the average value. The core algorithm Formula (2) is as follows: \[\label{GrindEQ__2_} F_{n} \left(x\right)=F_{m-1} \left(x\right)+\arg \min _{n} \sum _{i=1}^{n}L\left(y_{i} ,F_{m-1} \left(x_{i} \right)+h\left(x_{i} \right)\right) . \tag{2}\]
Algorithm (2) is to take the whole of the previous round, including multiple tree models. When adding another model to this whole, the precondition of the Boosting algorithm needs to be satisfied – after the newly added model is calculated together with the whole of the previous round, the loss value of the whole model cannot decrease.
For example, if the true value of the data is 1000, the model of tree A is first estimated, and the value of the model is 980, as shown in Formula (3). \[\label{GrindEQ__3_} y_{\left(i\right)}^{\left(0\right)} =0 . \tag{3}\]
Then, the next step is to predict tree B. At this time, the goal of tree B is not to predict a possible value of the overall model, but to predict the unprocessed part of tree A, that is, the difference of 1000-980=20, as shown in Formula (4). \[\label{GrindEQ__4_} y_{\left(i\right)}^{\left(1\right)} =f_{1} \left(x_{i} \right)=y_{\left(i\right)}^{\left(0\right)} +f_{1} \left(x_{i} \right) . \tag{4}\]
Next, the tree A and the tree B are reorganized, and the overall tree model is predicted to obtain a difference, and the task of the tree C model is to predict the difference, as shown in Formula (5). \[\label{GrindEQ__5_} y_{\left(i\right)}^{\left(2\right)} =f_{1} \left(x_{i} \right)+f_{2} \left(x_{i} \right)=y_{\left(i\right)}^{\left(1\right)} +f_{2} \left(x_{i} \right) . \tag{5}\]
This calculation is continued until all tree models in the entire forest model are predicted, as shown in Formula (6). \[\label{GrindEQ__6_} y_{\left(i\right)}^{\left(t\right)} =\sum _{k=1}^{t}f_{k} \left(x_{i} \right) =y_{\left(i\right)}^{\left(t-1\right)} +f_{t} \left(x_{i} \right) . \tag{6}\]
Among them, \(y_{\left(i\right)}^{\left(t\right)}\) is the prediction result of the tree model in the t round; \(y_{\left(i\right)}^{\left(t-1\right)}\) is the prediction of the previous t-1 model; \(f_{t} \left(x_{i} \right)\) is the function of the newly added tree model. The above is the process of screening strong models and calculating tree models of the Boosting algorithm. The final result obtained by the algorithm is stronger than that of the Bagging algorithm.
The following is an introduction to the Adaboost algorithm with relatively balanced calculation results. First, the samples to be calculated are laid out. According to the various data indicators of the model, the calculation is performed on a 2\(\mathrm{\times}\)2 scale. \[\label{GrindEQ__7_} fig,\left(\left(ax1,ax2\right),\left(ax3,ax4\right)\right)=plt.subplots\left(nrows=2,ncols=2,figsize=\left(10,10\right)\right) . \tag{7}\]
First, the Formula (7) defines the overall calculated value. \[\label{GrindEQ__8_} fig.autofmt\_ xdate(rotation)=45 . \tag{8}\]
Formula (8) constrains the model tree. \[\label{GrindEQ__9_} RMSE=\sqrt{\frac{1}{n} \sum _{t=1}^{n}\left(observed_{t} -predicted_{t} \right)^{2} } . \tag{9}\]
Formula (9) evaluates the regression task of the model, and RMSE represents the equilibrium ratio of a certain attribute value of the model. \[\label{GrindEQ__10_} MSE=\frac{1}{n} \sum _{t=1}^{n}\left(observed_{t} -predicted_{t} \right)^{2} , \tag{10}\] where, \(MSE\) represents the minimum value of the model. Formula (10) roughly predicts the minimum value of the model. \[\label{GrindEQ__11_} MAPE=\sum _{t=1}^{n}\left|\frac{observed_{t} -predicted_{t} }{observed_{t} } \right| \times \frac{100^{2} }{n} , \tag{11}\] where, \(MAPE\) represents the maximum value of the model, and Formula (11) estimates the maximum value of the model. \[\label{GrindEQ__12_} D=\left\{\left(x_{1} ,y_{1} \right),\left(x_{2} ,y_{2} \right),\ldots ,\left(x_{m} ,y_{m} \right)\right\} , \tag{12}\] where, \(D\) is an overall training set, and the data input into the algorithm would be first judged whether it is full or not and stored in the training set \(D\).
First, the weight value distribution of the samples is initialized. \[\label{GrindEQ__13_} D_{1} \left(x\right)=\frac{1}{m} . \tag{13}\]
Next, \(h_{t}\) for classification is calculated from data set \(D\) according to distribution \(D_{t}\). \[\label{GrindEQ__14_} h_{t} =\varepsilon \left(D,D_{t} \right) . \tag{14}\]
Formula (14) estimates the error value of the model. \[\label{GrindEQ__15_} \in t=P_{\delta \sim D_{t} } \left(h_{t} \left(x\right)\ne f\left(x\right)\right) , \tag{15}\]
Formula (15) is mainly used by the algorithm to determine the weight of the classification. \[\label{GrindEQ__16_} H\left(x\right)=sign\left(\sum _{t=1}^{T}a_{t} h_{t} \left(x\right) \right) , \tag{16}\] where, \(H\left(x\right)\) is used as the output result, and the estimated value calculated by this part of the algorithm is output. \(a_{t}\) in Formula (16) is the normalization factor of this part of the algorithm to ensure a \(D_{t+1}\) distribution.
If\(D\left(x\right)\) represents the distribution of the current sample, \(h_{t}\) represents the current model, \(a\) represents its weight, and \(a_{t}\) is the normalization constant, this calculation can be understood as the calculation of adding the weights of misclassified samples. \[\label{GrindEQ__17_} a_{t} =2\sqrt{\varepsilon _{t} \left(1-\varepsilon _{t} \right)} . \tag{17}\]
The combination strategy in the algorithm is divided into two types, the average method and the weighted average method. The core formula of the average method is shown in the following Formula (18). \[\label{GrindEQ__18_} H\left(x\right)=\frac{1}{T} \sum _{i=1}^{T}h_{i} \left(x\right) . \tag{18}\]
The average method is mainly used to calculate and output numerical data. The core formula of the weighted average method is shown in the following Formula (19): \[\label{GrindEQ__19_} H\left(x\right)=\sum _{i=1}^{T}w_{i} h_{i} \left(x\right) . \tag{19}\]
Among them, \(w\) is the weight of the individual data learner. Generally speaking, when \(w\)\(\mathrm{>}\)0 and \(\sum _{i=1}^{T}w_{i} =1\), the error of the individual learner is estimated first, and then the weight is inversely proportional to the difference.
The model loss after the last few rounds is calculated using the following Formula (20). \[\label{GrindEQ__20_} a=\frac{1}{2} \times \ln \frac{1-e_{m} }{e_{m} } . \tag{20}\]
The intelligent multimedia technology is mainly responsible for the front end of the data processing part, such as the campus card personal information, the information of the educational administration system, the review of the campus forum content, the information collection of the campus face recognition system, etc. Intelligent multimedia technology can automatically identify, label and classify these data. It is input into the back-end in the higher education management data analysis algorithm for personal modeling, personal information calculation and other work. Because intelligent multimedia technology does not use specific formulas in the optimization of traditional higher education management data analysis algorithms, but only intelligently streamlines its code to make front-end information collection and page response more beautiful and efficient, the optimization process of the algorithm of intelligent multimedia technology would not be described in this part.
In order to test the improvement and optimization degree of the optimized higher education management data analysis algorithm compared with the traditional higher education management data analysis algorithm, this paper investigates the processing ability of various data in the university when some universities in the country use traditional higher education management data analysis algorithms, and also simulates the processing ability of these colleges and universities using the optimized higher education management data analysis algorithm to process the same data, and compares each item to make it easier to understand.
Although the two new technologies of artificial intelligence and multimedia technology sound unrelated, with the gradual deepening of research, it can be found that the application of artificial intelligence in multimedia technology has a very broad space. For example, the use of artificial intelligence technology to optimize the multimedia teaching software can make the multimedia teaching software more intelligent and improve its adaptability. The combination of artificial intelligence and multimedia technology to reconstruct the higher education management data analysis algorithm would also be a major direction for the progress of higher education management data analysis algorithms in the future.
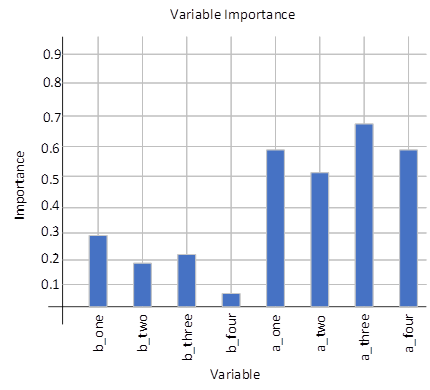
The first is to test the ability of the optimized algorithm to process the features of the input samples, and the results are made into a visual diagram, as shown in Figure 5.
The first five Variable attributes in the figure represent the ability of the traditional higher education management data analysis algorithm to analyze each feature of the sample, and the latter Variable attributes represent the optimized higher education management data analysis algorithm’s ability to analyze the various characteristics of the sample, which can be clearly seen from the figure that the analysis ability of the eigenvalues after the algorithm is optimized has improved by 11.4%.
Next, this paper inputs the same data to the traditional higher education management data analysis algorithm and the new higher education management data analysis algorithm, respectively, and compares the resulting data models and the number of features output by the two algorithms. The more data and features, the more powerful the algorithm is, as shown in Figure 6.
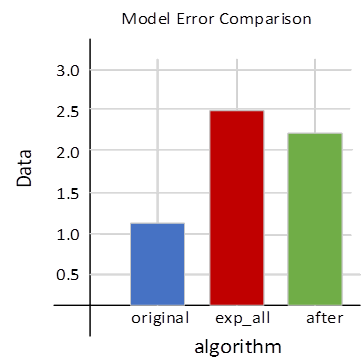
Where original represents the data output after the data is processed by the traditional higher education management data analysis algorithm, exp_all represents the input data volume, and after represents the data output after the optimized higher education management data analysis algorithm processes the data. It can be clearly seen from the figure that although the optimized algorithm still has loss in processing data, it has been greatly improved compared with the traditional higher education management data analysis algorithm.
It can be seen from the above two figures that integrating the algorithms derived from the integrated learning strategy into the traditional higher education management data analysis algorithm would greatly improve the data processing ability of the original algorithm, and the accuracy of the final output of the algorithm is greatly improved.
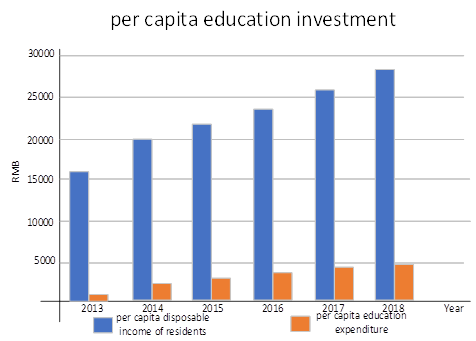
In recent years, with the continuous growth of residents’ income, people’s expenditure on education has also continued to increase. It can be foreseen that the education industry in the future would inevitably become more efficient and systematic, so it is necessary to optimize the traditional higher education management data analysis algorithm. For this reason, this paper also collects the per capita education investment of residents in recent years.
Figure 7 shows the per capita education expenditure of residents in recent years.
The three figures fully illustrate the superiority of the optimized higher education management data analysis algorithm compared to the traditional higher education management data analysis algorithm. The optimized data analysis algorithm of higher education management can save a lot of time and manpower for higher education, and help higher education to cultivate senior talents more systematically.
This paper studied the application of traditional higher education management data analysis algorithms in university management data processing, as well as the possibility of integrating artificial intelligence and multimedia technology into traditional higher education management data analysis algorithms. This paper also verified this possibility. Secondly, the performance of the traditional higher education management data analysis algorithm was collected and the actual ability of the optimized higher education management data analysis algorithm applied in university management was simulated, and the performance of the traditional algorithm was compared. Finally, this paper investigated various data of domestic and foreign colleges and universities and the per capita education investment in recent years, and verified the great prospect of higher education management analysis algorithms. With the continuous development of information technology in recent years, various industries are gradually entering the “information age”, and the requirements for talents are constantly increasing, which puts considerable pressure on higher education schools whose main responsibility is to cultivate talents. Higher education should actively seek changes to improve teaching quality is one aspect, and improving school management efficiency is also an important part that cannot be ignored. Today, with the increasing popularity of informatization, the optimization of higher education management data analysis algorithms has become an irresistible trend. The integration of artificial intelligence and multimedia technology into traditional higher education management data analysis algorithms also provided a new idea for higher education information departments.