
Strategic human resource management (SHRM) refers to management methods and theories that view human resources as part of an organization’s strategy and integrate them with the organization’s goals and development strategies to improve organizational performance and competitiveness [28,26].SHRM emphasizes the need for human resource management to be aligned with the organization’s long term strategic goals and support the organization’s achievement of its strategic goals through strategic human resource planning, human resource recruitment and selection, employee training and development, performance management, compensation and benefits management, and employee relationship management to support the organization to achieve its strategic goals [2,29,22,16]. The core idea of SHRM is to regard human resources as the most important asset of an enterprise, and to integrate human resource management into the decision-making process of the organization’s overall strategy in order to stimulate the potential and creativity of employees and improve their proactive behaviors, so as to improve work performance and the competitive advantage of the enterprise [27,31,1].
Proactive behavior, also known as proactive behavior, positive behavior or prospective behavior, is a positive performance characteristic of employees within the enterprise, emphasizing the spontaneity of employees’ behavior in the process of achieving individual goals and organizational goals. The active behavior of employees in the work process will affect the final work efficiency through their behavior and psychology, which has an important impact on improving organizational capabilities and tapping the potential of employees [23,8,19]. With the rapid changes in the organization’s external environment and the increase in competitive pressure, the establishment of the organization’s competitive advantage is not only dependent on the direct management and command of employees, but also more and more dependent on the initiative behavior of employees. For the organization, the proactive behavior of employees includes proactively predicting the organizational environment, proactively maintaining good relationships with customers, proactively seeking development opportunities and proactively solving potential problems in the organization [11,30,18,5].
The core concept of strategic human resource management (SHRM) is to regard human resources as one of the most important assets of an enterprise. While traditional human resource management focuses more on transactional work such as recruitment, training and performance evaluation of employees, strategic human resource management focuses more on integrating these employees with the strategic objectives of the enterprise, so as to maximize their roles in the process of realizing the enterprise’s objectives. Literature [4] emphasizes the importance of SHRM in business and management. It is pointed out that SHRM does not only focus on internal human resource issues only, but also focuses on human resource planning with long-term goals, and the implementation of SHRM is beneficial to improve the overall motivation and productivity of employees. Literature [9] proposes a context-centered analytical framework that contributes to a broader view of the HRM and performance relationship. And a SHRM system was constructed, which can provide organizational outcomes that balance financial and employee well-being outcomes and contribute to reshaping the operating environment of the firm. The study aims to contribute to the further development of the field of HRM and performance research. Literature [25] uses SHRM as a relationship between individual performance and firm performance with a view to developing HRM to SHRM through this relationship. It also provides an overview of SHRM practices, including human capital, performance management, and others, which can help improve individual performance and business performance. Literature [13] aims to examine the impact of SHRM elements on organizational excellence. Using industrial organizations as the study population, quantitative methods, questionnaires were used to collect information about the organizations and a random sample of managers from 120 organizations was conducted. The results pointed out that organizational managers valued training more than organizational development, career development, and recruitment evaluation, and that SHRM elements had a significant impact on organizational excellence elements. Literature [15] discusses a new perspective on SHRM contribution to value creation, aiming to construct a conceptual framework to integrate SHRM concepts with organizational values in order to determine the strength of HRM systems. It was also explored with the support of the literature review and many theories, and the results of the study showed that SHRM practices have an impact on organizations, societies and individuals, and have an important role in achieving sustainable development and social benefits.
Proactive behavior is a kind of positive behavioral characteristics of employees, with this behavioral characteristics of the employees in the work performance of constructive behavior, autonomous behavior and many other positive features, the sustainable development of employees and enterprises have an important role, so the proactive behavior of employees is very necessary. Literature [17] through the survey of leaders and their employees and based on the hypothesis and random coefficient model analysis concluded that the proactive personality and behavior of employees are influenced by the aspects of transformational leadership, innovative climate and flexibility. Literature [6] answered to what extent proactive personality moderates the relationship between job uncertainty and job stress based on reinforcement self theory. By collecting multi-source data from 420 employees and leaders in high-tech firms, the results of the study indicated that entrepreneurial leaders increase job certainty and contribute to proactive work behaviors of employees. Literature [14] describes the relationship between employees’ sense of organizational support, proactive personality and constructs. Based on the available information, a study was conducted on two companies and the results showed that the relationship between employees’ proactive personality and constructs is very significant and employees’ perception of organizational support also leads them to constructs. Literature [24] explored the impact of employees’ proactive behavior on innovation performance. An empirical study was conducted on 173 companies and hierarchical regression analysis was applied to validate the relationship between employee proactive behavior and innovation performance, and the results concluded that the relationship between proactive behavior and innovation performance was significantly positive. Literature [12] evaluated the proposed model by surveying 154 new employees in the apparel industry and evaluating the model with the help of structural equation modeling with SmartPLS. The results emphasized that employees’ proactive behaviors can have a significant impact on their well-being, engagement, and willingness to leave.
Based on structural equation modeling and convolutional neural network, this paper investigates the role of complex mechanisms of SHRM perception on employee initiative behavior. It first explores the path of SHRM perception on employee-initiated behavior based on structural equation modeling, proposes research hypotheses, designs a survey questionnaire, conducts reliability and validity tests on the questionnaire, and analyzes the overall path of action using multilayer linear regression, and then analyzes its mediating and moderating effects specifically to get the final results of hypothesis validation. Finally, convolutional neural network is used to analyze the significance of the influence of the respective variables on the dependent variable (employee-initiated behavior), which corroborates the robustness of the SEM results from another perspective.
Strategic Human Resource Management (SHRM) refers to the entire set of strategic planning and strategy-oriented human resource management initiatives and behaviors held and implemented by an enterprise to achieve organizational performance. Strategic human resource management focuses on matching corporate strategy and human resource management, emphasizes on the long-term planning of the enterprise and the employees themselves, and formulates relevant strategies based on the strategic goals of the enterprise, which is fundamentally different from the traditional human resource management. Strategy becomes an obvious feature of strategic human resource management, which also expresses the important function of strategic human resource management, emphasizing on the strategic level to plan and implement human resource management related planning and measures to provide assistance and support for the implementation of enterprise strategy.
The theoretical framework of strategic human resource management is shown in Figure 1. If the enterprise’s political, economic, technological or cultural changes in the external environment, it will feedback and implicate the enterprise’s internal organizational structure, strategic decision-making and human resource management (HRM) to make corresponding changes, so that the enterprise can quickly respond to the environmental changes through corresponding adjustments and changes.
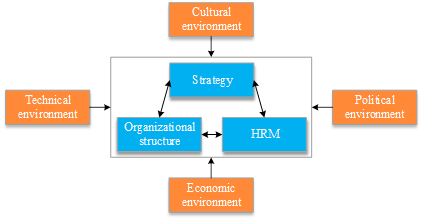
Strategic human resource management requires the formation of a harmonious set of procedures, plans and requirements under the guidance of the enterprise’s development strategy, and the transformation of the enterprise’s strategic objectives into an executable personnel management system in order to enhance the implementation of the accomplishment of the enterprise’s mission and the organization’s goals.
There are several main perspectives on the definition of proactive behavior:
One is the personality theory. It is defined as: whether it is to deal with the existing environment or when encountering changes and alterations in the external environment, individuals who are more determined and proactive within themselves will act more positively than other individuals in an effort to put themselves and their organizations in a favorable environment, with a view to bringing positive results to themselves and their organizations.
The second is the behavioral perspective. Individual initiative that individuals will spontaneously go to take a series of job duties outside the provisions of the act, in order to change themselves and the organization in the environment, in order to achieve personal goals and vision at the same time, seek the long-term development of the organization. Employee-initiated behavior is the employee in their own original basis for behavioral improvement and innovation, active adaptation to the dynamic organizational environment.
Third, the process theory point of view. Individual performance of autonomous action is a gradual realization of the process, specifically including expectations, plans and behavior in three aspects.
In summary, the three definitions have the following common points:
(1) The active work behavior of employees comes from their own pursuit, with obvious autonomy.
(2) The active behavior has a certain degree of forward-looking predictability.
(3) Employee’s active behavior has a certain degree of autonomy of change, employees can according to the changes in the organizational environment to change their own work behavior to adapt to the changes in the environment.
In this paper, the employee initiative behavior is summarized as: employees spontaneously, beyond the scope of responsibility to take action to promote the realization of organizational goals. These behaviors are critical to organizational innovation, adaptability, and long-term growth.
SHRM perceptions involve employees’ understanding, identification, and reaction to an organization’s strategic human resource management practices. It has been shown that positive SHRM perceptions enhance employees’ sense of belonging, satisfaction, and loyalty, which in turn promotes proactive behavior.
In order to validate the relationship between SHRM perception and employee proactive behavior, this paper utilized structural equation modeling to predict the linear relationship in the model, and at the same time, introduced deep learning techniques and explored the potential nonlinear effects in the model using convolutional neural networks to test the robustness of the SEM analysis results, so as to effectively explore the specific mechanism of the role of SHRM perception on employee proactive behavior.
Convolutional layer is one of the core elements in a convolutional neural network and is used to extract features from the input data. The parameters of the convolutional layer include, given the input image \(I\) and convolutional kernel \(K\), boundary padding size, and step size. Assuming that the input image size is \(W_{in} \times H_{in} \times D_{in}\) and the size of the convolution kernel is \(k_{w} \times k_{h} \times D_{in} \times D_{out}\) (where \(K\) is the size of the convolution kernel, \(D_{in}\) is the depth of the input image, and \(D_{out}\) is the depth of the output feature map), the size of the output feature map \(O\) is \(W_{out} \times H_{out} \times D_{out}\). Then there are: \[\label{GrindEQ__1_} O_{i, j, k} =\sum _{m=0}^{k_{w} -1}\sum _{n=0}^{k_{h} -1}\sum _{l=0}^{D_{in} -1}I_{i+m, j+n, l} \times K_{m, n, l, k} , \tag{1}\] where \(O_{i,j,k}\) is the value at position \(i,j\) of the \(k\)nd channel of the output feature map, \(I_{i+m,j+n,l}\) is the value at position \(i+m,j+n\) of the \(l\)th channel of the input image and \(K_{m,n,l,k}\) is the weight of the \(m,n\)th position of the \(k\)th channel of the convolution kernel.
The pooling layer is a kind of downsampling layer in the convolutional neural network used for downsampling and feature compression of the input data. The pooling layer extracts the main features in the feature map by spatially downsampling the feature map output from the convolutional layer, reduces the number of parameters in the model to reduce the computational cost and memory consumption, and helps the subsequent layers of the network to learn and represent the data features more effectively. Common types of pooling include maximum pooling and average pooling. Maximum pooling operation is to select the maximum value within a given pooling window as the output, while average pooling operation is to calculate the average value within the pooling window and use it as the output.
Each neuron in the fully connected layer is connected to all the neurons in the previous layer, and each connection has a weight parameter, so the number of parameters in the fully connected layer is large. The fully connected layer is located in the last layers of the model for performing classification or regression tasks, and its role is to flatten the features extracted by the previous convolutional layer or other feature extraction layers and weight and sum all the feature connections, and then pass them to the Softmax classifier.
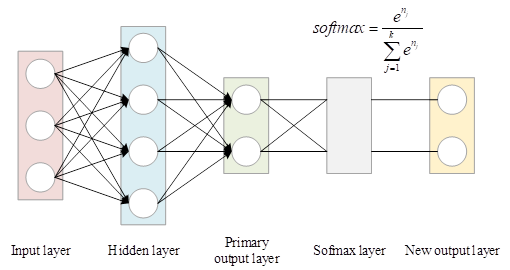
In deep learning, the Softmax layer is characterized by mapping each element in the input vector to a probability value such that the sum of all probability values is 1. It is usually used as the output layer of a neural network model for multiple classification tasks. It is able to output the probability distribution of each category thus helping to determine the final classification result.The Softmax layer is schematically shown in Figure 2. Its formula is as follows: \[\label{GrindEQ__2_} softmax=\frac{e^{n_{j} } }{\sum _{j=1}^{k}e^{n_{j} } } , \tag{2}\] where \(n_{j}\) denotes the \(j\)nd element of the original output vector and \(K\) is the total number of categories.
(1) ReLU function is currently the most commonly used activation function, which is computationally efficient, can alleviate the problem of gradient vanishing and has nonlinear characteristics. Its expression is as follows: \[\label{GrindEQ__3_} f(x)=max(0, x) , \tag{3}\] where \(x\) and \(f(x)\) are the input and output values of the ReLU activation function, respectively. When input \(x\ge 0\), \(f(x)=x\). When input \(x<0\), \(f(x)=0\).
(2) Sigmoid function output range is fixed between \((0, 1)\), suitable for binary classification task but there is a gradient disappearance problem. Its calculation formula is: \[\label{GrindEQ__4_} f(x)=\frac{1}{1+e^{-x} } . \tag{4}\]
(3) The Tanh function is a nonlinear activation function that introduces a nonlinear property in which the output value is close to 1 or -1 for larger or smaller values of its input. This nonlinear property helps the neural network model to learn complex nonlinear relationships. Its calculation formula is: \[\label{GrindEQ__5_} f(x)=\frac{e^{x} +e^{-x} }{e^{x} -e^{-x} } . \tag{5}\]
(4) The LeakyReLU function retains the advantages of ReLU, and at \(x\le 0\), the problem of neuron “death” in the ReLU function is alleviated by introducing a small slope \(a\). The formula is: \[\label{GrindEQ__6_} f(x)=max(ax,x) . \tag{6}\]
(1) Stochastic Gradient Descent (SGD) algorithm: Stochastic Gradient Descent is an optimization algorithm used to minimize or maximize the objective function. In each iteration, the SGD algorithm uses a small batch of randomly selected samples to estimate the gradient in order to reduce computational cost and accelerate convergence. The computational formula is given below: \[\label{GrindEQ__7_} \theta _{t+1} =\theta _{t} -\alpha \nabla J(\theta _{t} ) , \tag{7}\] where \(\theta _{t}\) is the parameter value after the \(t\)nd iteration, \(\alpha\) is the learning rate and \(\nabla J(\theta _{t} )\) is the gradient of the loss function \(J\) over parameter \(\theta _{t}\).
(2) Adam stochastic gradient descent algorithm: Adam is an adaptive learning rate optimization algorithm that combines momentum and adaptive learning rate methods to overcome discontinuities in the optimization process caused by the non-conductivity of the L1 loss function at the corners.Adam’s algorithm computes the estimates of the first-order moments and the second-order moments of the gradient at each iteration and uses them to adjust the learning rate of each parameter in order to update the parameters more efficiently. The formulae are as follows: \[\label{GrindEQ__8_} \theta _{t+1} =\theta _{t} -\frac{\alpha }{\sqrt{\hat{v}_{t} } +{\rm }} \hat{m}_{t} , \tag{8}\] \[\label{GrindEQ__9_} \hat{m}_{t} =\frac{m_{t} }{1-\beta _{1}^{t} } ,\hat{v}_{t} =\frac{v_{t} }{1-\beta _{2}^{t} } , \tag{9}\] \[\label{GrindEQ__10_} m_{t} =\beta _{1} m_{t-1} +(1-\beta _{1} )\nabla J(\theta _{t} ) , \tag{10}\] \[\label{GrindEQ__11_} v_{t} =\beta _{2} v_{t-1} +(1-\beta _{2} )\left(\nabla J(\theta _{t} )\right)^{2} , \tag{11}\] where \(m_{t}\) and \(v_{t}\) are exponentially weighted moving averages of the gradient and gradient squared, respectively and \(\beta _{1}\) and \(\beta _{2}\) are the moving average parameters, which generally take a range of \(\left[0,1\right)\).
(1) \(l_{p}\)-parameter regularization: \(l_{p}\)-paradigm regularization modifies the objective function by adding additional terms that reduce the complexity of the model. \[\label{GrindEQ__12_} E(\theta , x, y)={\rm {\mathcal L}}(\theta , x, y)+\lambda R(\theta ) , \tag{12}\] where \(R(\theta )\) denotes the regularization term, usually \(R(\theta )=\sum _{j}||\theta _{j} ||_{p}^{p}\) is used and \(\lambda\) denotes the regularization strength.
(2) Dropout layer: Dropout is a regularization method that prevents overfitting by randomly dropping neurons and setting the output of neurons to 0 with a certain probability during training thereby reducing the dependency between neurons.
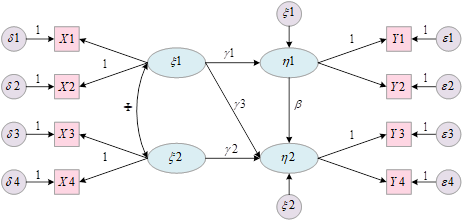
The measurement equation between the latent variables is shown below: \[\label{GrindEQ__15_} \eta _{2} =\beta \eta _{1} +\xi \gamma +\varsigma , \tag{15}\] where \(\varsigma\) is the structural residual term and \(\varepsilon\) is the endogenous latent variable observation residual term.
(1) Research hypotheses, research hypotheses and construction of the initial structural equation model based on theoretical research.
(2) Data collection, according to the initial structural equation model, design and distribute questionnaires.
(3) Data analysis, analyze the collected data for reliability and validity.
(4) Structural equation modeling analysis.
(5) Structural equation model fitness testing, and model correction if unsatisfactory.
(6) Model evaluation, according to the results of structural equation modeling analysis of the research object to evaluate and analyze.
Intrinsic reliability is commonly measured by the Cronbach\(\mathrm{\prime}\)s \(\alpha\) coefficient, which is calculated as: \[\label{GrindEQ__16_} \alpha =\frac{K}{K-1} \left(1-\frac{\sum \sigma _{i}^{2} }{\sigma ^{2} } \right) , \tag{16}\] where \(K\) is the number of questions, \(\sigma ^{2}\) is the variance of the total score and \(\sigma _{i}^{2}\) is the variance of the \(i\)th question. The Cronbach\(\mathrm{\prime}\)s \(\alpha\) coefficient has a value between 0 and 1. The Cronbach\(\mathrm{\prime}\)s \(\alpha\) coefficient has a value between 0 and 1. When \(\alpha <0.6\), the scale is highly problematic and needs to be redesigned. When \(0.6\le \alpha <0.7\), the scale has some problems but is informative and credible. When \(0.7\le \alpha <0.8\), the intrinsic reliability is acceptable and credible. When \(0.8\le \alpha <0.9\), the intrinsic reliability is high and credible. When \(0.9\le \alpha <1\), the intrinsic reliability is very high and credible [21].
Validity analysis refers to the validity analysis of the evaluation, that is, the degree of proximity between the measured value obtained from the study and the true value. Validity analysis generally includes content validity analysis and structural validity analysis. The former is generally conducted by experts or researchers to evaluate whether the indicators or factors of a questionnaire are representative of the subject or content to be measured. The latter is to conduct factor analysis through statistical analysis software to test whether the measurement results of the questionnaire can better represent the subject of the study. When validity is analyzed, Bartlett’s test of sphericity and KMO test are commonly used to measure it.
The KMO test is used to compare the correlation coefficient and partial correlation coefficient between variables and the formula is shown below: \[\label{GrindEQ__17_} KMO=\frac{\sum \sum _{i\ne j}r_{ij}^{2} }{\sum \sum _{i\ne j}r_{ij}^{2} +\sum \sum _{i\ne j}a_{ij}^{2} } , \tag{17}\] where \(r_{ij}\) is the correlation coefficient between variable \(x_{i}\) and variable \(x_{j}\) and \(a_{ij}\) is the partial correlation coefficient between variable \(x_{i}\) and variable \(x_{j}\) controlling for other variables [7].
The value of KMO is between 0 and 1. The closer the value of KMO is to 1, the stronger the correlation between the variables, which indicates that it is more suitable for factor analysis. The value of KMO is close to 0, the weak correlation between the variables, which indicates that it is not suitable for factor analysis. The commonly used KMO metrics are:
When \(KMO<0.5\), highly unsuitable for factor analysis. When \(0.5\le KMO<0.6\), not very suitable for factor analysis. When \(0.6\le KMO<0.7\), it is possible to do factor analysis. When \(0.7\le KMO<0.8\), more suitable for factor analysis. When \(0.8\le \alpha <0.9\), it is suitable for factor analysis. When \(0.9\le \alpha <1\), very suitable for doing factor analysis.
The Bartlett’s test of sphericity starts from the assumption that the correlation coefficient matrix of the original variables is a unit matrix. It is calculated to obtain a test statistic based on the determinant of the correlation coefficient matrix and this statistic obeys a chi-square distribution [20]. If the observed value of the calculated statistic is large and the corresponding p-value is less than a given significance level of \(\alpha\) (generally taken as \(\alpha =0.05\)), the null hypothesis is rejected, indicating that the correlation matrix of the original variables analyzed is not a unitary matrix and is suitable for factor analysis. Conversely, it is not suitable for factor analysis.
In order to explore the mechanism role of SHRM perception on employees’ proactive behavior, this paper proposes the following research hypotheses based on related research theories:
H1: SHRM perception positively affects employee proactive behavior.
H1-1: Work self-efficacy positively affects employee proactive behavior.
H1-2: Conceptual psychological contract positively influences employee proactive behavior.
H1-3: Job motivation positively influences employee-initiated behavior.
H1-4: SHRM perception positively influences job self-efficacy.
H1-5: SHRM perception positively influences idea-based psychological contract.
H1-6: SHRM perceived positively influences work motivation.
Meanwhile, combined with the AMO theoretical model, this paper proposes the following hypotheses:
H2: Job self-efficacy mediates between SHRM perception and employee proactive behavior.
H3: Conceptual psychological contract mediates between SHRM perception and employee-initiated behavior.
H4: Job motivation mediates between SHRM perceptions and employee-initiated behavior.
In addition, this paper considers the moderating role of insider identity perception and proposes the hypothesis:
H5: Insider identity perception plays a positive moderating role between SHRM perception and employee-initiated behavior.
H5-1: Insider identity perception plays a positive moderating role between SHRM perception and job self-efficacy.
H5-2: Insider identity perception positively moderates the relationship between perceived SHRM and conceptual psychological contract.
H5-3: Insider identity perception plays a positive moderating role between SHRM perception and work motivation.
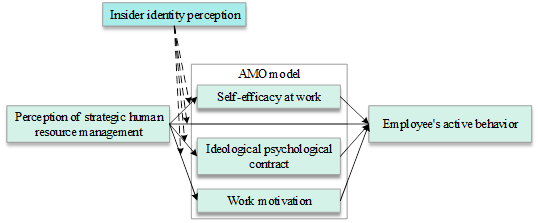
Synthesizing hypotheses H1-H5, the theoretical model of this study is constructed as shown in Figure 4.
| Project | Classification | Frequency | Percentage |
| Gender | Male | 233 | 48.6% |
| Female | 246 | 51.4% | |
| Age | \(\mathrm{<}\)25 | 94 | 19.6% |
| 26\(\mathrm{\sim}\)35 | 218 | 45.5% | |
| 36\(\mathrm{\sim}\)45 | 167 | 34.9% | |
| Educational background | Under junior college | 21 | 4.4% |
| Junior college | 97 | 20.3% | |
| Undergraduate | 222 | 46.3% | |
| Master’s degree or above | 139 | 29.0% | |
| Enterprise nature | State-owned enterprise | 88 | 18.4% |
| Private enterprise | 151 | 31.5% | |
| Foreign enterprise | 107 | 22.3% | |
| Sino-foreign joint venture | 72 | 15.1% | |
| Other | 61 | 12.7% | |
| Years of service | \(\mathrm{<}\)1 | 144 | 30.1% |
| 1\(\mathrm{\sim}\)5 | 217 | 45.3% | |
| 5\(\mathrm{\sim}\)10 | 107 | 22.3% | |
| \(\mathrm{>}\)10 | 11 | 2.3% | |
| Position type | Research and development class | 98 | 20.5% |
| Production class | 102 | 21.3% | |
| Marketing class | 88 | 18.4% | |
| Functional class | 108 | 22.5% | |
| Other | 83 | 17.3% |
As can be seen from Table 1, in terms of gender percentage, male and female are 48.6% and 51.4% respectively, the gender ratio of male and female is relatively balanced, and the influence of gender on the research analysis is so small that it can be approximated to be ignored. In terms of the percentage of age perspective, 19.6%, 45.5% and 34.9% are under 25 years old, 26-35 years old and 36-45 years old respectively, which are mainly concentrated in the age of 26-35 years old, when the employees are in the upward stage of their career development, and may be more effective in evaluating the policy system. In terms of education level, bachelor’s degree accounted for the largest share of 46.3%, followed by master’s degree and above (29.0%), with a higher concentration of bachelor’s degree among employees. In terms of the nature of the enterprise, state-owned enterprises, private enterprises, foreign enterprises, Sino-foreign joint ventures and other enterprises accounted for 18.4%, 31.5%, 22.3%, 15.1% and 12.7% respectively, with private enterprises accounting for the most. The number of years of working experience is concentrated in 1-5 years, accounting for 45.3%. In terms of the proportion of job types, R&D is 20.5%, production is 21.3%, marketing is 18.4%, function is 22.5%, and other is 17.3%, with a relative balance of different types of jobs.
| Scale | N | Minimum value | Maximum value | Mean | Standard deviation | Variance |
| SHRM perception | 479 | 1.69 | 7.00 | 5.9131 | 0.9308 | 0.8663 |
| Employee proactive behavior | 479 | 1.30 | 6.91 | 5.5763 | 1.0873 | 0.9745 |
| Self-efficacy | 479 | 2.36 | 6.07 | 5.7464 | 0.8526 | 0.7269 |
| Conceptual psychological contract | 479 | 3.12 | 7.54 | 5.6382 | 0.8804 | 0.4629 |
| Job motivation | 479 | 2.75 | 6.97 | 6.2161 | 0.7870 | 0.6193 |
| Insider identity perception | 479 | 1.28 | 7.25 | 5.6119 | 0.9912 | 0.9824 |
| Scale | Problem number | Cronbach’s \(\alpha\) |
| SHRM perception | 10 | 0.928 |
| Employee proactive behavior | 8 | 0.941 |
| Self-efficacy | 4 | 0.806 |
| Conceptual psychological contract | 5 | 0.889 |
| Job motivation | 4 | 0.764 |
| Insider identity perception | 3 | 0.792 |
| KMO sampling suitability quantity | 0.906 | |
| Bartlett sphericity test | Approximate chi square | 4356.147 |
| Freedom | 245 | |
| Significance | 0.000 | |
Exploratory factor analysis was conducted on the questionnaire data using SPSS28.0 software, and the results of the exploratory factor analysis are shown in Table 5.
| Initial eigenvalue | Extract the sum of squared loads | Sum of squared rotational loads | ||||
| SHRM perception | Total | Percentage of variance/% | Cumulative percentage/% | Total | Percentage of variance/% | Cumulative percentage/% |
| 1 | 14.226 | 38.213 | 38.213 | 14.226 | 38.213 | 38.213 |
| 2 | 3.643 | 11.311 | 49.524 | 3.643 | 11.311 | 49.524 |
| 3 | 2.706 | 8.122 | 57.646 | 2.706 | 8.122 | 57.646 |
| 4 | 1.885 | 4.163 | 61.809 | 1.885 | 4.163 | 61.809 |
| 5 | 1.453 | 3.281 | 65.09 | 1.453 | 3.281 | 65.09 |
| 6 | 1.118 | 2.652 | 67.742 | 1.118 | 2.652 | 67.742 |
| 7 | 0.889 | 2.312 | 70.054 | |||
| 8 | 0.837 | 2.023 | 72.077 | |||
| 9 | 0.803 | 1.759 | 73.836 | |||
| 10 | 0.734 | 1.731 | 75.567 | |||
| 11 | 1.687 | 1.623 | 77.19 | |||
| 12 | 0.651 | 1.507 | 78.697 | |||
| 13 | 0.627 | 1.488 | 80.185 | |||
| 14 | 0.602 | 1.446 | 81.631 | |||
| 15 | 0.574 | 1.402 | 83.033 | |||
| 16 | 0.556 | 1.319 | 84.352 | |||
| 17 | 0.513 | 1.288 | 85.64 | |||
| 18 | 0.483 | 1.186 | 86.826 | |||
| 19 | 0.468 | 1.105 | 87.931 | |||
| 20 | 0.431 | 1.081 | 89.012 | |||
| 21 | 0.408 | 1.064 | 90.076 | |||
| 22 | 0.383 | 1.036 | 91.112 | |||
| 23 | 0.362 | 1.018 | 92.13 | |||
| 24 | 0.344 | 0.972 | 93.102 | |||
| 25 | 0.323 | 0.934 | 94.036 | |||
| 26 | 0.306 | 0.878 | 94.914 | |||
| 27 | 0.272 | 0.761 | 95.675 | |||
| 28 | 0.259 | 0.745 | 96.42 | |||
| 29 | 0.244 | 0.714 | 97.134 | |||
| 30 | 0.223 | 0.682 | 97.816 | |||
| 31 | 0.217 | 0.644 | 98.46 | |||
| 32 | 0.209 | 0.563 | 99.023 | |||
| 33 | 0.183 | 0.524 | 99.547 | |||
| 34 | 0.165 | 0.453 | 100 | |||
As can be seen from Table 5, there are 6 initial eigenvalues of this study that are greater than 1. Therefore, the data of this questionnaire is suitable to be divided into 6 dimensions, which corresponds to the 6 variables set. The total variance explained by the results of the study is 67.742% \(\mathrm{>}\) 50%, indicating that the design of this questionnaire meets the requirements. The maximum value of the unrotated exploratory factor results is 38.213%, which means that the maximum factor explains 38.213% of the variance, indicating that there is no serious common methodological bias in the study, and the resultant data are less affected and can be used and proceed to the next step of the study.
| Variable | Item | Estimate | AVE | CR |
| SHRM perception | SH1 | 0.834 | 0.659 | 0.914 |
| SH2 | 0.778 | |||
| SH3 | 0.826 | |||
| SH4 | 0.795 | |||
| SH5 | 0.846 | |||
| SH6 | 0.772 | |||
| SH7 | 0.793 | |||
| SH8 | 0.805 | |||
| SH9 | 0.844 | |||
| SH10 | 0.839 | |||
| Employee proactive behavior | EM1 | 0.678 | 0.637 | 0.862 |
| EM2 | 0.772 | |||
| EM3 | 0.733 | |||
| EM4 | 0.825 | |||
| EM5 | 0.738 | |||
| EM6 | 0.789 | |||
| EM7 | 0.824 | |||
| EM8 | 0.818 | |||
| Self-efficacy | SE1 | 0.817 | 0.738 | 0.886 |
| SE2 | 0.885 | |||
| SE3 | 0.882 | |||
| SE4 | 0.894 | |||
| Conceptual psychological contract | CP1 | 0.817 | 0.725 | 0.887 |
| CP2 | 0.905 | |||
| CP3 | 0.828 | |||
| CP4 | 0.856 | |||
| CP5 | 0.814 | |||
| Job motivation | JM1 | 0.785 | 0.634 | 0.778 |
| JM2 | 0.757 | |||
| JM3 | 0.694 | |||
| JM4 | 0.712 | |||
| Insider identity perception | IP1 | 0.889 | 0.717 | 0.897 |
| IP2 | 0.806 | |||
| IP3 | 0.859 |
(2) Validation factor analysis: In this paper, the validation factor analysis of CFA model is carried out using Amos28 software, and the analysis obtains the fitness test indexes of CFA model, in which CMIN/IF (chi-square degrees of freedom ratio), RMSEA (root mean square of error), GFI, AGFI are absolute fitness indexes, and NFI, RFI, IFI are value-added fitness indexes. According to the structure of validated factor analysis, it can be seen that the CMIN/IF of this paper is 1.426, which is in the range of 1\(\mathrm{\sim}\)3. The RMSEA is 0.031\(\mathrm{<}\)0.05. The values of GFI, AGFI, NFI, RFI, and IFI are 0.952, 0.934, 0.953, 0.944, and 0.987, which are all greater than 0.9 respectively. The four absolute fitness indicators and three value-added fitness indicators are at an excellent level, which shows that the data of this study’s scale has good fitness.
(3) Convergent validity and combined reliability analysis: Under the premise that the CFA model has a good fit, the SPSS28 software was used to conduct the convergent validity (AVE) test and the combined reliability (CR) test for each dimension of the scale of this study. Convergent validity refers to the degree of expression of the observed variables on the influencing factors, and the factor loading (Estimate) is generally greater than 0.5 to meet the requirements.AVE value is generally greater than 0.5. CR values were generally greater than 0.7. The calculated AVE and CR values are shown in Table 6.
As shown in Table 6, the AVE values of SHRM perception, employee initiated behavior, self-efficacy, conceptual psychological contract, work motivation, and insider identity perception are 0.659, 0.637, 0.738, 0.725, 0.634, and 0.717, respectively, which are all greater than 0.5. The CR values were 0.914, 0.862, 0.886, 0.887, 0.778, and 0.897, which were all greater than 0.7. And the factor loadings are all greater than 0.6, indicating that the dimensions of the scale in this study have good convergent validity and combinatorial reliability.
(4) Distinguishing validity test: The SPSS28 software was used to conduct the discriminant validity test of this research scale, the discriminant validity test is used to test the differentiation between the dimensions, when the correlation coefficients between a dimension and any dimension are less than the square root of its convergent validity, it means that the dimensions have a significant degree of differentiation, and the discriminant validity of the research scale is good. The results of the discriminant validity test are shown in Table 7. The bolded font in the table is the square root of the AVE value.
As can be seen from Table 7, the correlations between SHRM perception, employee initiative behavior, self-efficacy, conceptual psychological contract, work motivation, and insider identity perception are all smaller than the square root of the corresponding AVE value, indicating that the discriminant validity between the dimensions of this study’s scale is good, and that the measurement information of the dimensions is differentiated, which is in line with the requirements for conducting structural equation modeling analysis.
| Variable | Coding | SH | EM | SE | CP | JM | IP |
| SHRM perception | SH | 0.812 | |||||
| Employee proactive behavior | EM | 0.589 | 0.798 | ||||
| Self-efficacy | SE | 0.504 | 0.525 | 0.859 | |||
| Conceptual psychological contract | CP | 0.525 | 0.667 | 0.612 | 0.851 | ||
| Job motivation | JM | 0.573 | 0.423 | 0.614 | 0.503 | 0.796 | |
| Insider identity perception | IP | 0.526 | 0.485 | 0.496 | 0.448 | 0.557 | 0.847 |
Covariance diagnosis was also performed, and in general studies, a VIF value greater than 10 indicates a high degree of covariance, and there may be significant overlap between the independent variables. In the course of this study, the maximum value of the VIF results was 3.21, and all VIF values were less than 10, indicating a low degree of covariance between the variables, which had little effect on the results of the study.
The results of multilevel linear regression are shown in Table 8. In Table 8, * denotes P\(\mathrm{<}\)0.05 and ** denotes P\(\mathrm{<}\)0.01, and all variables except control variables were centered.
As can be seen in Table 8, the results of the first level of regression: the coefficient of judgment R² is 0.071, the overall model F value is 6.148, P\(\mathrm{<}\)0.001, and the regression is valid as a whole. The P values in the control variables are all greater than 0.05, the effect is not significant.
Second level regression results: coefficient of determination R² is 0.352, overall model F value is 27.046, P\(\mathrm{<}\)0.001, regression overall valid. Among several control variables, only job category has a significant positive effect on employees’ proactive behavior (\(\beta\)=0.151, P\(\mathrm{<}\)0.05.) SHRM perception, job self-efficacy, and conceptual psychological contract have a significant positive effect on employees’ proactive behavior (\(\beta\)-value of 0.254, 0.241, 0.371, respectively, with P-value of \(\mathrm{<}\)0.01), which verifies hypotheses H1, H1-1, H1-2. The effect of work motivation on employees’ proactive behavior is not significant (P\(\mathrm{>}\)0.05), and hypothesis H1-3 is not verified.
The results of the third level regression: the coefficient of judgment R² is 0.356, the overall model F-value is 24.657, P\(\mathrm{<}\)0.001, the regression is valid overall. Among several control variables, still only job category has a significant positive effect on employees’ proactive behavior (\(\beta\)=0.148, P\(\mathrm{<}\)0.05).SHRM perception, job self-efficacy and conceptual psychological contract have a significant positive effect on employees’ proactive behavior (\(\beta\)-value of 0.221, 0.245, 0.363, respectively, P\(\mathrm{<}\)0.01), and the effect of work motivation on employees’ proactive behavior is not significant (P\(\mathrm{>}\)0.05). It indicates that the above variables are affected by the product term of SHRM perception and insider identity perception, and there is a change in the role of the mechanism of employee initiative behavior.
| Dependent variable | Employee proactive behavior | Employee proactive behavior | Employee proactive behavior |
| (Constants) | -0.218 | -0.295 | -0.257 |
| Gender | -0.002 | -0.012 | -0.018 |
| Age | 0.015 | -0.116 | -0.112 |
| Educational background | -0.153 | -0.027 | -0.031 |
| Enterprise nature | 0.113 | 0.083 | 0.087 |
| Years of service | 0.122 | 0.102 | 0.102 |
| Position type | 0.126 | 0.151* | 0.148* |
| SHRM perception | 0.254** | 0.221** | |
| Self-efficacy | 0.241** | 0.245** | |
| Conceptual psychological contract | 0.371** | 0.363** | |
| Job motivation | -0.092 | -0.087 | |
| SHRM perception\(\mathrm{\times}\)Insider identity perception | -0.051 | ||
| R² | 0.071 | 0.352 | 0.356 |
| \(\mathit{\Delta}\)R² | 0.052 | 0.332 | 0.334 |
| F | 6.148 | 27.046 | 24.657 |
As shown in Table 9, SHRM perception has a significant positive effect on work self-efficacy, conceptual psychological contract, and work motivation (P\(\mathrm{<}\)0.01), and the confidence interval does not contain 0. Hypotheses H1-4, H1-5, and H1-6 are verified.
| N=479 | Fit index | Significance | ||||
| Result variable | Predictor variable | R | R² | F(df) | \(\beta\) | t |
| Self-efficacy | 0.49 | 0.27 | 26.37(6) | |||
| Gender | -0.18 | -2.35* | ||||
| Age | 0.03 | 0.31 | ||||
| Educational background | -0.18 | -2.31* | ||||
| Enterprise nature | 0.13 | -2.54* | ||||
| Years of service | 0.08 | 2.23* | ||||
| Position type | -0.05 | -0.71 | ||||
| SHRM perception | 0.39 | 11.34** | ||||
| Conceptual psychological contract | 0.58 | 0.34 | 45.38(6) | |||
| Gender | -0.07 | -0.81 | ||||
| Age | 0.02 | 0.22 | ||||
| Educational background | 0.15 | 2.07* | ||||
| Enterprise nature | 0.13 | 2.43* | ||||
| Years of service | 0.14 | 3.23** | ||||
| Position type | 0.05 | 0.68 | ||||
| SHRM perception | 0.49 | 14.96** | ||||
| Job motivation | 0.42 | 0.19 | 19.54(6) | |||
| Gender | 0.08 | 0.94 | ||||
| Age | -0.06 | -0.51 | ||||
| Educational background | 0.15 | 2.23* | ||||
| Enterprise nature | 0.11 | 2.18* | ||||
| Years of service | 0.07 | 1.64 | ||||
| Position type | -0.09 | -1.36 | ||||
| SHRM perception | 0.42 | 11.04** | ||||
The results of the mediator indirect effect test are shown in Table 10.
As shown in Table 10, the indirect effect values of job self-efficacy and conceptual psychological contract as a mediator are 0.1043 and 0.1726, respectively, which are positive effects, and the confidence intervals do not contain 0. Hypotheses H2 and H3 are verified. The confidence interval for work motivation was [-0.0942, 0.0225] and contained 0. The mediating effect was not verified and hypothesis H4 was not verified.
| Mediation variable | Indirect effect | Boot standard error | Lower limit of Boot CI | Upper limit of Boot CI |
| Self-efficacy | 0.1043 | 0.0283 | 0.0434 | 0.1545 |
| Conceptual psychological contract | 0.1726 | 0.0516 | 0.0894 | 0.2793 |
| Job motivation | -0.0431 | 0.0312 | -0.0942 | 0.0225 |
This study utilized the product term of SHRM perception and insider identity perception to test the moderating effect of insider identity perception by whether it has a significant effect on employee proactive behavior, job self-efficacy, conceptual psychological contract, and work motivation. The results showed that insider identity perception had a significant moderating effect between SHRM perception and employee proactive behavior (\(\beta\)=0.09, P\(\mathrm{<}\)0.01), SHRM perception and job self-efficacy (\(\beta\)=0.126, P\(\mathrm{<}\)0.01), SHRM perception and conceptual psychological contract (\(\beta\)=0.102, P\(\mathrm{<}\)0.01), and SHRM perception and work motivation (\(\beta\)= 0.119, P\(\mathrm{<}\)0.01) were all significantly positively moderated, thus hypotheses H5, H5-1, H5-2, and H5-3 were all tested.
SEM can effectively predict linear relationships in complex models, but is deficient in detecting nonlinear relationships. Therefore, in order to explore the potential nonlinear effects in the model, this paper utilizes the convolutional neural network approach for hypothesis testing and also to further test the robustness of the SEM analysis results.
In this study, a multilayer perceptron based on the BP algorithm is used to generate the CNN model, in which the activation function is set to Sigmoid. the independent variables in the SEM that significantly affect employee-initiated behaviors (SHRM perception, job self-efficacy, conceptual psychological contract, job category, and insider identity perception) are used as the inputs to the CNN, while employee-initiated behaviors belong to the output layer. A 10-fold cross-validation approach was used to address the potential overfitting problem, where 30% of the data was used to test the convolutional neural network model and the remaining 70% was used for training.The prediction accuracies of the CNN model are shown in Table 11.
As can be seen from Table 11, the mean values of RMSE (Root Mean Square Error) in the training and testing phases are 0.103 and 0.106, respectively, indicating that the CNN model possesses good prediction accuracy.
| Neural network | Training | Testing | ||
| N | RMSE | N | RMSE | |
| CNN1 | 335 | 0.114 | 144 | 0.135 |
| CNN2 | 329 | 0.113 | 150 | 0.129 |
| CNN3 | 337 | 0.108 | 142 | 0.136 |
| CNN4 | 336 | 0.112 | 143 | 0.113 |
| CNN5 | 332 | 0.114 | 147 | 0.093 |
| CNN6 | 333 | 0.116 | 146 | 0.091 |
| CNN7 | 328 | 0.110 | 151 | 0.118 |
| CNN8 | 340 | 0.107 | 139 | 0.115 |
| CNN9 | 334 | 0.114 | 145 | 0.108 |
| CNN10 | 324 | 0.118 | 155 | 0.121 |
| Mean | 0.113 | 0.116 | ||
| Standard deviation | 0.003 | 0.016 | ||
Sensitivity analysis was conducted using convolutional neural network to assess the ability of all independent variables to predict the dependent variable employee initiated behavior. The results of the sensitivity analysis are shown in Table 12.
As shown in Table 12, the conceptual psychological contract has the highest relative importance in predicting employee-initiated behavior (100%), job self-efficacy, SHRM perception, and job category are in the second, third, and fourth places (91.46%, 85.76%, and 72.47%), and insider status perception has the lowest level of importance in predicting employee-initiated behavior (40.82%).
| Neural network | SHRM perception | Self-efficacy | Conceptual psychological contract | Position type | Insider identity perception |
| CNN1 | 0.335 | 0.207 | 0.354 | 0.159 | 0.094 |
| CNN2 | 0.369 | 0.323 | 0.379 | 0.176 | 0.105 |
| CNN3 | 0.246 | 0.238 | 0.383 | 0.207 | 0.144 |
| CNN4 | 0.189 | 0.392 | 0.272 | 0.245 | 0.139 |
| CNN5 | 0.265 | 0.349 | 0.293 | 0.214 | 0.136 |
| CNN6 | 0.261 | 0.211 | 0.316 | 0.187 | 0.102 |
| CNN7 | 0.213 | 0.242 | 0.302 | 0.253 | 0.133 |
| CNN8 | 0.256 | 0.338 | 0.165 | 0.235 | 0.146 |
| CNN9 | 0.236 | 0.336 | 0.318 | 0.294 | 0.106 |
| CNN10 | 0.336 | 0.257 | 0.373 | 0.318 | 0.181 |
| Mean of relative importance | 0.271 | 0.289 | 0.316 | 0.229 | 0.129 |
| Normalized relative importance | 85.76% | 91.46% | 100.00% | 72.47% | 40.82% |
The predictive power of input values (independent variables) in convolutional neural networks is measured by normalized relative importance, and a similar metric in SEM is the path coefficient.The comparison of the results of SEM and CNN is shown in Table 13. Where SH, SE, CP, PT, IP and EM denote SHRM perception, job self-efficacy, conceptual psychological contract, job category, insider status perception and employee initiative behavior respectively.
As can be seen from Table 13, the CNN model and the SEM are consistent in ranking the importance of the independent variables, which are, from largest to smallest: conceptual psychological contract, job self-efficacy, SHRM perception, job category, and insider identity perception. This validates the robustness of the results of the first stage of empirical testing.
| SEM path | SEM path coefficient | CNN importance/% | Path coefficient sort | Importance sort |
| SH-EM | 0.221 | 85.76% | 3 | 3 |
| SE-EM | 0.245 | 91.46% | 2 | 2 |
| CP-EM | 0.363 | 100.00% | 1 | 1 |
| PT-EM | 0.148 | 72.47% | 4 | 4 |
| IP-EM | 0.090 | 40.82% | 5 | 5 |
This paper explores the mechanistic role of SHRM perceptions on employees’ proactive behaviors in the following two main stages:
(1) In the first stage, structural equation modeling was utilized for the analysis. First, a questionnaire was designed and research hypotheses were formulated using SHRM perception as the independent variable, employee proactive behavior as the dependent variable, job self-efficacy, conceptual psychological contract, and work motivation as the mediator variables, insider identity perception as the moderator variable, and gender, age, education, nature of the company, years of experience, and job type as the control variables. Then, the hypotheses were tested by multilevel linear regression, and the resulting coefficient of determination R² was 0.344, and the overall model F-value was 23.775, P\(\mathrm{<}\)0.001, and the regression was valid overall. Among the control variables, only job category had a significant positive effect on employee proactive behavior (\(\beta\)=0.148, P\(\mathrm{<}\)0.05). While SHRM perception, job self-efficacy and conceptual psychological contract have significant positive effects on employee proactive behavior (\(\beta\) values of 0.221, 0.245, 0.363, respectively, P\(\mathrm{<}\)0.01), work motivation does not have a significant effect on employee proactive behavior (P\(\mathrm{>}\)0.05). Then, the variables were tested for mediating effects and moderating effects.SHRM perception had a significant positive effect on work self-efficacy, conceptual psychological contract, and work motivation (P\(\mathrm{<}\)0.01), and the indirect effect values of work self-efficacy and conceptual psychological contract as mediators were 0.1043 and 0.1726, respectively, which were positive, and none of the confidence intervals contained 0, indicating that work self-efficacy and conceptual psychological contract have a mediating role. And insider identity perception has a significant positive moderating effect between SHRM perception and all other variables (P\(\mathrm{<}\)0.01).
(2) In the second stage, hypothesis testing was conducted using the CNN model, which ranked the importance of the independent variables in descending order: conceptual psychological contract, job self-efficacy, SHRM perception, job category, and insider identity perception, which was consistent with the results of the SEM ranking, and verified the robustness of the results of the SEM analysis.