
Concrete, as a widely used construction material in today’s society, plays an indispensable role in the field of civil engineering, and the mechanical properties of concrete are closely related to structural safety and the economy of construction. Mass concrete is commonly used in bridges, tunnels, dams, large buildings and other engineering projects. Due to the large size of the mass concrete structure, and the internal embedded dense reinforcing steel mesh, pre-embedded pipelines, concrete cooling pipes, etc., poor vibration and layered pouring time is too long and other factors are prone to cause defects such as honeycomb, segregation, lack of compaction and voids within the concrete structure [26,17,29,19]. Whether the construction quality of mass concrete structure is good or not is an important factor that affects the bearing capacity and durability of the superstructure, in order to ensure the long-term performance of mass concrete structure, the detection and evaluation of its internal structure is crucial [15,22,3].
CT scanning technology has the advantages of high resolution, reflecting the real structural characteristics of the internal material, and can obtain the structural information of the internal structure of the inspection object without damaging the inspection object [25,5]. The working principle of CT scanning technology is to use X-rays to scan a certain tomography of the object to be inspected from multiple directions, and then use a specialized detector to collect the information of the ray attenuation of the object to be inspected, and then reconstruct the image through a computer using a specialized image reconstruction algorithm, and then collect the information of the object to be inspected. Computer using specialized image reconstruction algorithms, the scanned section to two-dimensional or three-dimensional gray-scale image form to show, the detection of intuitive results is the fault image of the inspected object [11,2,7,6,27]. Through the CT scanning technology for large volume concrete components, to obtain typical defects CT images, to carry out CT scanning detectable concrete thickness range, imaging accuracy and other experimental research, in-depth understanding of the applicability and superiority of CT scanning technology in concrete detection [4,21,16].
Elastic wave CT scanning technology uses an excitation hammer to excite the elastic wave, with wave speed and signal amplitude as the basis for calculation, through the cross-measurement line of the object to be inspected for all-round scanning, combined with the CT technology of the captured data for inverse imaging, you can reach the distribution of defects within the concrete structure. Guo et al. [8] utilized elastic wave CT scanning (EWCT) technology to comprehensively evaluate and predict the fractal characteristics of dam concrete structures, constructed a quality evaluation model linking concrete strength, maturity and EWCT fractal dimension, and successfully verified that fractal dimension can be used as a key index for dam concrete inspection, laying a foundation for non-destructive testing of dam concrete. Li et al. [14] examined the application of impact elastic waves in the structural detection of mass concrete dams by generating elastic wave excitation by impacting the concrete downstream of the dam and receiving the elastic wave signals in the upstream reservoir, which is able to detect the internal mass distribution of mass concrete dams using the elastic wave propagation time, and the results are more efficient and reliable. Lee et al. [13] fused the longitudinal wave characteristics with the nature of porous media to construct the Biot model, and compared the experimental test results of concrete specimens in terms of permeability, longitudinal wave propagation velocity, and longitudinal wave attenuation velocity indexes with the predicted results of the model, and found that the proposed model has the validity in monitoring the permeability of concrete in underground infrastructures. Guo et al. [9] proposed an elastic wave tomography detection method for inverse computation of pile foundations of high-rise buildings, and found that the tomography of the typical Gauss-damped Newton method possesses faster convergence speed, higher accuracy, and smaller error than the typical Gauss-Newton method, which is suitable for monitoring the integrity and quality of pile foundations of high-rise buildings.
Ultrasonic tomography imaging is a non-destructive testing method that utilizes the propagation time of ultrasonic waves in concrete structures, combined with CT technology to invert the imaging and reconstruct the ultrasonic wave velocity distribution. Haach et al. [10] explored the potential of ultrasonic tomography in the monitoring and quality assessment of concrete structures, and the results of experimental tests showed that ultrasonic tomography was more effective than conventional ultrasonic testing methods in assessing the homogeneity of concrete structures and detecting discontinuities and damage. Anoni et al. [1] research on image reconstruction techniques that enhance the accuracy and clarity of ultrasonic tomography images has advanced the development of techniques for visualizing the interior of concrete structures, which is beneficial for detecting or evaluating various types of damage in concrete components. Perlin et al. [20] designed a ray tracing technique based on network theory, which takes into account the non-linear propagation behavior of machine waves between the transmitting and receiving sensors in non-homogeneous materials, and helps in accurately detecting the size and shape of defects within concrete. Niu et al. [18] fused multiple ultrasonic propagation parameters as the information source of ultrasonic tomography based on Bayesian theory to evaluate the internal defects of concrete structures, which simplified the additional measurement process in ultrasonic tomography and was more accurate in detecting and evaluating concrete specimens with different defects.
Ground Penetrating Radar (GPR) is commonly used in the detection of underground target body, which transmits high-frequency electromagnetic waves through the antenna and receives the reflected waves from the antenna interface, and deduces the spatial location and geometric shape of the target body by analyzing the related information such as the wave speed, wave amplitude, spectral characteristics, and morphology characteristics of the reflected waves. Tosti et al. [24] introduced the application of Ground Penetrating Radar method (GPR) in the detection of reinforced concrete structures, and proposed a high-frequency dual-polarized antenna system, which significantly improves the detection of the exact location of reinforcement bars under high-density grid distribution by double-curve fitting of horizontal polarization and vertical polarization of reinforcement bars. Tasker et al. [23] addressed the inadequacy of a single ground-penetrating radar measurement to account for the rate and extent of concrete degradation by proposing that repeated (4D) ground-penetrating radar measurements over a calendar time period can provide a reliable indication of changes in the condition of the concrete material to be studied within a region of accentuated four-dimensional strain change. Lachowicz et al. [12] showed that the common ground-penetrating radar method treats concrete structures as homogeneous materials during their modeling, and so an algorithm based on a surrogate value of the concrete material constants based on the modified complex refractive index method was used to construct a heterogeneous numerical model of concrete, which is fully capable of realizing finite-difference simulations of concrete in the time domain. Zatar et al. [28] investigated the effect of environmental factors on ground-penetrating radar signals over time in the inspection of concrete structures, and the results of the study showed that the chloride content of reinforcement, surface corrosion, and temperature were negatively correlated with the amplitude of reflections from uncontaminated reinforcement, and that the effect of chloride content was proportionally increased for contaminated concrete.
Therefore, we start from the direction of optimizing the testing method and solving the difficulties in extracting high-frequency dispersion curves to improve the face wave method.
The dispersion characteristics of surface wave make it able to reflect the different depths of the measured structure, so the extraction of the dispersion curve is the most important part in the application of surface wave technology. Commonly used dispersion curve extraction algorithms include F-K frequency domain analysis based on multi-channel sensors for data acquisition and analysis, and phase difference method which can be analyzed by two-channel sensors.
Among them, the multichannel surface wave (MASW) method uses 12\(\mathrm{\sim}\)24 channels sensors to receive surface wave signals and obtain a dispersion curve by F-K frequency domain analysis, which has the advantage of high vertical resolution, but low lateral resolution, and a large amount of workload in the deployment of the sensors, which makes the detection efficiency low. While the two-channel surface wave method usually adopts the phase difference method to analyze and plot the surface wave dispersion curve, Shao Guangzhou, Wan Zhi, Li Yongxin and others have studied this method. The phase difference method is simple to test, but the stability of phase analysis is poor, while the phase of the signal between the two channels needs to be less than 2\(\pi\), so it has not been widely used in the field of concrete inspection.
In order to further explore the application potential of the face wave method within the field of concrete structure inspection, we propose a new method, i.e., the concrete face wave CT technique using multi-channel sensors (at least four channels) for inspection.
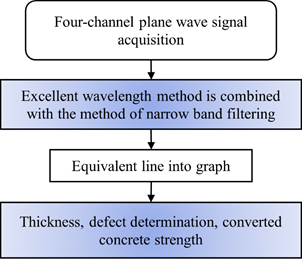
The dispersion curve of the surface wave between sensors is extracted by the excellent wavelength method and multiple filtering method, and the dispersion signal of the deep surface wave is enhanced by the superposition method of the f-v curve, and finally, the wave speed of the surface wave is converted to the dynamic elasticity modulus of the measured body, and the internal strength index of the concrete structure is derived by combining with the fitting of the sigmoid curve. The flow chart of the surface wave CT technique is shown in Figure 1 below:
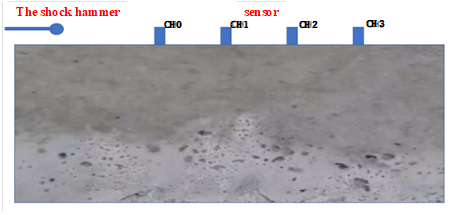
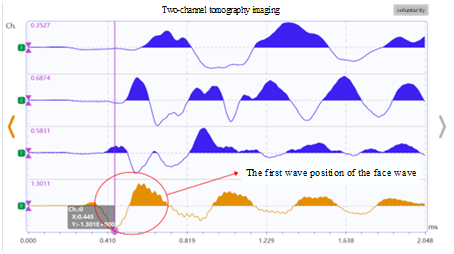
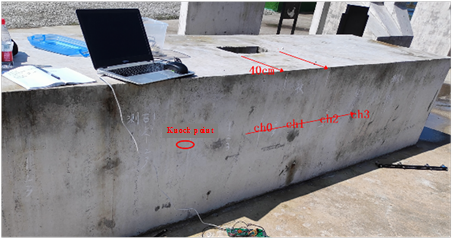
Four-channel acceleration sensors (expandable) are used to collect the surface wave signals, and the vibration source is struck with excitation hammers of different diameters to generate the impact elastic wave signals (see Figures 2 and 3).
The depth of influence of the surface wave is probably within one time of the wavelength of the surface wave, and the signal wavelength is mainly related to the measured concrete elastic mold and the diameter of the vibrating hammer. In order to better reflect the situation of different depths of concrete, it is desirable to use a variety of diameters of vibrating hammers for percussion respectively during the detection (see Table 1 for details).
|
Concrete label
Hammer diameter |
C30 | C40 | C50 |
| 17mm (metal) | 15.35 | 15.78 | 16.11 |
| 30mm (metal) | 8.7 | 8.94 | 9.13 |
| 50mm (metal) | 5.22 | 5.37 | 5.48 |
| 50mm (nylon hammer) | 1.08 | 1.28 | 1.48 |
| 150mm (nylon hammer) | 0.39 | 0.52 | 0.65 |
Note: The signal frequency is greatly affected by the material and diameter of the hammer, and the actual application is selected according to the type of structure.
The excellent wavelength method and narrow-band filtering method are combined to analyze the surface wave dispersion curve, and the frequency range of the corresponding dispersion curve varies with the main frequency of different hammers, so the center of gravity frequency of the signal is analyzed first, and then the center of gravity frequency is combined with the frequency range of the frequency range of the extracted dispersion curve.
Fast Fourier transform method is used to calculate the center of gravity frequency of each channel waveform data \(\bar{{\rm {\mathcal F}}}_{i}\) (\(i\) is the waveform serial number). \[\label{GrindEQ__1_} \bar{{\rm {\mathcal F}}}_{i} =\frac{\sum \left(f\times a\right) }{\sum a } , \tag{1}\] where, \(f\) is the frequency value of each frequency point and \(a\) is the corresponding amplitude of the frequency point.
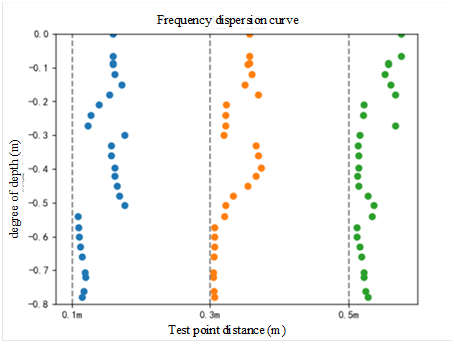
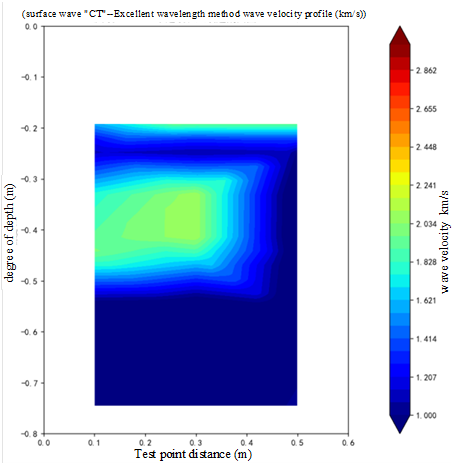
Through the correlation analysis to get the wave speed \(V_{i}\) between neighboring sensors in each group of data, according to the signal center of gravity frequency \(\bar{{\rm {\mathcal F}}}_{i}\) and \(V_{i}\) can be plotted the corresponding dispersion curve (see Figure 4 for details).
The dispersion value extracted by the excellent wavelength method is stable and reliable, but the number of dispersion points and frequency are related to the number of waveforms and the types of hammers, so the frequency values are scattered, and there is a blind spot in the frequency band of non-excited hammer signals.
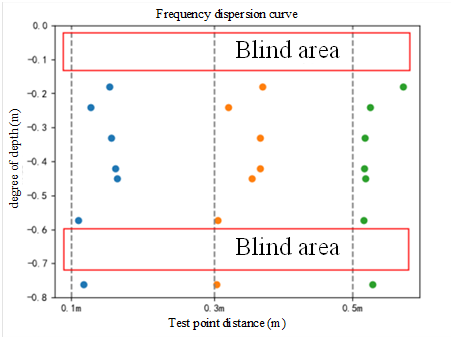
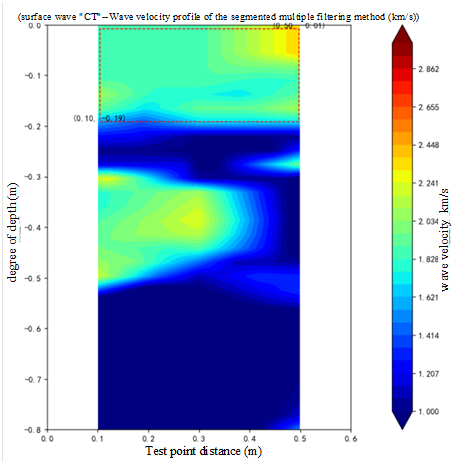
This results in low resolution for shallow defects and deep defects, and in order to improve this problem, the segmented multiple filtering method is introduced for analysis.
Multi-filtering method is a method of narrow-band filtering of surface wave signals, and determining the wave speed by selecting points according to the energy extremes of the filtered waveforms. When calculating, FFT analysis is carried out on the surface wave signals received by adjacent sensors \(S\left(t_{1} \right),S\left(t_{2} \right)\): \[\label{GrindEQ__2_} \mu \left(f\right)=\int _{-{\rm \infty }}^{+{\rm \infty }}S\left(t\right)e^{-ift} dt . \tag{2}\]
In Eq. (2), \(f\) is the frequency (Hz) and \(t\) is the time (s) to design the narrowband filter as follows: \[\label{GrindEQ__3_} N(f_{n} ,f)=\left\{\begin{array}{ccc} {0} & {} & {f<f_{1n} } ,\\ {\exp \left[-\alpha \left[\frac{f-f_{n} }{f_{n} } \right]\right]} & {} & {f\in \left(f_{1n} :f_{2n} \right)}, \\ {0} & {} & {f>f_{2n} }. \end{array}\right. \tag{3}\]
In Eq. (3), \(f_{n}\) is the main frequency of the signal, \(f_{1n} ,f_{2n}\) is the upper and lower limit frequency of the filter, in this paper, the lower limit is 0.8\(f_{n}\), the upper limit is taken as 1.15 \(f_{n}\), while the attenuation factor \(\alpha\) is taken as 50.3.The filtered spectral signal is transformed into the time-domain signal using the Fourier inversion \(A\left(t_{1} \right),A\left(t_{2} \right)\), and the time difference is calculated by using the maximum selection method \(\Delta t\), which is used for calculating the surface wave speed.
The multiple filtering method can also directly draw the dispersion curve of a single data, but it will also face the problem of signal stability, and if multiple filtering is carried out in the main frequency range of the signal, the stability of the result will be greatly improved, so this paper proposes to use the segmented multiple filtering method to extract the dispersion curve, that is, the main frequency of the filter \(f_{n}\) is set according to the main frequency of the original waveform signal \(\bar{{\rm {\mathcal F}}}_{i}\), and the main frequency of the filter \(f_{n}\) can be set to 0.6\(\bar{{\rm {\mathcal F}}}_{i}\), 0.7\(\bar{{\rm {\mathcal F}}}_{i}\), 0.8\(\bar{{\rm {\mathcal F}}}_{i}\), 0.9\(\bar{{\rm {\mathcal F}}}_{i}\), 1.0\(\bar{{\rm {\mathcal F}}}_{i}\), 1.1\(\bar{{\rm {\mathcal F}}}_{i}\), 1.2\(\bar{{\rm {\mathcal F}}}_{i}\), Thus, the wave velocity value corresponding to the frequency of each segment can be obtained, and the dispersion curve of each group of data dispersion points is drawn together after the calculation is completed, which can effectively reduce the blind area of the dispersion curve and enhance the resolution of the surface wave method (see Figure 5 for details).
The two analysis methods are used to compare the 20cm thick retaining wall data into a map, as shown in Figure 6: Segmented multiple filtering method can ensure the stability of the dispersion curve while improving the discriminatory power.
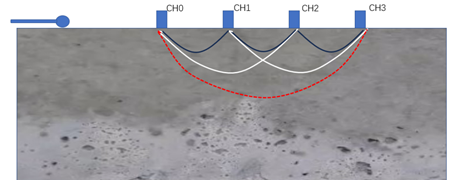
The dispersion curve between adjacent channel sensors exists deep signal is not obvious phenomenon, and at the same time is prone to the problem of poor stability of the dispersion curve, therefore, as shown in Figure 7, in addition to calculating the dispersion curve between adjacent sensors, such as ch0-ch1, ch1-ch2, ch2-ch3 channel, the dispersion curve between the rest of the sensors together with the calculation of the superposition. The superimposed dispersion curves are used to analyze the graph, i.e. the f-v dispersion curve superposition method.
The superposition process can effectively enhance the deep dispersion signal and improve the stability of the extracted surface wave dispersion curve.
Concrete strength is the most important performance index of concrete, reflecting the bearing capacity of the material at the time of destruction, and is therefore difficult to test by non-destructive methods. However, there is a good correlation between the modulus of elasticity and compressive strength for concrete with relatively similar mix ratios. Therefore, the compressive strength of concrete can be indirectly deduced based on the tested elastic modulus and the calibrated elastic modulus \(\mathrm{\sim}\) compressive strength relationship, and the value of the elastic modulus of the material can be calculated from the elastic wave velocity obtained from the test (see Figure 8 for details).
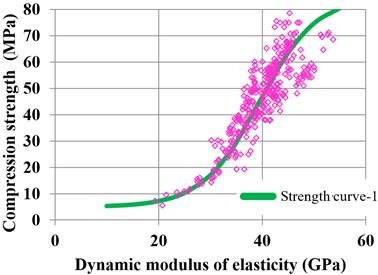
The conversion relationship between the surface wave and the dynamic modulus of elasticity of the concrete material is as follows: \[\label{GrindEQ__4_} E\left(d\right)=\frac{2\left(1+\mu \right)^{3} }{\left({\rm 0.87+1.12}\mu \right)^{2} } \rho V_{R} {}^{2} , \tag{4}\] where, \(E\left(d\right)\) is the value of dynamic elastic modulus, \(V_{R}\) is the surface wave velocity, \(\mu\) is Poisson’s ratio, and \(\rho\) is the concrete density. According to a large number of test data, for ordinary concrete specimens (core samples), \(E_{d} \sim f_{cu}\) can be expressed as: \[\label{GrindEQ__5_} \frac{f_{cu} }{M_{pa} } =5+\frac{80}{1+e\frac{39.5-E_{d} /G_{pa} }{5.5} } . \tag{5}\]
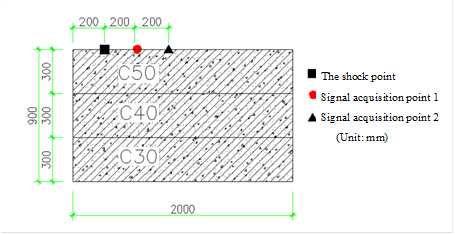
In order to verify the effect of extracting frequency dispersion curves of surface waves in concrete, a three-layer layered concrete model is designed for finite element simulation analysis (see Figure 9 for details), the thickness of a single layer is 0.3 m, and the total thickness of the model is 0.9 m. The strength of the concrete is C50, C40, and C30, and the simulation is carried out by using three types of excitation hammers (17 mm, 30 mm, and 50 mm) to strike, and the frequencies of the excitation sources are respectively 16KHz, 9KHz, 5KHz.
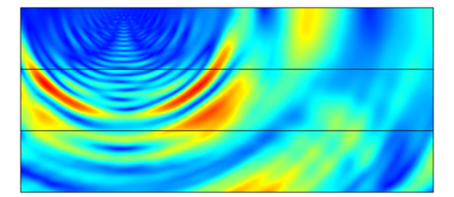
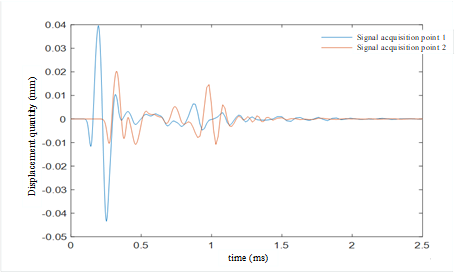
Snapshots of the finite element simulated wavefield and waveforms are shown in Figure 10 to Figure 11.
The contour results are plotted after extracting the dispersion curves of the simulated data using the segmented multiple filtering method (see Figure 12 for details).
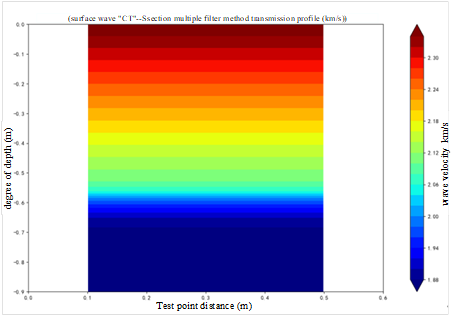
The analytical results are in general agreement with the model design values.
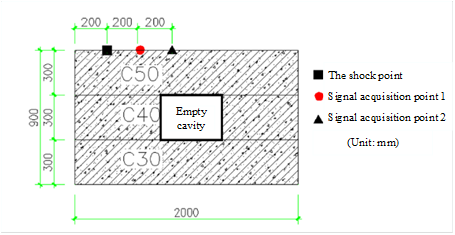
In order to verify the effectiveness of the surface wave CT method for detecting concrete defects, a cavity defect is added to the three-layer layered concrete model, and a finite element simulation analysis is carried out after the cavity is set up in it (see Figure 13 for details), and the simulation is carried out using three types of excitation hammers (17 mm, 30 mm, and 50 mm) for tapping, with the excitation source frequency of 16 KHz, 9 KHz, and 5 KHz, respectively.
The contour results are plotted after extracting the dispersion curves of the simulated data using the segmented multiple filtering method (see Figure 14 for details).
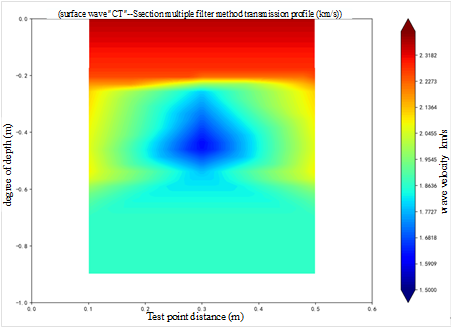
The low-speed area in the above diagram generally matches the location of the design defect.
In order to further verify the application effect of the surface wave CT method in the detection of concrete structural defects, experimental verification was carried out in a concrete model and a tunnel lining inspection site of a section of the Sichuan-Tibet Railway, respectively.
The concrete model is 1m thick and 5m long, the preset void defect is 0.4m from the test surface, the length is 0.4m, the defect thickness is 0.2m, and the knockout test is carried out on the side of the model by using the face wave CT method, and the test schematic is shown in Figure 15.
The collected data were analyzed into graphs using segmented multiple filtering and the results are shown in Figure 16:
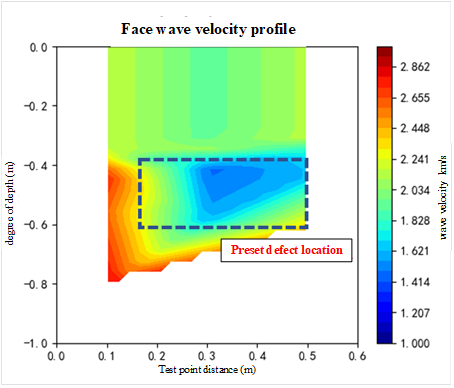
The blue box in the figure is the preset defect location, the surface wave velocity value is obviously low, with the design defect location is basically the same, at the same time, the defect of the top and bottom of the error is only 1cm, the test results are good.
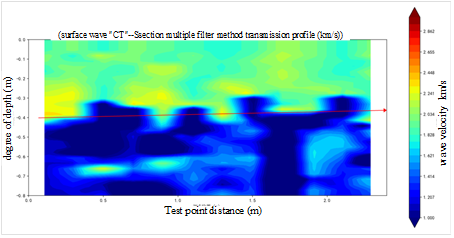
The use of surface wave CT method on the Sichuan-Tibet Railway, a section of the tunnel second lining detection, the determination of defects in the location of the impact echo acoustic frequency method for comparative testing, and finally drill core verification, and the dense location of the concrete core ballast testing strength.
The location of the test line is the tunnel vault, with a lining design thickness of 40cm and a design strength of C40.
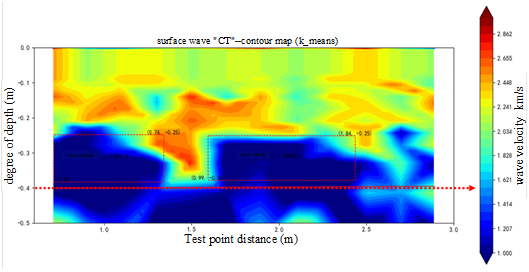
The test results are shown in Figure 17 to Figure 18 below, of which Figure 17 has no obvious abnormality in the uniform wave velocity of concrete surface wave, and there are two obvious abnormalities in Figure 18, which are judged as concrete defects with a depth of about 30cm.
The location of defects using impact echo sound frequency method for verification, the results are shown in Figure 19, the figure can be seen in two defects (boxed), the defect location with the surface wave CT results are basically the same.
The first defect was verified by drilling holes on site, and the verification result was that the concrete was not compacted 30cm down the lining, which was consistent with the test result.
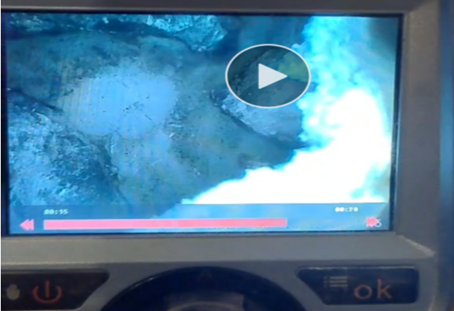
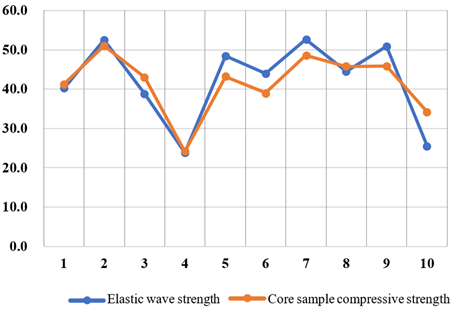
The results of coring and ballasting and the results of surface wave strength measurement are shown in Figure 20 below.
Comprehensive view of the surface wave CT method to detect defects in the thickness of the results are more intuitive, and at the same time can be quickly detected on-site concrete strength (see Figure 21 for details).
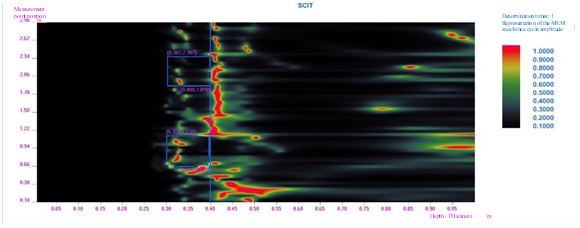
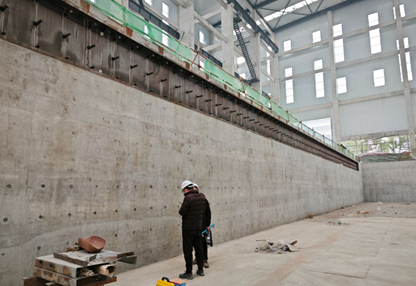
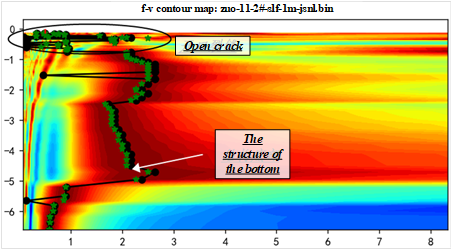
A university disaster prevention and mitigation experimental platform during the construction of the wall cracks, the wall design thickness of 4.5m, in order to determine the depth of the cracks and the quality of the concrete inside the wall, the surface wave CT method for experimental testing (see Figure 22).
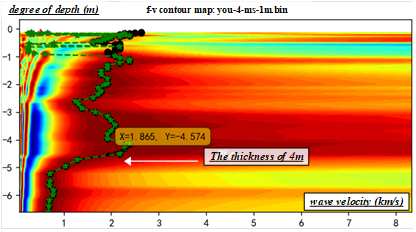
The surface wave signal at the measurement point is analyzed by f-v dispersion curve superposition method, and the dispersion curve is shown in Figure 23 below.
From the dispersion curve, it can be seen that there is an obvious demarcation at about 4.5m (corresponding to the design value), and the wave velocity value of the shallow concrete surface wave at the open crack is obviously reduced, and the measured depth of the crack is about 0.8m, and the results of the later coring verification are basically the same as the detection value.
Through the finite element simulation test verification, concrete model and field verification, it is proved that our proposed new method of concrete face wave inspection (face wave CT method) can accurately detect the internal defects of concrete structure and concrete strength, and it has the advantages of wide inspection range, intuitive results, high testing efficiency, etc. The effective testing depth is more than 4m, and by replacing the lower frequency hammer, it can theoretically achieve a deeper testing depth. The effective testing depth is more than 4.5m, and by replacing the lower-frequency vibration hammer, it can theoretically realize a deeper testing depth, with a wide range of application prospects.
At the same time, it should be pointed out that at present, the application cases of surface wave CT technology are relatively few, and its detection ability and application range still need further experimental verification.
This research is supported by the Open Research Fund Project of the Key Laboratory of Water Engineering Materials, Ministry of Water Resources (Grant No. EMF202409).