
Accounting audit is an important part of corporate governance, and its quality directly affects the quality of decision-making, credibility and operational efficiency of enterprises. With the development and application of big data technology, accounting auditing has entered a new stage of development [10,4,23,19]. The introduction of big data not only provides rich and detailed data for accounting auditing and improves the audit precision, but also improves the audit efficiency through big data analyzing tools, which enables the auditors to comprehensively audit the enterprises from more perspectives; however, the improvement of the quality of accounting auditing in the big data environment also faces some new challenges [22,17,18,8]. Therefore, the investigation of internal accounting audit quality improvement in enterprises under big data environment has important theoretical and practical significance.
In the traditional auditing environment, auditors often need to rely on a small amount of sampling data for auditing. This method may lead to inaccurate audit results due to sample selection bias or sampling error [1,14,16,15]. However, with the development of big data technology. Auditors can now analyze all data, not just sampling data, and the big data environment provides auditors with access to the full amount of enterprise data, including various transaction data, account data, business data, etc., which provides auditors with a comprehensive audit perspective and greatly enhances the accuracy of the audit [7,9,13,6]. In addition, big data technology also provides a variety of complex data analysis methods, which can help auditors identify abnormal patterns from massive data and reveal possible financial problems [3,20,21]. Therefore, big data technology can help auditors find and assess financial risks more accurately and improve the accuracy of auditing.
In the big data environment, auditors can quickly process and analyze large amounts of data with the help of big data processing and analysis tools [11,2,12]. With big data analysis tools, auditors can automate the processing and analysis of massive data, saving a lot of manual auditing time. In this way, auditors can devote more time and energy to higher-level audit work, such as the development of audit strategy and the interpretation of audit results. In addition, under the big data environment, auditors can monitor the financial status of enterprises in real time, and discover and deal with financial problems in a timely manner [5]. This real-time auditing method can not only greatly improve the efficiency of auditing, but also timely detect and prevent financial risks. Therefore, the efficiency of the auditing work has been improved under the big data environment.
This study uses big data technology to collect, process and mine the data of accounting audit, improves the quality of accounting audit based on the objectives of strengthening the service level of accounting audit, enhancing the management level of accounting audit business as well as enhancing the competitiveness of the accounting market, and builds an overall framework for the optimization of audit quality. Meanwhile, since audit risk assessment is also an important part of accounting audit management quality improvement, the study establishes an audit risk assessment evaluation index system and assigns subjective and objective weights to the risk indicators through hierarchical analysis and entropy weighting method respectively. On this basis, Company Z is selected as the research object, and after establishing the accounting audit risk comment set, the fuzzy comprehensive evaluation method is utilized to make a comprehensive assessment of the accounting audit risk of the company. Finally, with audit subject, object and environment as independent variables and audit risk as dependent variable, the regression model of audit risk impact is established to explore the optimal strategy of accounting management risk control.
The application of big data technology in the field of auditing has a good prospect, which provides the possibility of realizing the supervision of the whole process of auditing. Big data technology can break through the limitations of time and space to a certain extent, optimize the existing audit process of accounting, and then improve the quality of audit.
Auditing huge amount of data has been a challenge that accountants have to face in order to conduct audits. Figure 1 shows the application framework of big data technology in auditing. The collection of unstructured data such as web pages is imperative in order to uncover audit trails in greater depth and reduce audit risk. This requires auditors to comprehensively carry out data collection on websites and social networks related to the audited units. The audited unit often browses web forums and often uses microblogging and WeChat. For the collection of unstructured data, traditional methods have been difficult to cope with. Therefore, auditors need to master the use of big data technology and apply it to the preliminary data collection work, especially the collection of unstructured data. The use of web crawlers to automatically collect unstructured data on the web and so on. With the support of big data technology, the pre-audit data collection work becomes more convenient, and the scope of data collection can also be expanded.
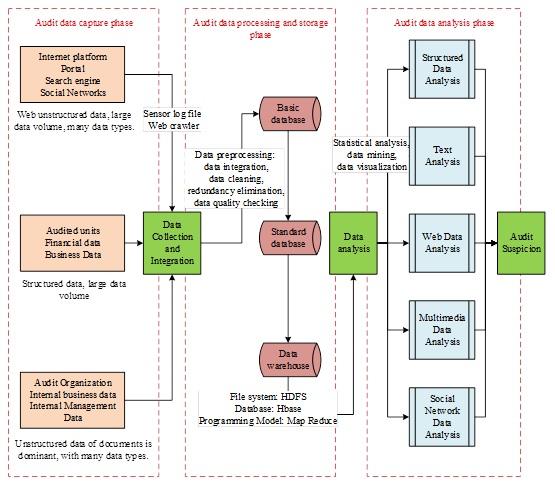
Once the data collection process is complete, the data needs to be simply pre-processed. This is because the data collected by the auditors in the early stages is large and varied in structure, and most of that data cannot be directly analyzed to find audit evidence. Therefore, the collected data needs to be screened and cleaned to remove repetitive and contradictory useless data. The use of computer-assisted auditing sampling methods first cluster analysis of the relevant data, the data is divided into a number of large classes, if the cluster observation of a time does not reach a similar normal distribution, then continue to divide to a satisfactory level. Then determine the sample and the capacity of the sample, such as this with the help of computer-assisted auditing not only saves manpower and resources, but also improves the efficiency of the audit.
When machine learning is used as an auxiliary means of auditing, the information and data of the audited unit can be input into the machine by professionals, and the machine receives the relevant information and applies preset procedures to assist in the auditing work. Compared with traditional manual auditing, machine learning assisted manual auditing can significantly save costs, and through the method of comprehensive consideration of multiple sets of data to exclude the subjective and one-sided impact of manual auditing, but also quickly find out the audited unit’s abnormal behavior, for the entire audit process are facilitated.
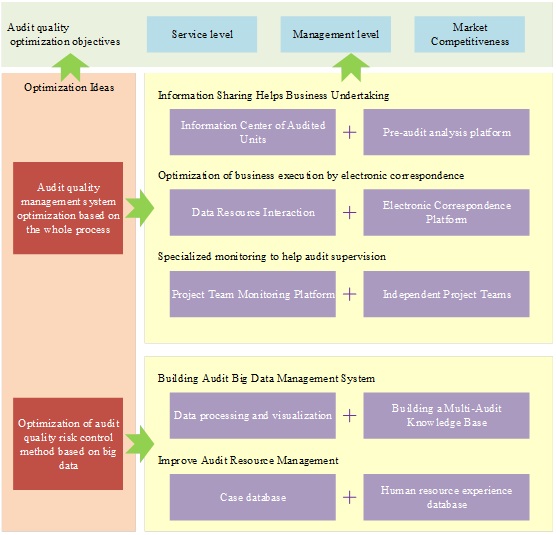
Based on the problems and reasons in the current audit quality of accountants, the objective of optimizing the quality of accounting audits is established. First, strengthen the level of accounting audit services, improve the completeness of the accounting audit evidence obtained and the accuracy of the analysis, and promote the development of accounting from big to strong to high quality. Second, enhance the management level of accounting audit business, improve the audit quality management system according to the importance mainly from the level of business undertaking and execution, supervision and control, and prevent the risk of material misstatement and fraud of the audited company. Third, enhance the competitiveness of the accounting market. We endeavor to strengthen the industry’s reputation by virtue of high-quality audits, and take the lead as a leading domestic firm to become a benchmark of integrity and consolidate the industry’s position while promoting the steady development of the economy.
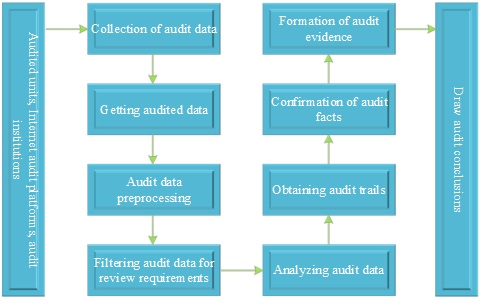
In the preparation stage of the audit, since it is the starting point of the audit, whether or not the preparatory work can be done adequately will have a certain impact on the outcome of the project. The preparation stage of the audit operation mainly includes two tasks: the development of the audit plan and the assignment of work. The work is carried out based on the relevant content of the audit work in the context of big data, which is shown in Figure 2. Auditors need to develop an audit work plan based on the assessment of the risk of the audited unit, after its acceptance of the project, the subject of the audit began to be based on the information investigated, the manager of the project based on the previously assessed audit risk to develop a specific and detailed audit plan, the focus of the audit plan generally includes the field of internal auditing of the enterprise, the specific arrangements for the auditor. Also specifically assigned the appropriate time budget, economic budget and other issues.
Based on the three objectives and two ideas of audit quality optimization, the overall framework for designing accounting audit quality optimization is shown in Figure 3. Although the optimization plan revolves around the two main dimensions of business undertaking and execution, supervision and control, due to the interconnectedness and closeness of the auditing work itself, it actually also covers the contents of related professional ethics, business working papers, information and communication. In the optimization of audit quality management system based on the whole process, through the establishment of information sharing center and platform, it helps auditors understand the audited unit more fully, and effectively promotes “information and communication”. In the optimization of audit quality risk control method based on big data, through the construction of big data management system and improvement of audit resource management, it has standardized the audit format, avoided major risks, and also ensured the quality of “operational working papers” to a greater extent. In the whole optimization process, through the empowerment of big data and other technologies, we can realize the truthfulness and reliability of the audit evidence as far as possible and not violate the laws and regulations, and have a strong constraint on the “relevant professional ethics” of the auditors.
In the audit assessment, the large number of data assessment problems are well solved, but it also brings data privacy issues. In practice, the supervision and management mechanism are introduced to ensure the security of the audit.
The system of audit risk evaluation indicators is eliminated by combining the literature and standards. Audit risk model: audit risk = risk of material misstatement x inspection risk, which divides audit risk into risk of material misstatement and inspection risk, and is now commonly used by the auditing practice in assessing audit risk. This paper combines the literature and auditing standards to provide a more accurate understanding of the definition and connotation of accounting management audit risk, adding factors such as strategic risk and operational risk to audit risk as well, and setting up an audit risk evaluation index system. Table 1 shows the accounting management risk evaluation index system, which mainly focuses on two aspects of material misstatement risk and inspection risk, and includes a total of external environment C1, nature of the audited unit C2, selection and application of accounting policies C3, target strategy of the audited unit C4, internal control of the audited unit C5, financial performance measurements and evaluations C6, related-party transactions C7, sampling risk C8, non-sampling risk C9 9 secondary indicators, and 27 tertiary indicators.
| Primary indicator | Secondary indicator | Tertiary indicator |
| Major misreporting risk M1 | External environment N1 | Macroeconomic status U1 |
| Industry policyU2 | ||
| Regulatory environment U3 | ||
| Audit unit nature N2 | Ownership structure U4 | |
| Governance structure U5 | ||
| Organizational structure U6 | ||
| Investment activity U7 | ||
| Financing activity U8 | ||
| Business activities U9 | ||
| The choice and application of accounting policy N3 | Change in accounting policy U10 | |
| Adopt new accounting standards U11 | ||
| Audit unit target strategy N4 | The target of the audit unit U12 | |
| The strategy of the audit unit U13 | ||
| Audit unit internal control N5 | Control environment U14 | |
| Risk assessment process U15 | ||
| Information and communication U16 | ||
| Control activity U17 | ||
| Supervise the control of U18 | ||
| Financial performance measurement and evaluation N6 | Solvency U19 | |
| Profitability U20 | ||
| Operating ability U21 | ||
| Development ability U22 | ||
| Related party trading N7 | Related party trading U23 | |
| Check risk M2 | Sampling risk N8 | Practice environment U24 |
| The quality control of the firm U25 | ||
| Audit method U26 | ||
| Non-sampling risk N9 | Professional ethics of auditors U27 |
Hierarchical analysis in the process of analyzing the problem, the core idea is to put the relatively complex problem through the identification of risk factors constitute a risk evaluation of the hierarchical structure of the map, and then through any risk indicators for two by two comparisons of the way to build risk indicators to determine the relative importance of each analytical indicators of the judgment matrix, and then through the calculation of the data and combined with the expert’s scores to find out all the analytical variables factors of the weight, to provide management with the necessary decision-making. The weights of all analyzed variables are then calculated and combined with the scores of experts to provide the necessary basis for management’s decision-making. Because of its simple calculation process and obvious decision-making basis, it is the most widely used method for determining weights.
It can be divided into the following four steps:
1. Decompose the relationship between the variables in the system according to the different attributes of the identified factors, and construct a hierarchical structure chart.
2. In the hierarchical structure diagram, the judgment matrix is constructed according to the affiliation of factors, and there are generally the following two cases:
(a) If the importance of each of the influencing factors of \(U1,U2,…,Un\) to the criterion level can be quantified, then the weight of the risk factor can be determined directly.
(b) If it is not possible to quantify directly, it can only be done by the two-by-two comparison method for criterion \(C\), element \(u_{i}\) and the construction of judgment matrix, \[A=\left[\begin{array}{cccc} {a_{11} } & {a_{12} } & {\ldots } & {a_{1n} } \\ {a_{21} } & {a_{22} } & {\ldots } & {a_{2n} } \\ {\ldots } & {\ldots } & {\ldots } & {\ldots } \\ {a_{n1} } & {a_{n2} } & {\ldots } & {a_{nn} } \end{array}\right]=A\left(a_{ij} \right),\] \(A\) is called judgment matrix.
3. By constructing the judgment matrix, the relative weights of the factors in the guideline layer can be calculated by using the least squares method, the eigenvalue method, and other computational methods.
4. Finally, the final weights of the aggregated system goals are calculated and their matrices are tested for consistency with the random consistency index RI.
Entropy weight method is mainly used to determine the critical value of the critical data of the system disorder program and the size of the information of the judgment value, the size of the entropy value and the amount of information provided inversely proportional to determine the order and effectiveness of the information. Its specific calculation steps are as follows:
1. Entropy weight method to determine the weight coefficient: Assuming that there are \(m\) evaluation objects and \(n\) evaluation indicators for each evaluation object, construct judgment matrix \(R\): \[\label{GrindEQ__1_} R=\left(r_{st} \right)_{m*n} ,\qquad \text{for }s=1,2,\ldots \ldots .m\text{ and }t=1,2,\ldots ..n, \tag{1}\] where \(r_{st}\) is the measured value of the \(t\)rd evaluation index of the \(s\)nd evaluation object.
2. Normalization of judgment matrix \(R\): The constructed judgment matrix \(R\) is normalized, and the elements of the obtained normalization matrix \(B\), \(B\) are: \[\label{GrindEQ__2_} b_{st} =\frac{r_{st} -r_{\min } }{r_{\max } -r_{\min } } , \tag{2}\] where, \(r_{\max }\), \(r_{\min }\) denote the specific values of the most satisfied and the least satisfied people in different things under one evaluation index, respectively.
3. Define the entropy of each evaluation index: According to the definition of traditional entropy can be expressed the entropy of each evaluation index as: \[\label{GrindEQ__3_} H_{t} =-{\left(\sum _{s=1}^{m}f_{st} Inff_{st} \right)\mathord{\left/ {\vphantom {\left(\sum _{s=1}^{m}f_{st} Inff_{st} \right) Inn}} \right. } Inn} ,\qquad\text{for } s=1,2,\ldots ,m \text{ and } t=1,2,\ldots ,n, \tag{3}\] where \(f_{st} ={b_{st} \mathord{\left/ {\vphantom {b_{st} \sum _{t=1}^{n}b_{st} }} \right. } \sum _{t=1}^{n}b_{st} }\). When \(f_{st} =0\), \(Inf_{st}\) has no meaning, so it is necessary to modify \(f_{st}\)’s and define it as: \[\label{GrindEQ__4_} f_{st} ={\left(1+b_{st} \right)\mathord{\left/ {\vphantom {\left(1+b_{st} \right) \sum _{t=1}^{n}\left(1+b_{st} \right) }} \right. } \sum _{t=1}^{n}\left(1+b_{st} \right) } . \tag{4}\]
Calculate the entropy weight of each indicator: \[\label{GrindEQ__5_} \omega _{t} ={\left(\sum _{k=1}^{n}H_{k} +1-2H_{t} \right)\mathord{\left/ {\vphantom {\left(\sum _{k=1}^{n}H_{k} +1-2H_{t} \right) \sum _{t=1}^{n}\left(\sum _{k=1}^{n}H_{k} +1-2H_{t} \right) }} \right. } \sum _{t=1}^{n}\left(\sum _{k=1}^{n}H_{k} +1-2H_{t} \right) } ;\qquad W=\left(\omega _{t} \right)_{1\times n} , \tag{5}\] and satisfy \(\sum _{t=1}^{n}\omega _{t} =1\).
In order to make up for the insufficiency of subjective and objective assignment when obtaining the weights, therefore, this paper combines the subjective weights obtained by AHP with the objective weights calculated through entropy weight method through the combined assignment method based on game theory, so as to obtain the comprehensive weights of accounting audit risk evaluation indexes. The specific algorithm is as follows:
\(\omega _{k} =\left(\omega _{1} ,\omega _{2} \right)\), \(\left(k=1,2\right)\) can be applied, from which a basic weight \(\omega\) can be obtained, then the linear combination of the \(L\) weight vectors is expressed as: \[\label{GrindEQ__6_} \omega =\sum _{k=1}^{L}a_{k} \bullet \omega _{k}^{T} ,\left(a_{k} >0\right). \tag{6}\]
In order to obtain the weight vector \(\omega ^{*}\) that best fits this risk, the coefficients \(a_{k}\) of the linear combination must be optimized to ensure, as much as possible, that the deviation of \(\omega\) from each \(\omega _{{\rm k}}\) is extremely small, from which the response model can be derived: \[\label{GrindEQ__7_} \min \left\| \sum _{k=1}^{2}a_{k} \omega _{k}^{T} -\omega _{k} \right\| _{2} ,\qquad \text{for } k=1,2 . \tag{7}\]
Then, according to the differential nature of the matrix, the optimized first-order derivative condition of Eq. (7) can be derived as: \[\label{GrindEQ__8_} \omega =\sum _{k=1}^{2}a_{k} \omega _{k} \omega _{k}^{T} =\omega _{k} \omega _{k}^{T} . \tag{8}\]
From the Eq. (8), \(\left(a_{1} ,a_{2} \right)\) can be obtained and then it is normalized by the following equation to get the composite weight vector \(\omega ^{*}\) given by this share: \[\label{GrindEQ__9_} a_{k}^{*} ={a_{k} \mathord{\left/ {\vphantom {a_{k} \sum _{k=1}^{2}a_{k} }} \right. } \sum _{k=1}^{2}a_{k} } ;\omega ^{*} =\sum _{k=1}^{L}a_{k} \omega _{k}^{T} . \tag{9}\]
In this paper, the probability of the risk indicator of the identified risk is calculated by the fuzzy comprehensive evaluation model, and the ahp method and the law of entropy are the main calculation of the weight of the risk index, and the weight relationship is achieved by the objective means such as the subjective means and the combination of the power method. However, the probability of each level of risk is used in the calculation of the final total risk, so that the fuzzy comprehensive evaluation model can be introduced in the process, and the probability of the previous level of risk event is obtained by applying the fuzzy comprehensive evaluation model. Finally, the second person is able to solve the risk of the whole risk project, and can complete the task successfully, and the result is accurate than the single method.
The rubric set in the fuzzy comprehensive judgment method is a linguistic description of the evaluation indicators at each level, which is the rubric given by the reviewer for each evaluation indicator to determine the set of states of each indicator in the factor set of the evaluation indicator, and \(V=\left\{V_{1} ,V_{2} ,V_{3} ,\cdots ,V_{k} \right\}\), \(V_{k}\) represent different risk probabilities or loss levels. In corporate accounting and auditing risk assessment, \(V\) is usually categorized into 5 levels \(\left(k=5\right)\). The specific set of rubrics is: \[\label{GrindEQ__10_} V=\left\{V_{1} ,V_{2} ,V_{3} ,\cdots ,V_{k} \right\}=\left\{lower,{\rm \; }low,{\rm \; }medium,{\rm \; }high,{\rm \; }very{\rm \; }high\right\} . \tag{10}\]
At the same time, in most cases, in order to obtain the final results of risk evaluation, it is necessary to consider a combination of risk probability level and risk loss level. The weight set is a collection that indicates the importance of each level of risk indicators in each level of indicator factor set. The method of weight determination, for different evaluation problems, on the basis of comprehensive analysis combined with experience, this paper will use the hierarchical analysis method (AHP) and entropy weighting method to establish a judgment matrix by comparing the importance of evaluation indexes in pairs, and then solve the method of solving the eigenvalues of the matrix, and finally need to test the consistency of the logic of the above judgment.
By comparing the importance of different indicator factors at the same level of corporate accounting and auditing risk through expert surveys, a two-by-two comparative judgment matrix is constructed, which reflects the degree of importance between each of the two indicator factors within the same set of indicator factors. For example, the comparison judgment matrix \(A\) for the second-level indicator set \(U_{e}\) is: \[\label{GrindEQ__11_} A=\left[\begin{array}{cccc} {a_{11} } & {a_{12} } & {\cdots } & {a_{n} } \\ {a_{21} } & {a_{22} } & {\cdots } & {a_{n} } \\ {\vdots } & {\vdots } & {\vdots } & {\vdots } \\ {a_{n1} } & {a_{n2} } & {\cdots } & {a_{nn} } \end{array}\right]^{2} , \tag{11}\] where, \(a_{ij}\) for \(i=1,2,3,\cdots ,n\) and \(j=1,2,3,\cdots ,n\) are the importance of indicator factor \(U_{ei}\) relative to \(U_{ej}\), where \(e=1,2,3,\cdots ,m\). There are many numerical scales used for two-by-two comparisons in existing studies and each has its own advantages and disadvantages, and in this paper we use the 9 scale to obtain \(a_{ij}\).
After obtaining the comparison judgment matrix, the maximum eigenvalue \(\lambda _{\max }\) of the comparison judgment matrix \(A\) and its corresponding eigenvector are calculated by MATLAB, and the vector is normalized to obtain the weight vector \(W_{e} =\left(w_{e1} ,w_{e2} ,w_{e3} ,\cdots ,w_{en} \right)^{T}\).
The weight set \(W\) of the first-level indicator set \(U\) can be obtained by the same method, and for some specific hierarchical structures, the weights of the first-level indicators can also be specified directly by expert survey opinions.
For most of the accounting audit risk analysis issues, the indicator factors are often difficult to quantify, in the evaluation of the evaluation index system in the second level of each element of the single-factor evaluation, the specific approach can be used in the form of a questionnaire survey, through the results of the survey results of the collation, statistics, to get a single-factor fuzzy judging matrix.
First of all, the single factor \(u_{i} \left(i=1,2,3,\cdots ,n\right)\) of the set of factors to focus on the single-factor judgment, from the factor \(u_{i}\) to focus on the matter of choice level \(v_{j} \left(j=1,2,3,\cdots ,k\right)\) of the degree of affiliation of \(r_{ij}\), so that the \(i\)th factor \(u_{i}\) of the single-factor set of judgments: \(r_{i} =\left(r_{1} ,r_{12} ,\cdots ,r_{ik} \right)\).
Thus, the evaluation set of \(n\) factors constructs a total judgment matrix \(R\), i.e., each evaluated object determines a fuzzy relationship \(R\) from \(U\) to \(V\), which is a matrix: \[\label{GrindEQ__12_} R=\left(r_{ij} \right)_{nkk} =\left[\begin{array}{cccc} {r_{11} } & {r_{12} } & {\cdots } & {r_{k} } \\ {r_{21} } & {r_{22} } & {\cdots } & {r_{k} } \\ {\vdots } & {\vdots } & {\vdots } & {\vdots } \\ {r_{n1} } & {r_{n2} } & {\cdots } & {r_{nk} } \end{array}\right]\qquad\text{for }i=1,2,\cdots ,n\text{ and }j=1,2,\cdots ,k. \tag{12}\] where \(r_{ij}\) denotes the degree of affiliation of the rubric that is rated \(v_{j}\) in terms of factor \(u_{i}\). Specifically, \(r_{ij}\) represents the frequency distribution of the \(i\)th factor, \(u_{i}\), over the \(j\)th rating, \(v_{j}\), which is generally normalized to satisfy \(\Sigma r_{ij} =1\). In this way, the \(R\) array itself is dimensionless and does not require special treatment.
Multi-level comprehensive evaluation is the process of calculating the evaluation set of each level from the bottom level to the target level based on the obtained fuzzy judgment matrix and weight set, and finally obtaining the risk estimation results of the target indicators.
1. Comprehensive judgment of second-level indicators: From the second-level indicator weight set \(A_{i}\) and fuzzy judgment matrix \(R_{i}\), the second-level indicator evaluation set \(B_{i}\) can be obtained, i.e., \[\begin{aligned} \label{GrindEQ__13_} B{_{i} } {=} & A_{i} \circ R_{i}\notag\\ =&\left(a_{in} ,a_{i2} ,a_{i3} ,\cdots ,a_{in} \right)\circ \left[\begin{array}{cccc} {r_{11} } & {r_{12} } & {\cdots } & {r_{1k} } \\ {r_{21} } & {r_{22} } & {\cdots } & {r_{2k} } \\ {\vdots } & {\vdots } & {\vdots } & {\vdots } \\ {r_{n1} } & {r_{n2} } & {\cdots } & {r_{nk} } \end{array}\right] \notag\\ {=} & {\left(b_{i1} ,b_{i2} ,\cdots ,b_{ik} \right)} ,\qquad\text{ for } {i} ={1,2,3,\cdots ,m}, \end{aligned} \tag{13}\] where, \(\circ\) is the fuzzy operator. There are many types of operators in fuzzy mathematics, in this paper, Zadeh operator is used for accounting audit risk assessment, which is determined by the main factor, i.e., \(M(\wedge ,\vee )\), which highlights the influence of the main factor and ignores other secondary factors, i.e., \[\label{GrindEQ__14_} \begin{array}{l} {b_{ij} =\vee _{j=1}^{n} \left(a_{ij} \wedge r_{je} \right)},\qquad\text{for } {i=1,2,3,\cdots ,m\text{ and } j=1,2,3,\cdots ,n;e=1,2,3,\cdots ,k} .\end{array} \tag{14}\]
2. Comprehensive judgment of first-level indicators: From the evaluation set of second-level indicators \(B_{i}\), the fuzzy judgment matrix of first-level indicators \(R\) can be obtained, i.e., \[\label{GrindEQ__15_} R=\left[\begin{array}{c} {B_{1} } \\ {B_{2} } \\ {\vdots } \\ {B_{m} } \end{array}\right]=\left[\begin{array}{c} {A_{1} {}^\circ R_{1} } \\ {A_{2} {}^\circ R_{2} } \\ {\vdots } \\ {A_{m} {}^\circ R_{m} } \end{array}\right]=\left[r_{ij} \right]_{m\times k} . \tag{15}\]
Considering the set of primary indicator weights \(A\), the set of primary indicator judgments \(B\) can be obtained. i.e: \[\label{GrindEQ__16_} B=A\circ R=\left(w_{1} ,w_{2} ,\cdots ,w_{m} \right)\circ \left[\begin{array}{c} {B_{1} } \\ {B_{2} } \\ {\vdots } \\ {B_{m} } \end{array}\right]=\left(b_{1} ,b_{2} ,\cdots ,b_{k} \right) . \tag{16}\]
3. Comprehensive judgment of target indicators: In view of the complexity of the actual accounting audit risk, the hierarchical model may have more than one intermediate layer, according to the above steps from the bottom to the upper layer layer by layer to judge, can be obtained from the evaluation set \(B\), from the evaluation set \(V\) scoring interval mid-value of the rating set \(G=\left(0.1,0.3,0.5,0.6,0.9\right)\), can be obtained from the target indicator \(U\) of the risk estimation results of the \(D\) as: \[\label{GrindEQ__17_} D=B\cdot G^{T} =\left(b_{1} ,b_{2} ,\cdots ,b_{k} \right)\cdot \left(g_{1} ,g_{2} ,\cdots ,g_{k} \right)^{T} . \tag{17}\]
In 1990, Z Company, which mainly wholesales and retails air conditioners and other home appliances, was founded in Nanjing, Jiangsu Province. In July 2004, Z Company was listed on the Shenzhen Stock Exchange, becoming the first home appliance chain to be publicly listed and traded under the stock code of 002024. 2020 Home Appliances Industry Report data shows that in 2020, Z Company’s marketing model of on-line and off-line full-scene coverage gained a 23.8% market share, and remained the first among all channel formats. In March 2012, the chairman of Z Company openly proposed that Z Company should become China’s “Walmart + Amazon” and realize the O2O business model.At the end of 2017, with the release of the “Intelligent Retail Development Strategy”, Z Company formally stepped into the field of new retail. In 2018, the transformation of Z Company’s full-scene Internet retail model was basically completed, accompanied by huge business risks.
In 2021, due to operational difficulties and liquidity risks, Company Z conducted an equity transfer in order to absorb capital to bring in strategic investors. After experiencing the collapse of the equity transfer plan with Shenzhen International and Kunpeng Capital, Company Z announced on July 6, 2021 that it would transfer the aggregate number of shares held by the Company, representing 16.96% of the total share capital of the listed company, to New New Retail Fund II. After the completion of this share transfer, Z Company was in a state of no controlling shareholder and no actual controller, and the board of directors and its committee members underwent a major turnover. The newly appointed management did not bring significant improvement to Z Company’s operating conditions, and the 2021 earnings forecast shows that Z Company expects to lose RMB42.3-43.3 billion in 2021, with a sharp deterioration in its profitability position and a risk to its continued operation.
A questionnaire was prepared on the basis of the above indicator system and company cases. The questionnaires were distributed to 20 people including experts, companies and accounting auditors, and all of them were returned after completion. Finally, SPSS 24.0 software was used to analyze the data of the questionnaire results to ensure the reasonableness of the questionnaire. In this paper, the reliability and validity of the questionnaire were tested.
1. Reliability test: The credibility of the questionnaire is expressed in terms of reliability to ensure that the statistical results of the questionnaire are meaningful, and the degree of acceptability must be within the acceptable range. This paper applies the Alpha reliability coefficient method, which is to analyze the usability of the questionnaire according to the size of the coefficient of reliability. The judgmental norms are: an Alpha coefficient value of (0.80, 0.90) indicates that the reliability of the questionnaire is quite good, a coefficient value of (0.70, 0.80) is good, a coefficient value of (0.65, 0.70) is considered to be acceptable, and a value of less than 0.65 indicates that the questionnaire should be discarded. Since the indicator level can fully cover the risk factors of accounting audit, the three levels of indicators of accounting audit are now analyzed by questionnaire reliability test, and Table 2 shows the results of the reliability test of the evaluation indicator system. The Alpha coefficient of the total indicator system is 0.875, indicating that the reliability of the indicator system is still good, as can be seen from the system of the indicators, the minimum value of the Clonbach Alpha coefficient is 0.839, and the maximum value is 0.899, which are all in the acceptable range, which concludes that the evaluation of the indicator system’s reliability is better, and it verifies the reliability of the evaluation indicator system.
| Item | The standard of the scale after deleting | The variance of the scale after deleting the item | The revised terms are associated with the total | Multiple correlation | Cloning Bach alpha after deletion |
| U1 | 32.016 | 54.144 | 0.717 | 0.943 | 0.882 |
| U2 | 32.381 | 74.515 | 0.651 | 0.943 | 0.854 |
| U3 | 32.184 | 59.174 | 0.735 | 0.959 | 0.839 |
| U4 | 32.689 | 56.076 | 0.658 | 0.913 | 0.871 |
| U5 | 31.483 | 74.264 | 0.651 | 0.952 | 0.854 |
| U6 | 32.504 | 64.224 | 0.65 | 0.998 | 0.864 |
| U7 | 32.778 | 53.97 | 0.778 | 0.95 | 0.882 |
| U8 | 31.116 | 59.513 | 0.573 | 0.978 | 0.864 |
| U9 | 32.975 | 54.454 | 0.683 | 0.913 | 0.889 |
| U10 | 31.894 | 72.365 | 0.559 | 0.914 | 0.893 |
| U11 | 31.404 | 67.926 | 0.543 | 0.974 | 0.874 |
| U12 | 32.264 | 55.717 | 0.703 | 0.905 | 0.857 |
| U13 | 32.031 | 60.574 | 0.504 | 0.918 | 0.899 |
| U14 | 31.865 | 66.354 | 0.607 | 0.947 | 0.859 |
| U15 | 32.217 | 60.725 | 0.574 | 0.914 | 0.882 |
| U16 | 32.816 | 55.985 | 0.643 | 0.907 | 0.868 |
| U17 | 32.532 | 56.422 | 0.626 | 0.958 | 0.872 |
| U18 | 32.037 | 57.619 | 0.656 | 0.936 | 0.876 |
| U19 | 31.102 | 67.12 | 0.681 | 0.922 | 0.883 |
| U20 | 32.922 | 52.289 | 0.592 | 0.986 | 0.872 |
| U21 | 32.876 | 60.508 | 0.62 | 0.984 | 0.865 |
| U22 | 31.293 | 65.128 | 0.63 | 0.988 | 0.893 |
| U23 | 32.299 | 66.161 | 0.659 | 0.983 | 0.873 |
| U24 | 31.104 | 62.638 | 0.641 | 0.923 | 0.897 |
| U25 | 31.332 | 60.602 | 0.61 | 0.993 | 0.854 |
| U26 | 31.897 | 66.983 | 0.557 | 0.948 | 0.891 |
| U27 | 32.649 | 61.197 | 0.656 | 0.966 | 0.897 |
| Total (27) | 0.875 | ||||
2. Validity test: KMO is the Kaiser-Meyer-Olkin coefficient of sampling appropriateness with a value range of (0, 1). When the value of KMO is larger (when it is closer to 1), it is more suitable for factor analysis, and the net correlation coefficient between variables is lower. Table 3 shows the results of KMO and Bartlett’s test. Among them, the KMO value is 0.886, P = 0.000, then it is considered to meet the criteria of good characteristics, which verifies the effectiveness of the enterprise accounting audit risk assessment index system.
| KMO sampling availability number | 0.886 | |
| Bartlett sphericity test | Approximate card | 1757.882 |
| Freedom | 82 | |
| Significance | 0.000 | |
Utilizing the combination indicator assignment method in the previous 3.2 to carry out the combination assignment for the accounting audit risk indicator system, 10 certified public accountants are selected as the expert group, of which 8 of them have the position of auditor and senior auditor, one of them has the position of audit project manager, and there is one senior manager. Using the questionnaire star system, the link of evaluation is sent to the members of the expert group, and then the questionnaire is recovered, and statistics are made on the evaluation results of the experts, and then the entropy value is calculated by using entropy weighting method, and the combination of the accounting audit risk evaluation index system is assigned. Table 4 shows the final weights of the audit risk system evaluation index system. From the weight of the first-level indicator system can be seen that the importance of material misstatement risk (0.4752) is slightly less than the importance of inspection risk (0.5248), indicating that both are equally important in accounting risk management. From the second-level indicators the financial performance measurement and evaluation (0.1928) and related party transactions (0.1856) in the risk of material misstatement account for a larger proportion, and the importance of non-sampling risk (0.6648) in the inspection risk is higher than that of non-sampling risk (0.3352). Profitability, as an ability of the enterprise to earn profits through reasonable operation, has a relative weight of 0.0621 in the three-level index, which is the most important, and confirms the rationality of this paper’s construction of the evaluation index system from the side.
| Primary indicator | Weight | Secondary indicator | Weight | Tertiary indicator | Weight | Relative weight |
| M1 | 0.4752 | N1 | 0.1512 | U1 | 0.3559 | 0.0323 |
| U2 | 0.2281 | 0.0432 | ||||
| U3 | 0.4160 | 0.0434 | ||||
| N2 | 0.1528 | U4 | 0.2255 | 0.0228 | ||
| U5 | 0.2162 | 0.0449 | ||||
| U6 | 0.1158 | 0.0432 | ||||
| U7 | 0.0568 | 0.0524 | ||||
| U8 | 0.2145 | 0.0237 | ||||
| U9 | 0.1712 | 0.0486 | ||||
| N3 | 0.1098 | U10 | 0.4456 | 0.0321 | ||
| U11 | 0.5544 | 0.0239 | ||||
| N4 | 0.0722 | U12 | 0.4965 | 0.0321 | ||
| U13 | 0.5035 | 0.0511 | ||||
| N5 | 0.1356 | U14 | 0.2265 | 0.0233 | ||
| U15 | 0.2528 | 0.0341 | ||||
| U16 | 0.1814 | 0.0482 | ||||
| U17 | 0.1578 | 0.0438 | ||||
| U18 | 0.1815 | 0.0232 | ||||
| N6 | 0.1928 | U19 | 0.2201 | 0.0237 | ||
| U20 | 0.1876 | 0.0621 | ||||
| U21 | 0.2148 | 0.0356 | ||||
| U22 | 0.2775 | 0.0421 | ||||
| N7 | 0.1856 | U23 | 1 | 0.0356 | ||
| M2 | 0.5248 | N8 | 0.6648 | U24 | 0.3132 | 0.0352 |
| U25 | 0.2889 | 0.0221 | ||||
| U26 | 0.3979 | 0.0451 | ||||
| N9 | 0.3352 | U27 | 1 | 0.0322 |
The bottom-to-top analysis was used to assess the accounting audit risk of Company Z. Table 5 shows the risk assessment results for each of the three levels of evaluation indicators. Analyzing from the three-level indicator level, based on the principle of maximum affiliation, there are 10, 10, 4, 2, and 1 indicators in each three-level indicator that are at lower risk, low risk, medium risk, high risk, and very high risk, respectively, and a total of 74.1% of the indicators are in the status of lower risk and low risk of accounting audit. Among them, the company’s change in accounting policy (0.66) and strategy (0.59) are at high risk, which indicates that the company’s accounting policy and strategy are currently ambiguous and have a high risk of causing an accounting audit. The probability of the company’s control activities being at very high risk is 0.52, which indicates that the company’s activities are inefficiently controlled, giving rise to the risk of an accounting audit.
| Index | Lower | Low | Medium | Height | Sky-high |
| Macroeconomic status U1 | 0.81 | 0.23 | 0.15 | 0.29 | 0.37 |
| Industry policyU2 | 0.67 | 0.21 | 0.37 | 0.19 | 0.31 |
| Regulatory environment U3 | 0.38 | 0.78 | 0.27 | 0.4 | 0.36 |
| Ownership structure U4 | 0.35 | 0.72 | 0.21 | 0.25 | 0.29 |
| Governance structure U5 | 0.65 | 0.32 | 0.31 | 0.12 | 0.29 |
| Organizational structure U6 | 0.23 | 0.25 | 0.61 | 0.32 | 0.12 |
| Investment activity U7 | 0.53 | 0.63 | 0.42 | 0.19 | 0.19 |
| Financing activity U8 | 0.27 | 0.82 | 0.15 | 0.21 | 0.24 |
| Business activities U9 | 0.36 | 0.54 | 0.24 | 0.13 | 0.11 |
| Change in accounting policy U10 | 0.76 | 0.72 | 0.19 | 0.66 | 0.16 |
| Adopt new accounting standards U11 | 0.81 | 0.33 | 0.31 | 0.21 | 0.36 |
| The target of the audit unit U12 | 0.78 | 0.26 | 0.26 | 0.22 | 0.22 |
| The strategy of the audit unit U13 | 0.35 | 0.32 | 0.31 | 0.59 | 0.13 |
| Control environment U14 | 0.25 | 0.21 | 0.74 | 0.23 | 0.37 |
| Risk assessment process U15 | 0.68 | 0.56 | 0.4 | 0.21 | 0.26 |
| Information and communication U16 | 0.39 | 0.57 | 0.62 | 0.2 | 0.32 |
| Control activity U17 | 0.27 | 0.26 | 0.31 | 0.21 | 0.52 |
| Supervise the control of U18 | 0.37 | 0.81 | 0.31 | 0.17 | 0.18 |
| Solvency U19 | 0.57 | 0.78 | 0.25 | 0.29 | 0.2 |
| Profitability U20 | 0.78 | 0.41 | 0.31 | 0.34 | 0.41 |
| Operating ability U21 | 0.61 | 0.22 | 0.27 | 0.16 | 0.34 |
| Development ability U22 | 0.72 | 0.34 | 0.32 | 0.16 | 0.13 |
| Related party trading U23 | 0.75 | 0.32 | 0.14 | 0.36 | 0.24 |
| Practice environment U24 | 0.23 | 0.88 | 0.29 | 0.19 | 0.11 |
| The quality control of the firm U25 | 0.29 | 0.82 | 0.29 | 0.22 | 0.18 |
| Audit method U26 | 0.16 | 0.29 | 0.48 | 0.25 | 0.33 |
| Professional ethics of auditors U27 | 0.31 | 0.64 | 0.24 | 0.41 | 0.19 |
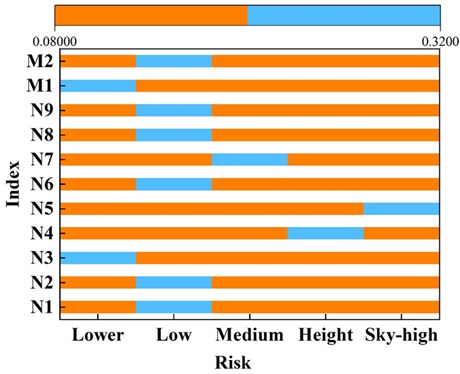
Next, the risk indices for the secondary and primary indicators are performed, and Figure 4 shows the company’s scores for the secondary and primary indicators. The overall evaluation of the risk of material misstatement is M1 = (0.33, 0.16, 0.19, 0.17, 0.15), which indicates that the company’s risk of material misstatement has a degree of affiliation of 32.8%, 15.8%, 19.4%, 16.7%, and 15.3% for the Very Low, Low, Medium, High, and Very High. According to the maximum affiliation principle, the risk of material misstatement of the enterprise should be assessed as “low”. According to the principle of mean value, the total probability of risk of material misstatement, P1=M1*(0.1, 0.3, 0.5, 0.7, 0.9)=0.33, is between 0.3 and 0.5, which indicates that the risk of material misstatement of the company is between low and average. The expected comprehensive evaluation of audit risk is S = (0.212, 0.305, 0.313, 0.108, 0.052), which indicates that the company’s audit risk affiliation to very low, low, moderate, high, and very high is 21.2%, 30.5%, 31.3%, 10.8%, and 5.2%, in that order. According to the principle of maximum affiliation, the expected audit risk of the enterprise should be assessed as “average”. According to the principle of mean value, the total probability of expected audit risk, P1 = M1 * (0.1, 0.3, 0.5, 0.7, 0.9) = 0.412, is between 0.3 and 0.5, which indicates that the audit risk of the company is between low and average.
Based on the above results, the accounting firm can choose whether to accept Company Z as a client. This method can also be used in the audit planning stage to determine the acceptable level of audit risk before applying this method to determine the level of risk of material misstatement, which is known from the audit risk model: acceptable inspection risk = audit risk level / level of risk of material misstatement, thus determining the acceptable inspection risk.
According to the previous analysis, both the risk of material misstatement and inspection risk will have a certain impact on audit risk, inspection risk and risk of material misstatement from the audit subject and audit object level audit environment. In order to verify the audit subject, audit object level upgrade environment on the impact of audit risk, this paper uses the relevant regression analysis, Table 6 for the accounting management risk impact regression analysis model. The audit subject includes the previous year’s audit opinion (Opint-1), firm size (Scale), audit fees (LnFee). Audit object includes the first largest shareholder’s shareholding (Top1), board size (Board), the proportion of independent know-how (Indrate), business growth rate (Growth), net profit (Loss), the growth rate of selling expenses (Sgrowth), gross profit margin (Gir), and the proportion of inventory (Inv). The audit environment is (Native). The control variables are gearing (Lev), firm size (Size), and cash flow (CFO).
Model 1 is the effect of audit subject on the audit risk of accounting management, there is a significant negative correlation between the previous year’s audit opinion and the current year’s audit risk, and there is a significant positive correlation between the audit fee and the type of audit opinion, i.e., there is a significant negative correlation between the type of audit opinion of the previous year and the audit risk, and there is a significant positive correlation between the audit fee and the audit risk. Among them, the correlation coefficient of the type of audit opinion in the previous year is -3.522, which is significantly negatively correlated at the 1% level, and the correlation coefficient of the audit fee is 0.887, and it is significantly positively correlated at the 1% level, so the audit opinion in the previous year and the size of the audit firm both affect the audit risk.
Model 2 shows the impact of audit object on audit risk of accounting management, the proportion of shares held by the largest shareholder, the size of the board of directors, the proportion of independent directors, the growth rate of operating income, net profit and audit risk are significantly negatively correlated, i.e., the proportion of shares held by the largest shareholder, the size of the board of directors, the proportion of independent directors, the growth rate of operating income, the net profit and the audit risk have a significant negative correlation. Among them, the coefficient of the proportion of shares held by the largest shareholder is -0.828, which is significantly negatively correlated at the 5% level, and the coefficient of the size of the board of directors is -1.152, which is significantly negatively correlated at the 1% level. The coefficient of the proportion of independent directors is -0.887, which is significantly negatively correlated at the 1% level, the coefficient of the growth rate of operating income is -1.196, which is significantly negatively correlated at the 5% level, and the coefficient of the net profit is -2.032, which is significantly standing at the 1% level. The correlation between other indicators and audit risk is not significant.
Model III is the effect of audit environment on accounting management audit risk, the audit environment and accounting audit risk is a significant positive correlation, that is, the negative network public opinion and audit risk is a significant positive correlation, the correlation coefficient is 1.356, significant correlation at the 1% level, that is, the audit environment will affect the audit risk.
| Variable | Model 1 | Model 2 | Model 3 | |||
| B | Wald | B | Wald | B | Wald | |
| Opint-1 | -3.522 | 35.442** | ||||
| Scale | 0.288 | 0.356 | ||||
| LnFee | 0.887 | 5.825* | ||||
| Top1 | -0.828 | 4.662* | ||||
| Board | -1.152 | 11.285** | ||||
| Indrate | -0.887 | 7.256** | ||||
| Growth | -1.196 | 5.15* | ||||
| Loss | -2.032 | 15.105** | ||||
| Sgrowth | 0.662 | 3.695 | ||||
| Gir | 0.045 | 0.021 | ||||
| Inv | 0.211 | 1.554 | ||||
| Native | 1.356 | 33.668** | ||||
| Lev | 0.882 | 12.285** | 0.888 | 15.221** | 1.212 | 24.385** |
| Size | -0.998 | 8.523** | -0.868 | 11.728** | -1.159 | 25.168** |
| CFO | -9.125 | 6.526* | -1.726 | 13.665** | -1.662 | 20.227** |
With the increasing development and improvement of the Internet and big data technology, the CPA can obtain more information about the audited unit by new technical means, and it is easier to obtain some information and information that the company intentionally hides, the more audit evidence the CPA obtains in the audit, the higher the quality of the audit report, and therefore the easier it is to issue non-standard audit opinions based on the real situation. Therefore, it is also easier to issue non-standard audit opinions based on the real situation, and thus its audit risk is also higher.
This section proposes strategies related to corporate accounting and auditing risk control by combining big data technology from the two aspects of audit quality and risk, namely, material misstatement risk and inspection risk.
The traditional way of collecting audit evidence can no longer meet the needs of big data auditing, so it is necessary to change the traditional method of collecting audit evidence. First of all, in the process of designing and developing audit software, the caliber of access is unified and standardized, so that the audit data information provided by the audited unit can be quickly input into the audit software through the access, which saves the time of inputting audit data and improves the efficiency of the audit. Second, pay attention to the timeliness of audit data. It is necessary to strictly examine whether the audit data submitted by the audited unit is up-to-date and valid, and the auditors should always check the account information provided by the audited unit. Finally, the accounting firm should strengthen the communication and contact with the audited unit, and strengthen the communication and exchange with the staff of the audited unit, so as to obtain first-hand accurate audit data new.
Many enterprises have widely used big data information technology in their various fields, which has increased the difficulty of big data auditing work. Accounting firms want to occupy a place in the audit industry must recruit a large number of people with big data expertise, but also increase the investment in staff big data training, in order to improve the overall level and quality of audit, reduce the probability of audit risk.
Auditors in the process of carrying out audit work will be used to a huge amount of audit data information, much of this data will involve the core secrets of the enterprise, and even the stability and security of the country and the social economy, so in the audit process must attach great importance to the confidentiality of audit data.
In this paper, after exploring the enterprise accounting management system in the big data environment, the accounting audit risk assessment index system is constructed, and after assigning weights to the audit risk assessment indexes, Company Z is taken as an example to explore the degree of its audit risk, and then use this to analyze the influence factors of accounting audit.
The comprehensive evaluation of the expected audit risk of the sample company is S = (0.212, 0.305, 0.313, 0.108, 0.052), and its expected audit risk should be assessed as “general”. According to the principle of mean value, the total probability of expected audit risk is 0.412, which is between 0.3 and 0.5, indicating that the audit risk of the company is between low and average. Audit risk is affected by the audit object’s previous year’s audit opinion and the size of the audit firm. Audit object’s shareholding ratio of the largest shareholder, board of directors’ size, proportion of independent directors, operating income growth rate, and net profit affect audit risk, and audit environment also affects audit risk.
Therefore, the quality of corporate accounting audits can be improved and the accounting audit risk reduced by improving the method of obtaining audit evidence, recruiting and cultivating specialized auditing talents, and strengthening the attention to the security of audit data.