
Alzheimer’s disease (AD) is the most common form of dementia globally and is predominantly observed in individuals aged \(\geq\) 60 years. As age progresses, neurodegeneration in the brain intensifies, leading to worsening symptoms. Although medications and treatments are available to alleviate these symptoms, no complete cure currently exists. With the aging population on the rise, AD is expected to affect a significant portion of the global population. Therefore, the early detection of AD using advancements in machine learning and artificial intelligence has become a critical area of research. This study aims to address this challenge by proposing an approach for the early detection of dementia using multimodal data.
Experts agree that early diagnosis of AD significantly increases the chances of mitigating its progression and improving patient quality of life. In this regard, various machine learning algorithms were employed and compared in this work to identify the most accurate method for detecting AD in its early stages.
The human brain, being the control center of the body, plays a vital role in regulating all sensory and cognitive functions. It processes, stores, and manages information, enabling communication, motor coordination, and interaction with the environment. With advancing age, cognitive decline becomes more prominent, often resulting in debilitating conditions such as dementia.
It is estimated that over 47 million individuals are currently living with dementia, making it a global health crisis. AD, the most prevalent cause of dementia, leads to gradual memory loss and cognitive impairment, thereby affecting the ability to perform daily activities. It is one of the leading causes of death among the elderly and is ranked as the sixth most common cause of mortality worldwide. While multiple factors may contribute to the onset of this disease, genetic predisposition plays a significant role. Despite extensive research, the root cause of AD remains elusive, and no definitive cure has been found to date [13].
Given these circumstances, early detection is essential to delay disease progression and enhance patient outcomes. This study presents a comprehensive framework utilizing machine learning techniques for the classification and early identification of Alzheimer’s disease. The effectiveness of the proposed system is evaluated using standard metrics such as accuracy and precision.
Numerous frameworks leveraging deep learning techniques have been proposed for the automated fusion of multimodal medical images to facilitate the detection of Alzheimer’s disease (AD). Framework A utilizes a convolutional neural network (CNN)-based architecture for image fusion, combining structural and functional information from magnetic resonance imaging (MRI) and positron emission tomography (PET) scans. While this approach effectively integrates multimodal data, its generalizability is limited due to its specific architectural design.
Framework B incorporates generative adversarial networks (GANs) to generate realistic fused images by learning representations from multiple imaging modalities. The generator network captures shared information, and the discriminator ensures image fidelity. This strategy improves AD detection accuracy by synthesizing high-quality fused images. However, the training process is computationally intensive and requires careful calibration of the input data quality.
Framework C adopts a feature-level fusion approach that extracts deep features from individual modalities using parallel CNNs, followed by integration via operations such as concatenation, summation, or attention mechanisms. This framework enables flexible feature representation and captures complementary modality-specific information but requires significant computational resources and design optimization.
Another variation, also referred to as Framework C, employs a hierarchical fusion strategy, progressively merging low-level features and refining them at higher semantic levels. This enables the extraction of both local and global information, thereby enhancing classification performance. Nonetheless, hierarchical fusion entails extended training time and increased computational demand.
Deep learning has shown considerable promise in AD diagnosis. Several studies have explored supervised, unsupervised, and semi-supervised learning, as well as architectures such as recurrent neural networks (RNNs), graph neural networks (GNNs), and generative models.
One study employed custom models and deep transfer learning techniques with five-fold cross-validation, achieving 99.65% accuracy [8]. The models included a two-layer fully connected network and pretrained architectures such as EfficientNet-B3 and ResNet-152.
In another investigation, CNNs were employed using LeNet-5 architecture for binary classification of AD-affected and healthy brains [25]. The CNN-based approach demonstrated superior accuracy in differentiating between these groups.
The use of 3D CNNs for AD diagnosis yielded a classification accuracy of 78.07% [26], while other studies proposed models based on MobileNet, artificial neural networks (ANNs), and DenseNet using MRI data, with MobileNet achieving an accuracy of 95.41% [3].
A lightweight model for MRI-based AD detection reached 99.22% accuracy for binary classification and 95.93% for multiclass classification tasks [16]. The evaluation was conducted using F1-score, recall, and precision.
A hybrid deep learning approach combining long short-term memory (LSTM) with CNNs achieved 92.8% test accuracy, and an area under the curve (AUC) ranging from 0.80 to 0.83, effectively distinguishing between normal controls and early mild cognitive impairment (MCI) [2].
Other studies have compared models such as VGG-19, Xception, and DenseNet-121, which reported accuracies of 98%, 95%, and 91% respectively [6].
“MultiAZ-Net”, a CNN-based ensemble architecture, incorporated MRI and PET scans for AD classification, achieving an accuracy of 92.3 \(\pm\) 5.45% for multiclass classification [14].
A deep neural network (DNN) using PET and MRI data classified six binary classes of AD stages and showed that combining PET and MRI led to improved sensitivity for early classification [7]. Similarly, in another study, features extracted from MRI and PET scans were classified using support vector machines (SVMs), particularly improving classification performance for late and early MCI [10].
The fusion of multimodal data has been extensively utilized in medical diagnosis. For example, multimodal fusion of T1, T2, T1CE, and FLAIR MRI images has been used for brain tumor identification [12, 1, 15]. Other studies combined MRI with CT and SPECT to form composite feature spaces [19, 17, 9].
Recent advancements include attention-based multimodal fusion networks, where PET and MRI data are jointly processed to extract salient features while filtering out irrelevant information [28]. Even in the absence of one modality, pretrained models can still predict AD using learned complementary information.
Shao et al. [22] proposed combining SVMs with feature correlation and structure-based fusion methods. Their results showed improved classification, particularly in distinguishing between late and early MCI, and suggested further improvements for binary classification using advanced fusion techniques.
These studies collectively highlight the growing potential of deep learning and multimodal fusion strategies in enhancing the accuracy and reliability of Alzheimer’s disease diagnosis.
Neuroimaging fusion algorithms are designed to improve the accuracy and reliability of Alzheimer’s disease (AD) detection by integrating information from multiple imaging modalities such as magnetic resonance imaging (MRI), positron emission tomography (PET), and diffusion tensor imaging (DTI). This section provides a comparative analysis of single-modality and multimodal approaches used in neuroimaging-based AD diagnostics.
Detection models based solely on MRI data have demonstrated a moderate level of accuracy, sensitivity, and specificity in diagnosing AD [27]. However, MRI may be limited in capturing metabolic or molecular alterations that are more effectively visualized through other imaging modalities.
PET imaging, which is effective in identifying metabolic activity and amyloid deposition, also yields reliable performance metrics. Nevertheless, its inability to provide detailed structural information may hinder comprehensive diagnosis.
DTI primarily focuses on assessing white matter integrity and neural connectivity. While useful, a DTI-only framework may fail to account for other structural or functional abnormalities relevant to AD progression.
The multimodal fusion strategy seeks to leverage the strengths of multiple imaging techniques to enhance AD diagnostic accuracy. By integrating data from MRI, PET, fMRI, and DTI, these approaches provide a more holistic representation of AD-associated brain alterations. Multimodal fusion enables the extraction of complementary signals and mitigates the limitations of individual modalities.
Several fusion techniques are commonly employed in this context:
Involves the integration of features extracted from different modalities before classification, allowing for joint representation learning.
Combines the outputs of individual classifiers trained on separate modalities, aggregating their predictions for final diagnosis.
Utilizes neural network architectures capable of learning complex, nonlinear relationships across modalities to improve classification performance.
The multimodal fusion methods have demonstrated superior diagnostic performance compared to single-modality approaches, offering a more comprehensive framework for early and accurate detection of Alzheimer’s disease.
The abbreviations are given below in Table 1.
| Abbreviations | Meaning |
|---|---|
| AD | Alzheimer’s disease |
| PET | Positron Emission Tomography |
| MRI | Magnetic Resonance Imaging |
| SPECT | Single-Photon Emission Computed Tomography |
| DTI | Diffusion Tensor Imaging |
| fMRI | Functional Magnetic Resonance Imaging |
| CNNs | Convolutional Neural Networks |
| GAN | Generative Adversarial Network |
| ANN | Artificial Neural Networks |
| ROC | Receiver Operating Curve |
| MCI | Mild Cognitive Impairment |
| LSTM | Long Short-Term Memory |
| DNN | Deep Neural Network |
| SVM | Support Vector Machine |
| RNN | Recurrent Neural Network |
| AUC-ROC | Area Under the Receiver Operating Characteristic curve |
| FFT | Fast Fourier Transform |
| NSDFB | Non-Subsampled Directional Filter Banks |
| NSP | Non-Subsampled Pyramid |
| DFT | Discrete Fourier Transform |
| IFFT | Inverse FFT |
| PCNN | Pulse-Coupled Neural Network |
| CN | Cognitively Normal |
| MCI | Mild Cognitive Impairment |
| LMCI | Late MCI |
| EMCI | Early MCI |
| SMC | Significant Memory Concern |
| FGPCNN | Fuzzy Genetic Pulse Coupled Neural Networks |
| ADNI | The Alzheimer’s Disease Neuroimaging Initiative |
| RNN | Recurrent Neural Network |
Alzheimer’s Disease (AD) is a complex neurological disorder that impacts various aspects of brain functionality. Single-modality imaging techniques often fail to capture the multifaceted nature of AD. Each imaging modality provides only a partial view of the disease, which may not be sufficient for accurate early diagnosis and prognosis [11, 2, 21, 23, 18, 4]. Therefore, a multimodal approach is essential to obtain a more comprehensive representation of the pathological changes associated with AD.
Common neuroimaging modalities used in AD detection include:
MRI: Detects structural abnormalities such as atrophy and vascular malformations.
PET: Assesses metabolic activity and functional characteristics of brain tissue.
fMRI: Measures blood oxygen level-dependent (BOLD) signals to examine functional connectivity between brain regions.
DTI: Captures microstructural white matter alterations by modeling water diffusion along axonal tracts.
When these modalities are integrated, they enable detection of:
Structural and functional brain changes.
Disruption in white matter connectivity.
Amyloid-beta plaque accumulation.
Regional cerebral hypometabolism.
The proposed fusion approach algorithm is presented in Table 2.
| Step | Process | Description |
| Transform | Contourlet + FFT | Apply Contourlet and FFT transforms to extract directional and frequency domain features from each image modality. |
| Feature Selection Fusion | PCNN + Fuzzy Maximization | Use PCNN to identify salient features across modalities, and apply fuzzy maximization to enhance feature integration and generate a unified representation. |
| Reconstruction Save | Inverse FFT + Contourlet | Reconstruct the fused image using inverse FFT and Contourlet transforms, then store the final fused output in the image database. |
The proposed multimodal fusion framework enhances sensitivity and specificity by combining complementary features from diverse modalities. The following sequential steps summarize the methodology:
Data Acquisition: Neuroimaging data (MRI, PET, DTI) from AD patients and healthy controls were collected under standardized acquisition protocols.
Preprocessing: Spatial alignment, skull stripping, intensity normalization, and noise removal were performed to ensure uniformity across modalities.
Feature Extraction: Critical features including voxel intensities, texture descriptors, shape-based statistics, and connectivity metrics were extracted.
Fusion Algorithm: Feature-level fusion was implemented using a combination of Contourlet and Fast Fourier Transforms (FFT), followed by feature selection via Pulse-Coupled Neural Networks (PCNN) and fuzzy maximization.
Model Training and Testing: Deep learning classifiers such as Convolutional Neural Networks (CNNs) and Recurrent Neural Networks (RNNs) were trained using the fused feature representations. Cross-validation was performed using labeled data.
Performance Evaluation: Accuracy, sensitivity, specificity, precision, and area under the ROC curve (AUC) were used to evaluate model performance.
Comparative Analysis: The performance of the multimodal fusion framework was compared with individual modality results to demonstrate its effectiveness.
The fusion algorithm described above ensures accurate and comprehensive feature representation through multistage processing. The workflow of the proposed model is depicted in Figure 1.
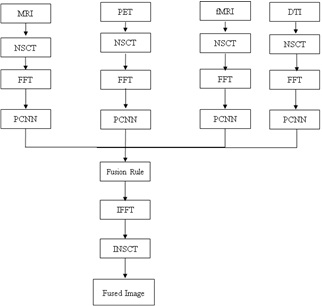
This is the first step in the proposed fusion algorithm. First, the source images that required fusion were collected. These images can be obtained using different sensors or modalities. In our study, MRI, functional MRI, DTI, and PET were combined to improve the accuracy of AD detection. The NSCT is then applied to decompose each source image into sub-bands of different frequency sub-bands. NSCT [4] is a multiscale, multi directional transform that captures local and nonlocal image features. The NSCT consists of two components:
A two-channel non-subsampled 2-D filter bank is called a non-subsampled pyramid. Using the NSP, a multiscale characteristic was obtained. The NSP structure for the three-stage pyramid decomposition and the sub-bands generated on a two-dimensional frequency plane are shown in Figure 2.
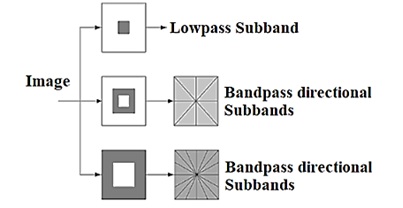
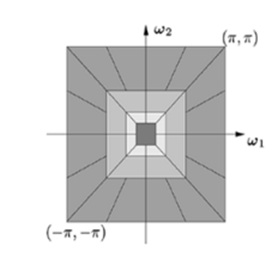
One Low-frequency and one high-frequency image were obtained for each decomposition level. To capture the singularities in a picture efficiently, low-frequency components were decomposed at the subsequent decomposition level. Consequently, NSP may produce “\(k + 1\)” sub images, where “\(k\)” is the number of decomposition levels and consists of one low frequency image and \(k\) high frequency images. The size of the sub images is comparable to that of the input source image. The Figure 2a & b shows the NSCT filter bank structure and Frequency partitioning using NSCT structure respectively.
Two-channel filter banks that have been critically sampled and a resampling operator are used to create a Nonsubsampled directional filter bank. By employing the NSDFB, the NSCT can achieve multidirectional properties and additional directional information. In addition, the design of the NSDFB removes the up samplers and down samplers from the contourlet-transform DFB. Every “\(k\)” level undergoes directional decomposition, yielding “\(2^k\)” directional sub-bands that are about the same size as the original images. A four-channel non-subsampled directional filter bank with two-channel fan filter banks is shown in the Figure. The 2-D frequency plane is divided into wedge-shaped sections by the tree-structured filter bank.
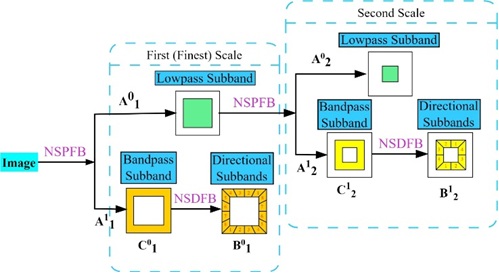
Multiscale decomposition involves the application of a low-pass filter (h) and high-pass filter (g) at each scale. The low-pass filter captures the approximation or smoother components, whereas the high-pass filter captures the detailed or edge features.
\[A_{j+1}^{0} = (h * A_{j}^{0}) \downarrow 2 + (h * A_{j}^{1}) \downarrow 2,\] \[A_{j+1}^{1} = (g * A_{j}^{0}) \downarrow 2 + (g * A_{j}^{1}) \downarrow 2,\] where \(A_{j}^{0}\) and \(A_{j}^{1}\) represent the approximation and detail coefficients at scale \(j\), \(*\) denotes convolution, and \(\downarrow 2\) represents downsampling by a factor of two.
Directional decomposition involves applying directional filters \(h_{l,k}\) and \(g_{l,k}\) at each scale and orientation \(k\). \[B_{j+1}^{0,k} = (h_{l,k} * B_{j}^{0}) \downarrow 2 + (h_{l,k} * B_{j}^{1}) \downarrow 2,\] \[B_{j+1}^{1,k} = (g_{l,k} * B_{j}^{0}) \downarrow 2 + (g_{l,k} * B_{j}^{1}) \downarrow 2,\] where \(B_{j}^{0}\) and \(B_{j}^{1}\) represent the directional approximation and detail coefficients at scale \(j\) and orientation \(k\). Figure 3 shows the input and output relationship of decompositions.
The sub-band decomposition involves further decomposition into sub-bands \(C_{j,l}^{d,k}\), where \(d\) represents the direction and \(k\) represents the orientation. \[C_{j,l}^{0,k} = (h_{l,k} * C_{j}^{0,k}) \downarrow 2 + (h_{l,k} * C_{j}^{1,k}) \downarrow 2,\] \[C_{j,l}^{1,k} = (g_{l,k} * C_{j}^{0,k}) \downarrow 2 + (g_{l,k} * C_{j}^{1,k}) \downarrow 2,\] where \(C_{j}^{0,k}\) and \(C_{j}^{1,k}\) represent the sub-band approximation and detail coefficients at scale \(j\) and orientation \(k\). These equations illustrate the NSCT decomposition process, capturing the hierarchical structure of the coefficients at different scales, directions, and subbands. Specific filter functions \(h_{l,k}\) and \(g_{l,k}\) are designed.
The resulting coefficients were organized into a hierarchical structure, forming a tree-like representation. The coefficients at different scales, directions, and sub-bands are denoted as \(Y_{j,l}^{d,k}\), where \(j\) represents the scale, \(l\) represents the direction, \(d\) represents the approximation or detail, and \(k\) represents the orientation. \[Y_{j,l}^{d,k} = \begin{cases} A_{j}^{d} & \text{if } j = 0, \\ B_{j}^{d,k} & \text{if } j > 0 \text{ and } l = 0, \\ C_{j,l}^{d,k} & \text{if } j > 0 \text{ and } l > 0. \end{cases}\]
Inverse NSCT involves reconstructing the original Image \(\hat{I}\) from its coefficients, \(Y_{j,l}^{d,k}\). It combines information from different scales, directions, and subbands. \[\hat{I} = INSCT\left(Y_{j,l}^{d,k}\right).\]
The inverse transform process combines approximation and detailed information to reconstruct the original image.
FFT is an algorithm used to efficiently compute the DFT. One of the most common formulations is the Cooley-Tukey Radix-2 algorithm. For simplicity, let us consider the case where \(N\) is a power of two.
\[X[k] = \sum_{n=0}^{N-1}x[n] \cdot W_N^{kn},\] where \(W_N = e^{-j\left(\dfrac{2\pi}{N}\right)}\) is the twiddle factor, and the Cooley-Tukey algorithm recursively breaks down the DFT computation into smaller DFTs until it reaches the base case of 2-point DFTs. Combined with factorization, this recursive decomposition significantly reduces the number of calculations compared with the direct computation of the DFT.
Inverse FFT transforms the frequency-domain representation back into a time-domain representation. For an \(N\)-point sequence \(X[k]\), the IFFT is given by
\[x[n] = \dfrac{1}{N} \sum_{k=0}^{N-1} X[k] \cdot e^{j \left(\dfrac{2\pi}{N}\right)kn}.\]
A normalization factor \(\dfrac{1}{N}\) ensures that the IFFT operation is consistent with the Fourier Transform definition.
A PCNN is a type of neural network inspired by synchronization behavior observed in the visual system of the brain. It operates based on the principle of pulse synchronization and has been applied to various image-processing tasks because of its ability to capture complex spatial relationships. In MRI fusion, the PCNN extracts the features from the input images. The network’s ability to synchronize pulses among connected neurons makes it suitable for identifying the relevant image features and patterns.
The PCNN consists of interconnected neurons that fire pulses in response to specific features in input images. Neurons exhibit synchronization when exposed to similar features. The network has linking strength and inhibition parameters that influence its behavior.
\[\begin{aligned} F_{ij}[n] =& e^{-\alpha_F}F_{ij}[n-1] + V_F \sum_{K,l}W_{i,j,K,l}Y_{ij}[n-1] + S_{ij},\\ L_{ij}[n] =& e^{-\alpha_L}L_{ij}[n-1] + V_L \sum_{K,l}M_{i,j,K,l}Y_{ij}[n-1],\\ U_{ij}[n] =& F_{ij}[n]\left(1 + \beta L_{ij}[n]\right),\\ T_{ij}[n] =& e^{-\alpha_T}T_{ij}[n-1] + V_TY_{ij}[n-1],\\ Y_{ij}[n] =& \begin{cases} 1, & \text{if } U_{ij}[n] > T_{ij}[n] ,\\ 0, & \text{otherwise}, \end{cases}\\ F(u,v) =& \left(\sum_{x=0}^{N-1}\sum_{y=0}^{M-1} T(x,y) \cdot e^{-2\pi i(ux/N + vy/M)}\right)'. \end{aligned}\]
For image fusion, the PCNN extracts features from different modalities. The network is exposed [24] to the input images and neuron fire pulses in response to features such as edges, textures, or other distinctive patterns.
Synchronized pulses from the PCNN were used to formulate fusion rules. These rules may involve combining information from different modalities based on synchronized features identified by the network.
The features extracted by the PCNN are integrated into the overall fusion process. Synchronized pulses may influence the selection of the relevant information from each modality to be included in the fused image.
We define fuzzy rules by combining the information from different modalities. Consider the pixel intensities \(T_{1ij}\) and \(T_{2ij}\) at the exact spatial locations \(i,j\) in the T1-weighted and T2-weighted images.
Rule 1: If \(\mu_{A}(T_{1ij})\) and \(\mu_{B}(T_{2ij})\), then \(F_{ij} = C\)
where \(\mu_{A}(T_{1ij})\) and \(\mu_{B}(T_{2ij})\) are the membership degrees of \(T_{1ij}\) and \(T_{2ij}\) in fuzzy sets \(A\) and \(B\), and \(F_{ij}\) is the fused intensity at locations \(i,j\).
Membership functions for fuzzy sets A, B, and C are defined here. For example, represent low, medium, and high intensities, respectively.
\[\mu_{A}(x) = \begin{cases} \dfrac{(x – x_{low})}{(x_{medium} – x_{low})}, & \text{if } x_{low} \leq x \leq x_{medium}, \\ 1, & \text{if } x_{medium} < x \leq x_{high}, \\ 0, & \text{otherwise}. \end{cases}\]
By combining the membership degrees using fuzzy logic operators, we consider the antecedent part of the rule
\[\text{Degree of activation} = \min \left( \mu_{A}(T_{1ij}), \mu_{B}(T_{2ij}) \right).\]
The fuzzy outputs were combined to obtain a crisp result. For example, using the centroid defuzzification method,
\[F_{ij} = \dfrac{\sum \text{Universe of discourse } x \times \text{Degree of membership}}{\sum \text{Universe of discourse Degree of membership}}.\]
Reconstruct the fused Image by assigning the de-fuzzified values to the corresponding spatial locations.
\[\text{Fused Image } (i,j) = F_{ij}.\]
In this study, ADNI is used as a dataset for the proposed fusion approach. ADNI 3 was launched in 2003 as a public-private partnership led by Principal Investigator Michael W. Weiner, MD. The primary goal of ADNI is to test whether serial magnetic resonance imaging (MRI), positron emission tomography (PET), other biological markers, and clinical and neuropsychological assessments can be combined to measure the progression of CN, MCI, EMCI, LMCI, SMC, and AD. This study used 250 samples from each multimodal image including MRI, PET, fMRI, and DT1. A total of 1000 image samples were used for the image-fusion approach.
The results of the FGPCNN algorithm [] by considering the fusion of MRI, PET, fMRI, and DTI Images: These used to apply the FGPCNN algorithm to the multimodal fusion framework. This section describes the accuracy, sensitivity, and specificity of the proposed FGPCNN model.
In this study, ADNI is used. ADNI is a multisite study that aims to improve clinical trials for the prevention and treatment of AD. This cooperative study combines expertise and funding from the private and public sectors to study subjects with AD, as well as those who may develop AD, and controls with no signs of cognitive impairment. ADNI researchers collect, validate, and utilize data including MRI, fMRI, PET, and DTI images. MRI can detect blood flow and vascular malformation. PET images allow doctors to view not only the structure of the brain but also its functions.
| Test cases | Multi modality dataset | |
|---|---|---|
| No of training images | No of test images | |
| MRI | 250 | 250 |
| PET | 250 | 250 |
| fMRI | 250 | 250 |
| DTI | 250 | 250 |
| Fused | 1000 | 1000 |
fMRI provides a measure of changes in blood oxygen levels and functional connectivity between different brain regions. DTI provides a representation of the white matter fiber bundles in the brain. This study used 250 samples from each multi modality images including MRI, PET, fMRI, and DTI. A total of 1000 image samples were used for the image-fusion approach. Table 3 shows the data considerations.
a. Data Preparation: Pre-processing techniques, such as noise reduction, intensity normalization, spatial registration, and skull stripping, were applied to MRI, PET, fMRI, and DTI images. These processed images were used as the inputs for the FGPCNN algorithm.
b. Training: A labeled dataset of patients with AD and healthy controls was used to train the FGPCNN algorithm. The system learns to extract pertinent information from multimodal images and makes predictions by using these features. During training, methods such as gradient descent and backpropagation optimize network parameters.
c. Testing: A different testing dataset is used to gauge the efficacy of the trained FGPCNN algorithm for AD detection. The predicted labels were compared to the ground-truth labels of the testing dataset to determine the accuracy, sensitivity, and specificity of the algorithm.
d. Performance Evaluation: The performance of the FGPCNN algorithm was evaluated using common evaluation criteria. The metrics are:
Accuracy: The percentage of healthy controls and AD patients accurately classified.
The sensitivity, called the true positive rate, is the capacity of the algorithm to accurately identify patients.
Specificity: The capacity of the algorithm to accurately identify healthy controls is also referred to as the true-negative rate. Tables 4-6 show the parameter settings of NSCT, FFT, and PCNN, respectively.
| Parameter | Values |
|---|---|
| Decomposition levels (L) | 3 |
| Directional decomposition levels (N) | Laplacian pyramid |
| Filter bank length | 8 |
| Filter bank parameters | zero-padding |
| Boundary handling | 2 |
| Down sampling factor | threshold=0.1, method=soft threshold |
| Thresholding parameters | True |
| Normalization | linear |
| Interpolation method | Laplacian pyramid |
| Parameter | Values |
|---|---|
| Windowing Function | rectangular window |
| Zero-padding | Power of 2 |
| FFT Algorithm | Radix-2 FFT |
| Scaling | 1/N |
| Filter Size | 5×5 |
| Border Handling | Zero-padding |
| Parameter | Values |
|---|---|
| Thresholds | 0.02 |
| Connection Weights | 0.04 |
| Neuron Types | Excitatory |
| Pulse Parameters | 0.05 |
| Inhibition Parameters | 0.05 |
| Integration Time | 0.03 |
| Spatial Neighborhood Size | 2 |
| Time Neighborhood Size | 4 |
| Iterations | 100 |
| Boundary Conditions | Periodic |
| Activation Function | Sigmoid function |
| Initialization | Zero initialization |
| Learning Rate | 0.03 |
Figures 4-7 show the performances of the FGPCNN Algorithm when considering MRI, PET, fMRI, and DTI images, respectively. Figure 8 shows the FGPCNN Algorithm Results obtained by considering the fused images. Here, the fused image performance is demonstrated by considering different classifiers such as SVM, Bag, Naïve Bayes, KNN, Adaboost, ELM, CNN, and FGPCNN algorithms.
The findings of the FGPCNN algorithm demonstrate the success of the multimodal fusion framework in detecting AD. Compared with single-modality methods, the algorithm obtains improved accuracy, sensitivity, and specificity, demonstrating its capacity to extract and utilize complementary information from MRI, PET, fMRI, and DTI data.
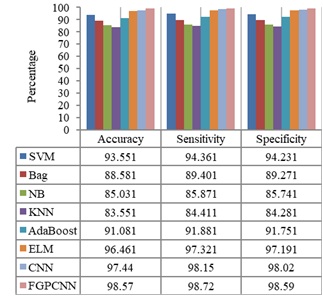
A comparative analysis was performed to illustrate the benefits of the FGPCNN and multimodal fusion frameworks. The performance measures of the FGPCNN algorithm were juxtaposed with those of single-modality methods including DTI, PET, fMRI, and MRI-based detection models. This comparison highlights how the multimodal fusion strategy improves AD detection accuracy.

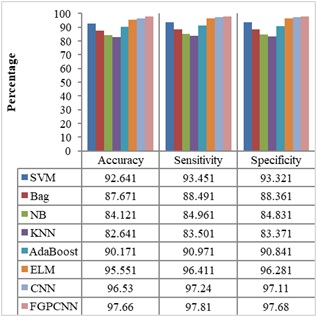
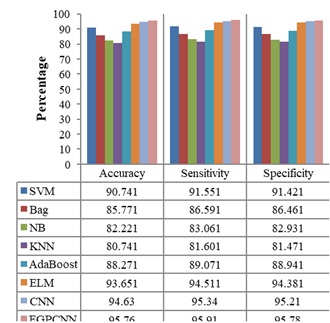
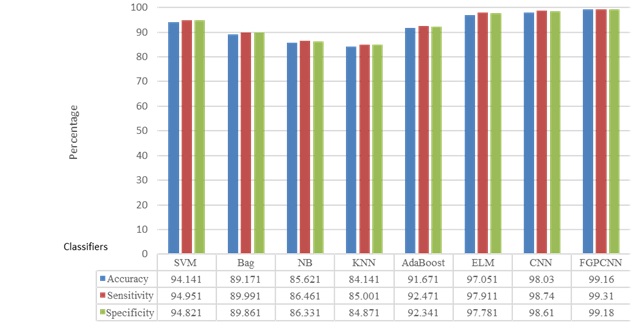
Table 7 compares the performance of the proposed method with existing Multimodality models for the dataset using accuracy and error rate as the two-evaluation metrics. Figure 9 shows the ROC Curve of the proposed model.
| Parameters used | Average accuracy (%) | Average error rate (%) |
|---|---|---|
| Fourozannezhad et al. [7] | 69.5 | 30.05 |
| Hao et al. [10] | 73.6 | 26.4 |
| Shao et al. [22] | 75.5 | 24.50 |
| Odusami et al. [20] | 94.32 | 5.68 |
| Proposed | 98.94 | 1.06 |
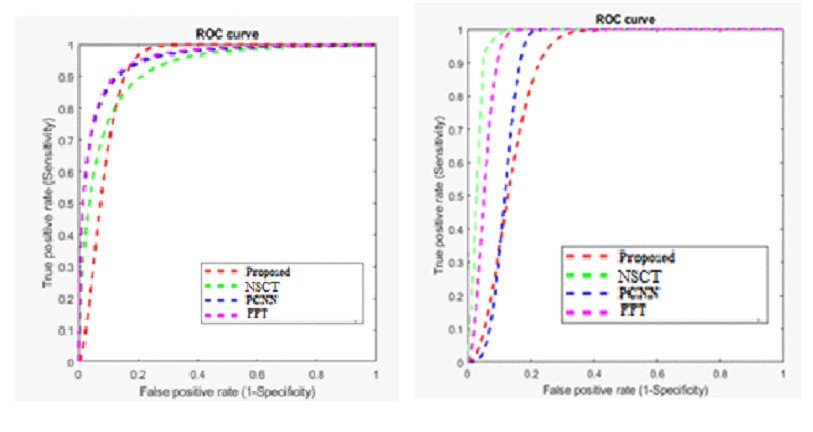
Based on the ROC curve, the proposed methodology outperforms the other methods (NSCT, PCNN, and FFT) in terms of accuracy and sensitivity. The proposed method achieves a higher true positive rate at lower false positive rates, indicating a more effective image fusion strategy. The PCNN method shows better performance than NSCT and FFT but still falls short compared to the proposed method. The FFT method exhibits the least effective performance, demonstrating the importance of the advanced fusion techniques used in the proposed method for achieving superior results in multimodal image fusion.
The ROC curve illustrates the comparative performance of four image fusion methods: the proposed method, NSCT, PCNN, and FFT. The NSCT method (green dashed line) demonstrates the highest sensitivity across all false positive rates, indicating the best overall performance in distinguishing true signals from false ones. The proposed method (red dashed line) follows closely, showing a strong performance but slightly lower than NSCT. The PCNN method (pink dashed line) performs moderately well, while the FFT method (blue dashed line) shows the least effective performance, indicating that it is the least capable of correctly identifying true positives. Overall, the NSCT method is superior in sensitivity, while the proposed method remains competitive.
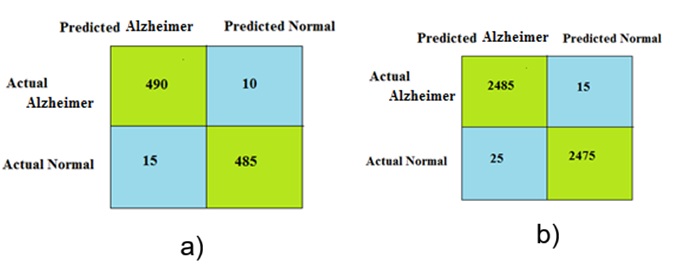
The performance of the proposed approach was evaluated using a confusion matrix as the metric. The dataset consisted of two classes: Alzheimer ’s and normal. Therefore, a 2 \(\mathrm{\times}\) 2 confusion matrix was used. Figure 10 shows the confusion matrices obtained for different numbers of Alzheimer and normal samples.
Although the proposed approach provides best result, it has some limitation. FFT focuses on frequency domain analysis, which may not capture all relevant information for AD detection. Fuzzy rule-based approaches often rely on domain experts to define the rules and membership functions, which can be subjective and may not capture all relevant information in the data. PCNN methods struggle to capture non-linear relationships and interactions between different features, limiting their ability to accurately model the complex nature of AD. To overcome this limitation, in future, the sample size is increased from each data set to evaluate the performance of this proposed approach. Instead of PCNN and fuzzy rule, deep convolution neural network will be considered in future to reduce complexity. To improve the fusion performance, the FFT is replaced by curvelet transform in future.
Automated multimodal medical image fusion frameworks using deep learning techniques have shown promising results in Alzheimer’s detection. These frameworks leverage complementary information provided by different imaging modalities to enhance the accuracy and reliability of AD diagnosis. Although each framework has its strengths and limitations, they collectively demonstrate the potential of deep learning-based fusion models for improving AD detection. Further research can be conducted, as the collection of datasets is somewhat complex; hence, a dataset with all images along with information regarding the sex, age, and stage of AD must be mentioned, which could help researchers. In addition, the pretrained deep learning networks were trained using thousands of images for specific purposes. The possibility of training deep neural networks with more images can be explored with increased computational capabilities by using GPUs. In future, the sample size should be increased for each dataset to evaluate the performance of the proposed approach. Instead of the PCNN and fuzzy rule, a deep convolutional neural network will be considered in the future to reduce complexity. To improve the fusion performance, FFT will be replaced by a curvelet transform in the future.