We investigate the Sombor indices for a diverse group of nonsteroidal anti-inflammatory drugs (NSAIDs) to understand their molecular architecture and physicochemical properties. By utilizing quantitative structure-property relationship (QSPR) modeling, we establish mathematical models linking Sombor indices to key pharmacodynamic and toxicological parameters. Our study sheds light on how the molecular composition of NSAIDs influences their drug profiles and biological behavior, offering valuable insights for drug development and safety assessment.
Painkillers are widely used to alleviate acute and chronic pain. While acute pain often dissipates when the underlying cause is addressed, chronic pain can persist, leading to prolonged reliance on opioids [1]. However, prolonged or excessive use of opioids can have detrimental effects on health. The human body contains numerous nerves responsible for transmitting messages between body parts, with nerve endings located primarily in the skin, gastrointestinal system, and connective tissues. Painkillers, or analgesics, act through two primary mechanisms: inhibiting the release of prostaglandins to prevent pain signals from reaching the brain, or disrupting communication between nerves to block pain signals [2]. These mechanisms provide temporary relief from pain. Painkillers are broadly categorized into non-prescription (over-the-counter) and prescription medications, with varying efficacy in pain reduction:
This study focuses on NSAIDs, which, despite their widespread use, may not be suitable for everyone and can sometimes cause adverse effects [3]. NSAID gels and creams applied to the skin may offer localized relief with fewer side effects compared to oral formulations. Chemical graph theory, a branch of mathematical chemistry, deals with chemical graphs that represent molecular structures [4, 5, 6]. Topological indices, a key tool in chemical graph theory, bridge mathematical concepts with chemistry [7, 8, 9]. In this study, we employ topological indices to analyze a variety of pharmaceuticals, developing unique indicators based on node degrees to characterize their chemical properties and processes.
Chemists and pharmacists can utilize graph theory resources for further research, including Quantitative Structure-Activity/Property/Toxicity Relationship (QSAR/QSPR/QSTR) modeling, which predicts biological activity based on molecular structure [10]. Husin et al. provided a topological analysis of certain networks [11]. Recent research has focused on pharmaceutical topological indices and their use in QSAR modeling [12]. Chemical compounds are often represented as vertices on a graph, with edges denoting bonds between them. NSAID drugs under investigation in this study are treated as chemical compounds, and topological indices are defined accordingly. Regression analysis demonstrates a strong correlation between obtained features and NSAID characteristics.
In chemistry, valence and degree in graph theory are related concepts. Quantitative Structure-Property Relationship (QSPR) plays a crucial role in drug design by providing a cost-effective alternative to traditional experimental testing methods [13, 14, 15]. QSAR models are increasingly used in environmental toxicity assessment and drug development to predict toxicity, resistance, and physicochemical properties [13, 14, 15]. In theoretical chemistry, drugs are represented as molecular networks, with edges representing bonds between atoms and vertices representing atoms [13, 14, 15].
Experimental determinations in chemistry can be costly, but QSPR modeling research can help reduce these costs by providing insights into biological processes and structural facets. QSPR and QSAR techniques enable the construction of accurate models predicting the characteristics or actions of organic molecules [16, 17, 18]. However, developing realistic models requires an approach capable of encoding predicted molecular structure descriptors effectively. Descriptor-based modeling allows researchers to pinpoint specific traits influencing the activity or property of interest in compounds [19, 20].
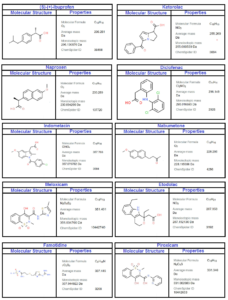
In this study, we employed a rigorous methodology to compute Sombor indices and develop Quantitative Structure-Property Relationship (QSPR) models for the molecular graph of NSAID drugs [3], as illustrated in Figure 1. Initially, we collected a comprehensive dataset of NASID drugs, namely Ketorolac, Diclofenac, Naproxen, Ibuprofen, Meloxicam, Nabumetone, Indomethacin, Famotidine, Etodolac, and Piroxicam, from reliable sources (see Table 1) and meticulously preprocessed the data. Sombor indices were then calculated using established mathematical methods (edge partition technique) and Maple software, yielding a set of descriptors. Subsequently, we partitioned the dataset into distinct training, validation, and test subsets for model development and assessment. QSPR models were constructed employing regression model techniques with defined algorithms and executed using SPSS. Furthermore, external validation on an independent dataset was conducted to ensure the generalizability of the regression models. The interpretation of model findings and statistical analyses were integral parts of our methodology. To enhance reproducibility, the availability of code and data was maintained. This methodology ensures the robustness of our Sombor index-based QSPR modeling for NSAID drugs with properties namely, boiling point (BP), polarity (Pol), complexity (C), refractivity (R), and molecular weight (MW).
| Drugs | Bp | Pol | C | R | MW | MV |
|---|---|---|---|---|---|---|
| Ketorolac | 493.2 | 26.67 | 376 | 70.19 | 83.1 | 198.2 |
| Diclofenac | 412 | 27.93 | 304 | 75.46 | 73.1 | 209.8 |
| Naproxen | 403.9 | 24.81 | 277 | 64.85 | 72.1 | 195.3 |
| Ibuprofen | 157 | 23.76 | 203 | 60.73 | 62.4 | 203.3 |
| Meloxicam | 581.3 | 34.25 | 628 | 88.62 | 83.5 | 220.7 |
| Nabumetone | 372.3 | 26.17 | 262 | 68.43 | 64.3 | 213.5 |
| Indomethacin | 499.4 | 36.64 | 506 | 94.81 | 83.3 | 275.6 |
| Famotidine | 662.4 | 31.66 | 469 | 80.46 | 100.3 | 191.7 |
| Etodolac | 507.9 | 31.66 | 400 | 80.46 | 84.9 | 248.3 |
| Piroxicam | 568.5 | 32.27 | 611 | 87.04 | 91.3 | 229.8 |
Numerous degree-based graph invariants, also known as “topological
indices,” have been presented and thoroughly investigated in the
mathematical and chemical literature [19, 20]. Generally,
Sombor and reduced Sombor index [21] are given by
In Eq. (2), the ordered pair
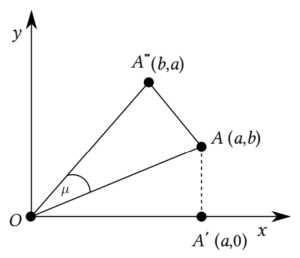
Kulli and Gutman presented the modified Sombor index [22], as follows:
Mendez-Bermudez et al. presented max and min Sombor
indices [23]:
Wang and Wu in [24]
introduced the ideas of exponential and exponential reduced Sombor
indices:
Author introduced the idea of the multiplicative version of Sombor
indices:
Theorem 1. Let
Proof. Let
Theorem 2. Let
Proof. Let
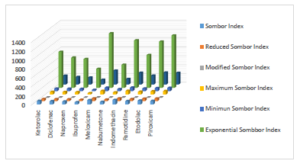
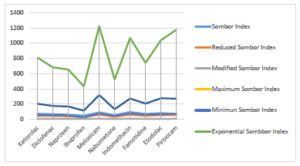
Topological indices for other drugs can be computed using similar procedures. Table 2 includes all computed values of NSAID drugs for different versions of Sombor indices. Figures 3 and 4 depict 2D and 3D graphical representations of calculated TIs for various NSAID drugs.
| Drugs | SO(G) |
|
mSO(G) | maxSO(G) | minSO(G) |
|
|
MSO(G) |
|
| Ketorolac | 73.53 | 44.87 | 6.148 | 57 | 45 | 810.74 | 204.49 | 88660.04 | 11591.78 |
| Diclofenac | 68.36 | 41.44 | 5.95 | 55 | 39 | 682.28 | 175.73 | 65674.10 | 8586.50 |
| Naproxen | 62.55 | 38.43 | 5.30 | 51 | 35 | 654.05 | 168.07 | 49562.47 | 2897.94 |
| Ibuprofen | 48.48 | 28.61 | 4.73 | 27 | 39 | 432.42 | 114.17 | 16418.53 | 2146.63 |
| Meloxicam | 92.27 | 58.90 | 6.96 | 75 | 51 | 1224.87 | 319.23 | 7220833.86 | 495345.12 |
| Nabumetone | 56.08 | 32.85 | 5.32 | 45 | 33 | 523.10 | 132.37 | 7739.77 | 715.55 |
| Indomethacin | 95.89 | 59.64 | 7.79 | 77 | 55 | 1070.20 | 273.36 | 235574.70 | 20661.27 |
| Famotidine | 70.09 | 43.94 | 5.81 | 60 | 34 | 742.56 | 206.71 | 258486.22 | 19440 |
| Etodolac | 82.99 | 53.39 | 5.26 | 68 | 46 | 1039.67 | 276.30 | 2101571.34 | 137384.02 |
| Piroxicam | 73.40 | 56.67 | 7.15 | 72 | 52 | 1178.40 | 271.29 | 7108008.33 | 487605.34 |
Regression models (RM) are statistical techniques used to analyze and
model the relationship between a dependent variable and one or more
independent variables. Common types of regression models include linear
regression, logistic regression, and polynomial regression, each suited
to different types of data and research questions. Here, we will use
liner regression model, Eq. (4), to check the relationship between
topological indices and the physiochemical features of NSAIDs.
| Property | N | A | b | r | S | |
|---|---|---|---|---|---|---|
| Boiling Point | 9 | 1.480 | 6.416 | 0.685 | 0.469 | 0.394 |
| Polarity | 9 | 10.803 | 0.260 | 0.902 | 0.814 | -1.477 |
| Complexity | 9 | -156.10 | 7.734 | 0.787 | 0.619 | 5.652 |
| Refractivity | 9 | 29.043 | 0.660 | 0.891 | 0.794 | -1.543 |
| Molecular Weight | 9 | 45.776 | 0.471 | 0.595 | 0.354 | 0.253 |
| Molecular Volume | 9 | 116.383 | 1.482 | 0.621 | 0.386 | -0.643 |
| Property | N | A | b | r | S | |
|---|---|---|---|---|---|---|
| Boiling Point | 9 | 31.066 | 9.476 | 0.740 | 0.548 | -2.760 |
| Polarity | 9 | 13.043 | 0.361 | 0.917 | 0.841 | -1.137 |
| Complexity | 9 | -154.500 | 12.166 | 0.905 | 0.819 | -1.043 |
| Refractivity | 9 | 33.736 | 0.945 | 0.932 | 0.869 | -1.210 |
| Molecular Weight | 9 | 45.621 | 0.746 | 0.690 | 0.476 | 0.294 |
| Molecular Volume | 9 | 143.342 | 1.641 | 0.680 | 0.462 | -0.800 |
| Property | N | A | b | r | S | |
|---|---|---|---|---|---|---|
| Boiling Point | 9 | -44.356 | 84.433 | 0.219 | 0.048 | 0.439 |
| Polarity | 9 | 7.832 | 3.600 | 0.817 | 0.667 | -1.729 |
| Complexity | 9 | -346.319 | 124.118 | 0.823 | 0.677 | -0.706 |
| Refractivity | 9 | 17.141 | 9.924 | 0.873 | 0.762 | -1.727 |
| Molecular Weight | 9 | 41.759 | 6.301 | 0.520 | 0.270 | 0.327 |
| Molecular Volume | 9 | 155.129 | 11.336 | 0.310 | 0.096 | 0.857 |
| Property | N | A | b | r | S | |
|---|---|---|---|---|---|---|
| Boiling Point | 9 | 19.934 | 7.596 | 0.834 | 0.696 | 0.182 |
| Polarity | 9 | 14.670 | 0.254 | 0.908 | 0.824 | -1.160 |
| Complexity | 9 | -92.351 | 8.449 | 0.884 | 0.781 | -1.303 |
| Refractivity | 9 | 37.784 | 0.670 | 0.928 | 0.861 | -1.163 |
| Molecular Weight | 9 | 46.994 | 0.559 | 0.727 | 0.552 | 0.014 |
| Molecular Volume | 9 | 148.418 | 1.128 | 0.552 | 0.305 | 0.555 |
| Property | N | A | b | r | S | |
|---|---|---|---|---|---|---|
| Boiling Point | 9 | 203.174 | 6.122 | 0.350 | 0.123 | 1.234 |
| Polarity | 9 | 12.528 | 0.398 | 0.740 | 0.548 | -1.454 |
| Complexity | 9 | -179.289 | 13.587 | 0.740 | 0.548 | -1.726 |
| Refractivity | 9 | 31.389 | 1.066 | 0.753 | 0.567 | -1.452 |
| Molecular Weight | 9 | 55.706 | 0.563 | 0.381 | 0.145 | 1.212 |
| Molecular Volume | 9 | 106.4717 | 2.731 | 0.613 | 0.376 | -0.313 |
| Property | N | A | b | r | S | |
|---|---|---|---|---|---|---|
| Boiling Point | 9 | 203.174 | 6.122 | 0.717 | 0.514 | 0.595 |
| Polarity | 9 | 12.528 | 0.398 | 0.859 | 0.738 | -0.778 |
| Complexity | 9 | -7.147 | 0.491 | 0.924 | 0.854 | -1.197 |
| Refractivity | 9 | 47.631 | 0.035 | 0.879 | 0.773 | -0.777 |
| Molecular Weight | 9 | 56.214 | 0.028 | 0.661 | 0.437 | 0.457 |
| Molecular Volume | 9 | 162.389 | 0.073 | 0.568 | 0.323 | -0.691 |
| Property | N | A | b | r | S | |
|---|---|---|---|---|---|---|
| Boiling Point | 9 | 138.618 | 1.528 | 0.759 | 0.576 | 0.3555 |
| Polarity | 9 | 17.638 | 0.056 | 0.820 | 0.672 | -0.796 |
| Complexity | 9 | -15.250 | 1.956 | 0.902 | 0.814 | -1.369 |
| Refractivity | 9 | 46.328 | 0.144 | 0,822 | 0.676 | -0.799 |
| Molecular Weight | 9 | 54.372 | 0.119 | 0.695 | 0.483 | 0.219 |
| Molecular Volume | 9 | 157.782 | 0.307 | 0.523 | 0.274 | -0.867 |
| Property | N | A | b | r | S | |
|---|---|---|---|---|---|---|
| Boiling Point | 9 | 428.280 | 0.00003 | 0.458 | 0.235 | 0.565 |
| Polarity | 9 | 28.289 | 0.0000008 | 0.515 | 0.265 | 0.537 |
| Complexity | 9 | 335.068 | 0.00004 | 0.798 | 0.637 | -1.459 |
| Refractivity | 9 | 73.485 | 0.000002 | 0.558 | 0.311 | 0.683 |
| Molecular Weight | 9 | 77.099 | 0.000002 | 0.395 | 0.156 | 0.518 |
| Molecular Volume | 9 | 215.104 | 0.0000002 | 0.189 | 0.036 | -0.102 |
| Property | N | A | b | r | S | |
|---|---|---|---|---|---|---|
| Boiling Point | 9 | 426.293 | 0.0003 | 0.460 | 0.212 | 0.612 |
| Polarity | 9 | 28.27 | 0.00001 | 0.517 | 0.267 | 0.565 |
| Complexity | 9 | 334.777 | 0.0006 | 0.801 | 0.642 | -1.498 |
| Refractivity | 9 | 73.447 | 0.00003 | 0.562 | 0.316 | 0.568 |
| Molecular Weight | 9 | 77.104 | 0.00002 | 0.397 | 0.158 | 0.561 |
| Molecular Volume | 9 | 215.069 | 0.00003 | 0.182 | 0.033 | -0.073 |
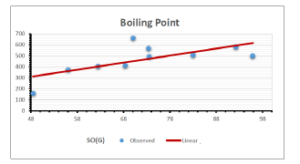
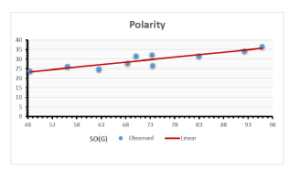
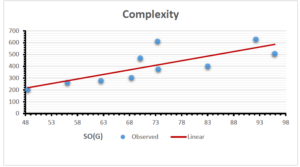
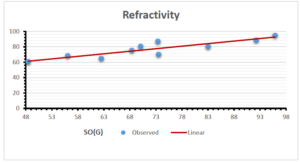
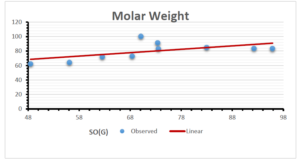
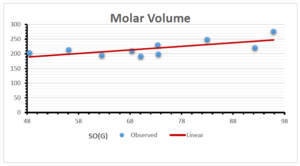
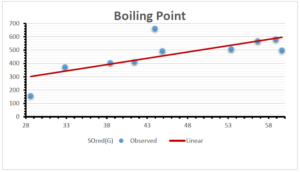
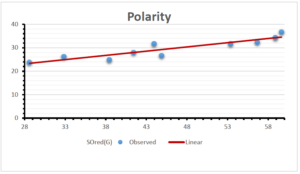
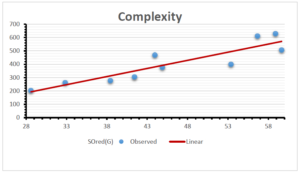
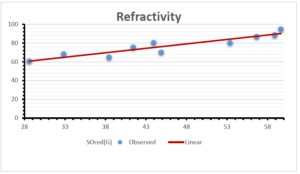
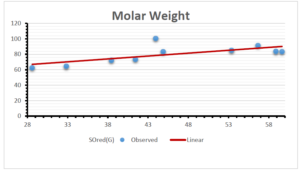
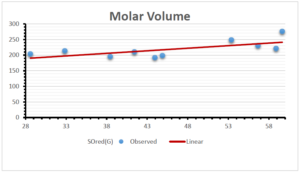
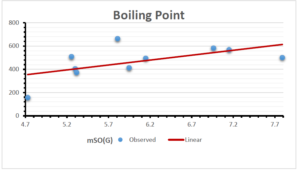
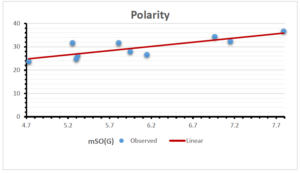
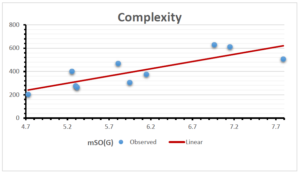
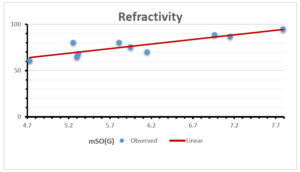
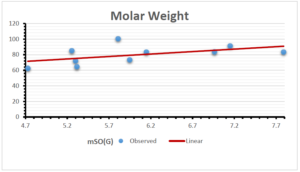
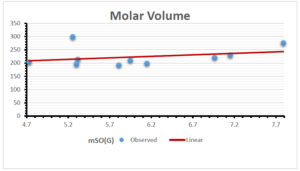
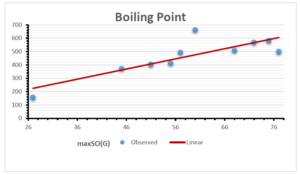
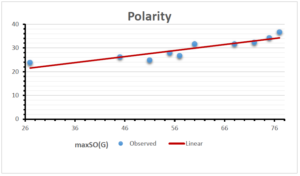
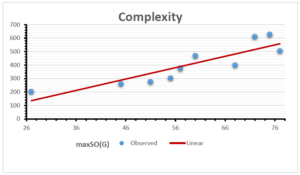
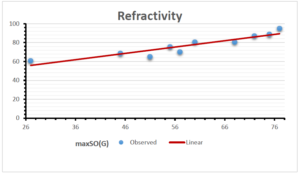
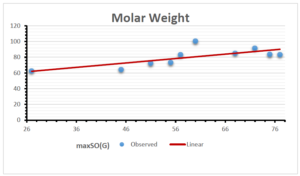
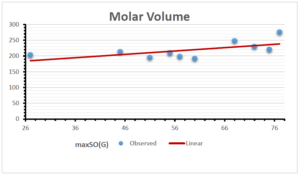
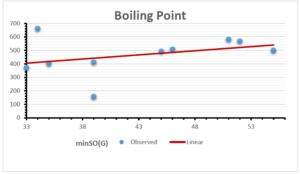
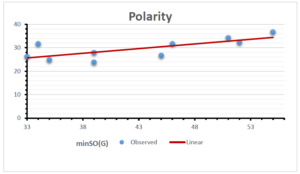
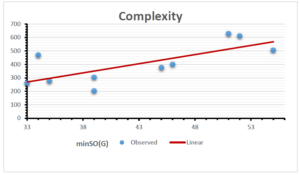
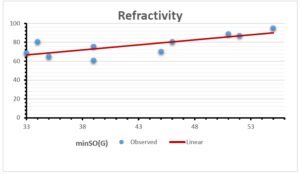
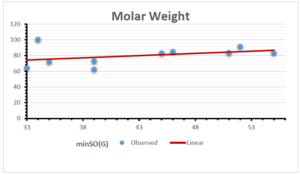
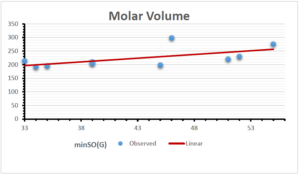
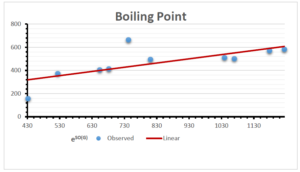
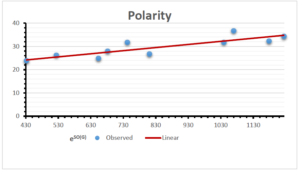
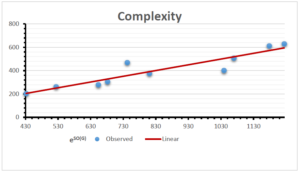
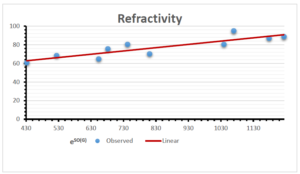
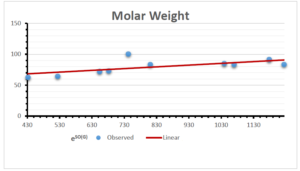
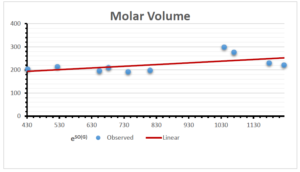
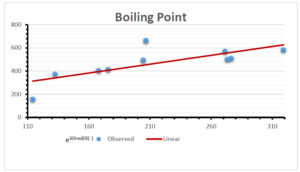
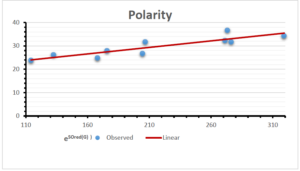
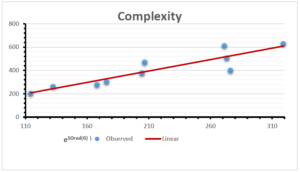
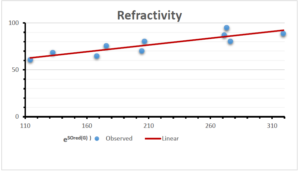
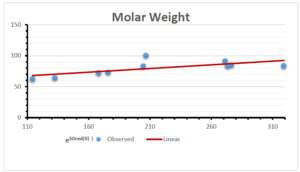
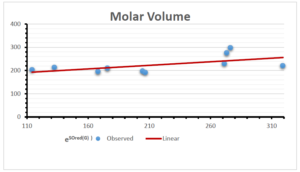
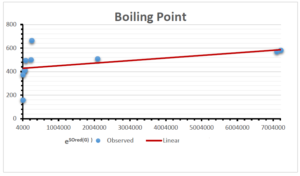
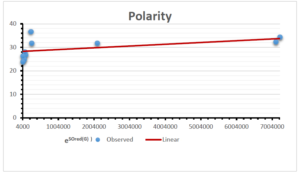
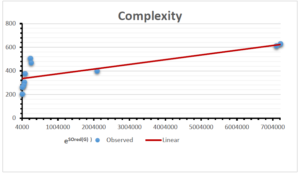
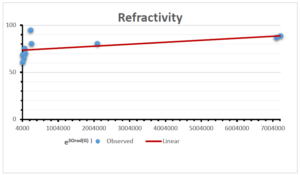
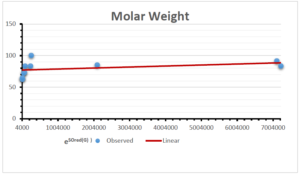
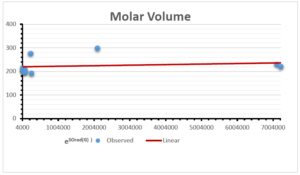
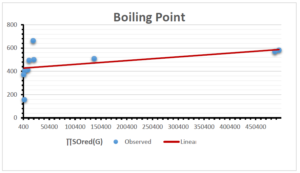
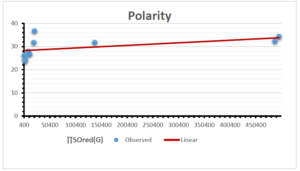
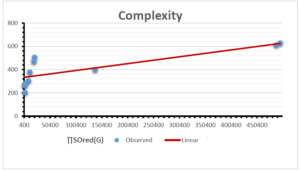
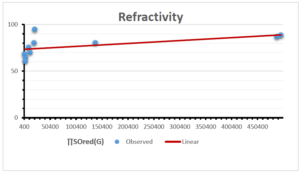
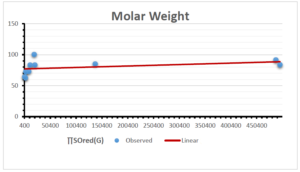
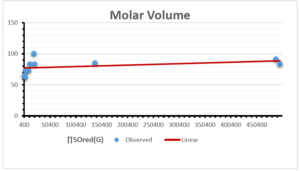
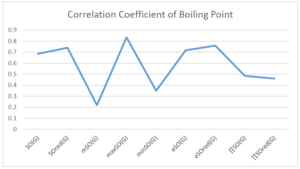
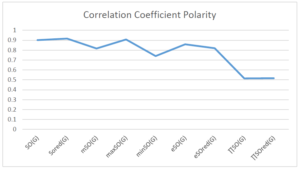
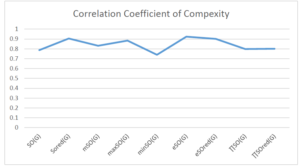
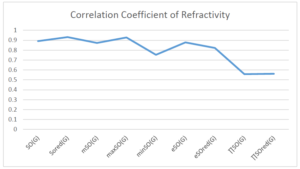
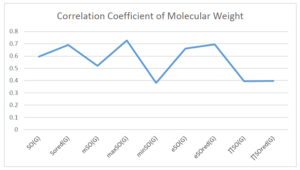
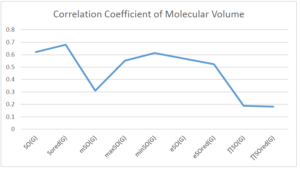
The correlation coefficient plays a pivotal role in the analysis of the relationship between the properties of NSAID and their linear regression models. These coefficients are not only valuable for characterizing these relationships but also for building predictive linear regression models. Gutman, gives the capacitative text by which we can check the validity of an index. According to Gutman, an index with specific property of a drug in useful, if its correlation coefficient is greater then 0.8, otherwise index is useless for us [25]. Table 14 represents the Correlation Coefficients of Sombor indices with Properties of NSAIDS in tabular form and Figures 59–64 represents graphical representation. , Table 12 and 13, represents the coefficient determination and coefficient of variance, respectively.
| Topological Index | Bp | Pol | C | R | MW | MV |
|---|---|---|---|---|---|---|
| 0.469 | 0.814 | 0.619 | 0.794 | 0.354 | 0.386 | |
| 0.548 | 0.841 | 0.819 | 0.819 | 0.476 | 0.462 | |
| 0.048 | 0.667 | 0.677 | 0.762 | 0.270 | 0.096 | |
| 0.696 | 0.824 | 0.781 | 0.861 | 0.552 | 0.305 | |
| 0.123 | 0.548 | 0.548 | 0.567 | 0.145 | 0.376 | |
| 0.514 | 0.0.738 | 0.854 | 0.773 | 0.437 | 0.323 | |
| 0.576 | 0.672 | 0.814 | 0.676 | 0.483 | 0.274 | |
| 0.235 | 0.265 | 0.647 | 0.311 | 0.156 | 0.036 | |
| 0.267 | 0.517 | 0.646 | 0.316 | 0.158 | 0.033 |
| Topological Index | Bp | Pol | C | R | MW | MV |
|---|---|---|---|---|---|---|
| 19.632 | 19.632 | 19.632 | 19.632 | 19.632 | 19.632 | |
| 22.652 | 22.652 | 22.652 | 22.652 | 22.652 | 22.652 | |
| 15.252 | 15.252 | 15.252 | 15.252 | 15.252 | 15.252 | |
| 24.887 | 24.887 | 24.887 | 24.887 | 24.887 | 24.887 | |
| 17.736 | 17.736 | 17.736 | 17.736 | 17.736 | 17.736 | |
| 31.450 | 31.450 | 31.450 | 31.450 | 31.450 | 31.450 | |
| 30.298 | 30.298 | 30.298 | 30.298 | 30.298 | 30.298 | |
| 162.592 | 162.592 | 162.592 | 162.592 | 162.592 | 162.592 | |
| 160.429 | 160.429 | 160.429 | 160.429 | 160.429 | 160.429 |
| Topological Index | Bp | Pol | C | R | MW | MV |
|---|---|---|---|---|---|---|
| 0.685 | 0.902 | 0.787 | 0.891 | 0.595 | 0.621 | |
| 0.740 | 0.917 | 0.905 | 0.932 | 0.690 | 0.680 | |
| 0.219 | 0.817 | 0.832 | 0.873 | 0.520 | 0.310 | |
| 0.834 | 0.908 | 0.884 | 0.928 | 0.727 | 0.552 | |
| 0.350 | 0.740 | 0.740 | 0.753 | 0.381 | 0.613 | |
| 0.717 | 0.859 | 0.924 | 0.879 | 0.661 | 0.568 | |
| 0.759 | 0.820 | 0.902 | 0.822 | 0.695 | 0.523 | |
| 0.458 | 0.515 | 0.798 | 0.558 | 0.395 | 0.189 | |
| 0.460 | 0.517 | 0.801 | 0.562 | 0.397 | 0.182 |
A structure can be given a single number by employing the topological index. Knowledge of topological indices plays a key role in the link between quantitative structure activity as well as property. our study has provided valuable insights into the relationships between the physical properties of NSAIDs and different versions of Sombor indices, shedding light on the intricate interplay between these factors. By calculating and analyzing the correlation coefficients, we have discerned the strength and direction of associations between specific drug properties and the derived topological indices. These findings are instrumental in understanding how drug physicochemical characteristics influence molecular structure and, consequently, their behavior within biological systems. The results not only contribute to the field of pharmaceutical research but also offer practical implications for drug design, optimization, and prediction of pharmacological outcomes. According to Gutman [25], indices with correlation coefficient greater then 0.8 in useful. Table 14, shows significant results in testing Sombor indices and their implementation on diffident properties of NSAIDs. Sombor and its reduced version gives best result with polarity of NSAIDs drugs. While, exponential Sombor indices are best for predicting the complexity of NSAIDs. Reduce Sombor index is good to predict the value of refractivity for NSAIDs. Further research can build upon these findings to refine drug development strategies and enhance the pharmaceutical industry’s ability to deliver safer and more effective therapeutic agents.
The authors declare no conflict of interest.
1970-2025 CP (Manitoba, Canada) unless otherwise stated.