This study introduces a novel approach to investigating Sombor indices and applying machine learning methods to assess the similarity of non-steroidal anti-inflammatory drugs (NSAIDs). The research aims to predict the structural similarities of nine commonly prescribed NSAIDs using a machine learning technique, specifically a linear regression model. Initially, Sombor indices are calculated for nine different NSAID drugs, providing numerical representations of their molecular structures. These indices are then used as features in a linear regression model trained to predict the similarity values of drug combinations. The model’s prediction performance is evaluated by comparing the predicted similarity values with the actual similarity values. Python programming is employed to verify accuracy and conduct error analysis.
All of us have occasionally used painkillers in our lives. Painkillers can be used to ease a variety of acute and chronic pains. Sudden acute discomfort subsides once the underlying cause is resolved. However, chronic pain can persist for weeks or even months at a time, leading to a prolonged reliance on opioids [9]. While the majority of people think that opioids are safe, long-term or excessive use may be harmful to one’s health. The human body has hundreds of nerves that communicate with one another to send messages. Although nerves are found all over the body, their terminals, also known as nerve endings, are restricted to the skin, gastrointestinal tract, and connective tissues. Analgesics, the term used in medicine to describe painkillers, can work in one of two ways: Prostaglandins should not be released since they block the brain’s ability to perceive pain [19]. To prevent pain signals from reaching the brain, sever the connection between the two nerves. These processes allow for the temporary reduction or alleviation of pain with the use of medication. The two main categories into which painkillers fall are non-prescription (over-the-counter) and prescription. The most popular types of painkillers range depending on their capacity to reduce pain:
Nonsteroidal anti-inflammatory drugs (NSAIDs).
Non-opioid relievers.
Opioid relievers.
Mixed painkillers.
This study focus on the analysis of NSAID drugs. Despite their widespread use, NSAIDs can not be taken by everyone and can occasionally have undesirable side effects [5]. If you feel unease in one or more muscles or joints in a particular body part, it may be valuable to use NSAID gels and creams that you nourish into your skin because compared to tablets or capsules, they typically have less negative effects . Chemical graph theory is a field of mathematical chemistry focused on the study of chemical graphs, which represent and characterize chemical structures. [1,20,21] A best tool of chemical graph theory is a topological index, that play a crucial rule in binding the mathematical concept with chemistry [4,3,16]. While conducting this study, a diversity of pharmaceuticals are engross, and then, by use invariants depending upon the degree of nodes, For each of these medications, a variety of topological indicators are developed to ascertain their unique characteristics and corresponding chemical processes. Chemists and pharmacists might use the resources offered by graph theory for further study, such as Quantitative Structure-Activity/Property/Toxicity Relationship (QSAR/QSPR/QSTR). QSAR modeling is employed to determine the biological activity of the structures [17]. Husin et al. [11] gives the topological analysis of certain networks.
Lately, studies have concentrated on topological indexes for pharmaceutical, and QSAR has been utilized to discuss and present a number of findings. Topological indices are important considerations in the physio-chemical analysis of chemical compound structures [15,18]. On a graph, a chemical compound’s constituents are often illustrated as vertices, while the bonds that link them are portrayed as edges. As on the same steps, The NSAID drugs that are the subject of this investigation are regarded as chemicals, and the topological indices are defined. Additionally, we show that there is a high correlation between the obtained features and those of NSAIDs using regression analysis. In chemistry, the concepts of valence and in graph theory idea of degree are somewhat related. These days, QSPR plays an crucial part in the process of drug design. This is because they are a more affordable substitute for the conventionally employed medium throughput in vitro and low throughput in vivo testing. Environmental toxicity and drug development are two areas where QSAR models are becoming more widely accepted as a valid scientific approach for anticipate and characterization of biological poisonings of unexamined substances, as well as for predicting drug toxicity, resistance, and physicochemical qualities. In the field of chemistry, drugs are portrayed as networks of molecules, where each edge denotes a link between two atoms and each vertex represents an atom [2,23,6].
Most of the time, the prices related to the experimental determinations are very substantial; however, these costs can be reduced by using the QSPR modeling research. It is mostly utilized to investigate biological processes in addition to the various facets related to the structures, which is favorable for analyzing how a medicine molecule’s structural components affect its biological actions. With the aid of QSPR and QSAR techniques, models that can precisely predict the characteristics or actions of organic molecules can be built [13,10,8]. However, in order to formulate realistic models, a approach that is simultaneously skilled and effective of encoding the structures with predicted molecular structure descriptors is essential. When creating models, with the help of descriptors might equip an opportunity to zero down on particular traits that account for the activity or property of interest in the compounds [21,16].
In this research, we implemented a detailed methodology to calculate Sombor invariats and create Quantitative Structure-Property Relationship (QSPR) modeling for the molecular structures of various NSAID drugs, as shown in Figure 1. First, we assembled a exhaustive database of NSAID drugs, specifically Ketorolac, Meloxicam, Ibuprofen, Diclofenac, Nabumetone, Indomethacin, Naproxen, Etodolac, Piroxicam and Famotidine from trustworthy original sources (Table 1) and performed meticulous data preprocessing. Using established mathematical methods, particularly the edge partition technique, we calculated the Sombor indices with the help of Maple software, resulting in a set of descriptors. The dataset was then divided into subsets for testing, validation, and training in order to aid in the creation and assessment of models. The QSPR models were built using regression approach with specified algorithms and executed with SPSS software. To verify the generalizability of the models, we conducted external validation using an independent dataset. Our process included a detailed interpretation of model results and comprehensive statistical analysis. To ensure reproducibility, we provided access to the code and data. This meticulous approachensures the durability of our QSPR models based on Sombor indices for NSAID drugs, focusing on chemical stability such as boiling point (BP), refractivity (R), complexity (C), polarity (Pol), and molecular weight (MW).
| Drugs | Bp | R | Pol | C | MV | MW |
| Ketorolac | 493.2 | 70.19 | 26.67 | 376 | 198.2 | 83.1 |
| Naproxen | 403.9 | 64.85 | 24.81 | 277 | 195.3 | 72.1 |
| Meloxicam | 581.3 | 88.62 | 34.25 | 628 | 220.7 | 83.5 |
| Indomethacin | 499.4 | 94.81 | 36.64 | 506 | 275.6 | 83.3 |
| Etodolac | 507.9 | 80.46 | 31.66 | 400 | 248.3 | 84.9 |
| Diclofenac | 412 | 75.46 | 27.93 | 304 | 209.8 | 73.1 |
| Ibuprofen | 157 | 60.73 | 23.76 | 203 | 203.3 | 62.4 |
| Nabumetone | 372.3 | 68.43 | 26.17 | 262 | 213.5 | 64.3 |
| Famotidine | 662.4 | 80.46 | 31.66 | 469 | 191.7 | 100.3 |
| Piroxicam | 568.5 | 87.04 | 32.27 | 611 | 229.8 | 91.3 |

Many graph invariants based on degrees, often referred to as
’topological indices,’ have been introduced and extensively studied in
both mathematical as well as in other related fields [21,16].
Here,
Modified Sombor is represented by Kulli and Gutman [12], as follow
Max and min Sombor invariants were presented by Mendez-Bermudez et
al. in [14]
Table 2 lists all the calculated values of NSAID for various types of Sombor invariants. Figures 2 and 3 show two and three dimensional representations of the computed topological indices for different NSAID.
| Chemical Compounds |
|
|
|
|
|
| Ketorolac | 73.53 | 44.87 | 6.148 | 57 | 45 |
| Ibuprofen | 48.48 | 28.61 | 4.73 | 27 | 39 |
| Diclofenac | 68.36 | 41.44 | 5.95 | 55 | 39 |
| Meloxicam | 92.2 | 58.90 | 6.96 | 75 | 51 |
| Nabumetone | 56.08 | 32.85 | 5.32 | 45 | 33 |
| Naproxen | 62.55 | 38.43 | 5.30 | 51 | 35 |
| Indomethacin | 95.89 | 59.64 | 7.79 | 77 | 55 |
| Etodolac | 82.99 | 53.39 | 5.26 | 68 | 46 |
| Piroxicam | 73.40 | 56.67 | 7.15 | 72 | 52 |
| Famotidine | 70.09 | 43.94 | 5.81 | 60 | 34 |
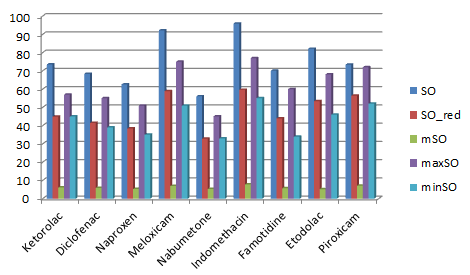
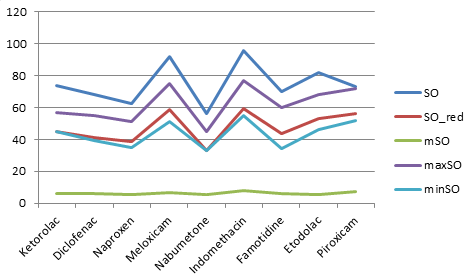
Table 2, represents the values of Sombor index (SO),
reduce Sombor version (
Regression models (RMs) are statistical methods employed to examine
and illustrate the association between a dependent variable and one or
more independent variables [22]. Typical RMs consist of linear RM, logistic RM,
and polynomial RM, each appropriate for different data types and
research questions. In this study, we will employ a linear regression
model, as represented by equation 4, to investigate
the bonds between TIs and the physiochemical characteristics of NSAIDs.
NSAID’s characteristic are represented by C. TI is refer as independent variable, two regression confident are a and b, we will use SPSS to find these constants. A five TIs for NSAID and their attributes are analyzed using a linear regression model.
This section comprises of five subsections. Subsection 4.1, represents the linear regression model of Sombor index with different physicochemical properties of NSAIDs drugs. Similarly, Subsections 4.2 – 4.5, are for reduce, modified, maximum and minimum Sombor indices, respectively.
This section will discuss the comparison of experimental data to observed values derived from a well-designed linear regression model. Values for the variables being considered are projected by applying the predictive capability of the linear regression model. These projected values are then carefully compared with the experimental data to ascertain how accurate the model is. A custom Python application is developed to achieve this comparison and estimate the level of accuracy. This application is written with precision in calculating the percentage error between the experimental data and the expected values, which is indicative of how well the model captures the subtleties and underlying trends seen in the empirical data. This approach will help better our knowledge of the capabilities of statistical modeling techniques toward prediction power by identifying pros and cons in the linear regression model with regards to approximating occurrences in the real world by this systematic review.
This subsection compares the exact value of the drug ketorolac with the values calculated from a linear regression model from Sombor. An extensive Table 3 is shown which presents the comparison between the calculated and actual values. Moreover, the corresponding Figures 4-9 illustrate the accuracy of each value (B.P, Pol, C, R, MW, MV) along with their error, thus visually describing the accuracy and reliability of the measurements.
| Property | Exact Value | Observed values | ||||
|
|
|
|
|
|
||
| B.P | 493.2 | 473.21 | 456.25 | 474.91 | 436.11 | 478.65 |
| Pol | 26.67 | 29.92 | 29.24 | 29.97 | 28.60 | 30.42 |
| C | 376 | 412.66 | 391.39 | 417 | 373.08 | 432.13 |
| R | 70.19 | 77.58 | 76.14 | 78.17 | 74.52 | 79.35 |
| MW | 83.1 | 80.41 | 79.09 | 80.51 | 78.23 | 81.01 |
| MV | 198.2 | 225.37 | 216.97 | 224.85 | 218.22 | 229.35 |


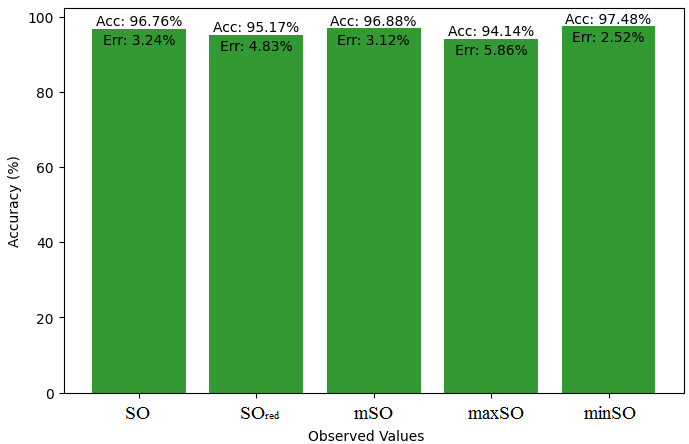
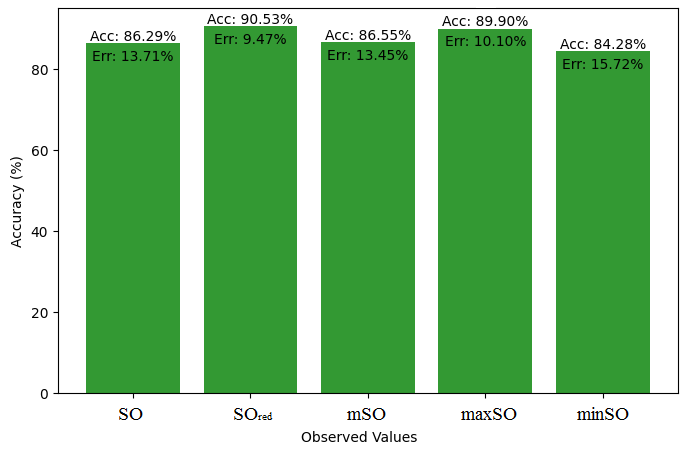
Here, we initiate a comparative analysis between the actual value of Diclofenac drug and the noted values garnered from our algorithm. An informative Table 4 is designed, defining the alignment of the data points that are observed and real. There are companion graphs that show each value’s accuracy alongside the associated inaccuracy, offering a visual representation of the reliability and fidelity of the measurements in Figures 10-15
| Property | Exact Value | Observed values | ||||
| SO |
|
mSO | maxSO | minSO | ||
| B.P | 412 | 440.08 | 423.75 | 458.02 | 423.48 | 441.92 |
| Pol | 27.93 | 28.58 | 28 | 29.25 | 28.18 | 28.03 |
| C | 304 | 372.60 | 349.66 | 392.18 | 360.09 | 350.61 |
| R | 75.46 | 74.16 | 72.90 | 76.19 | 73.41 | 72.95 |
| MW | 73.1 | 77.97 | 76.54 | 79.25 | 77.53 | 77.64 |
| MV | 209.8 | 217.69 | 211.35 | 225.58 | 215.93 | 212.97 |


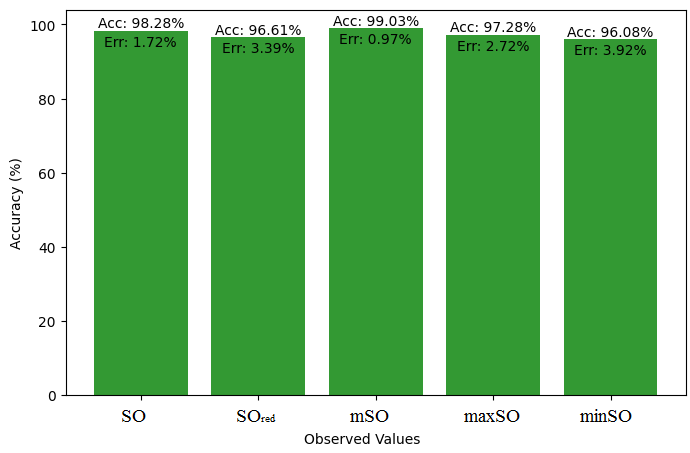
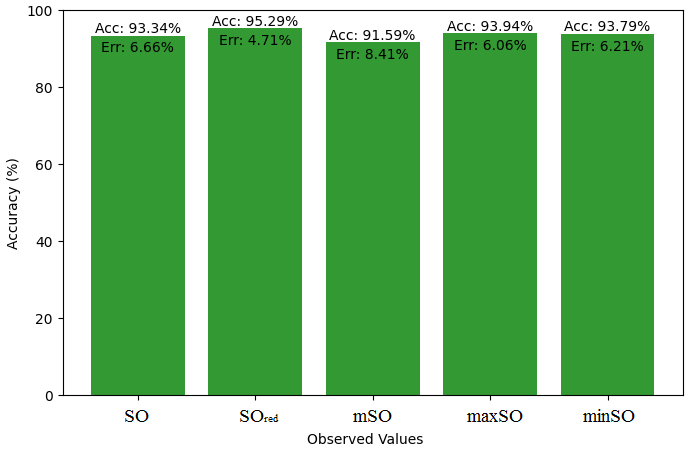
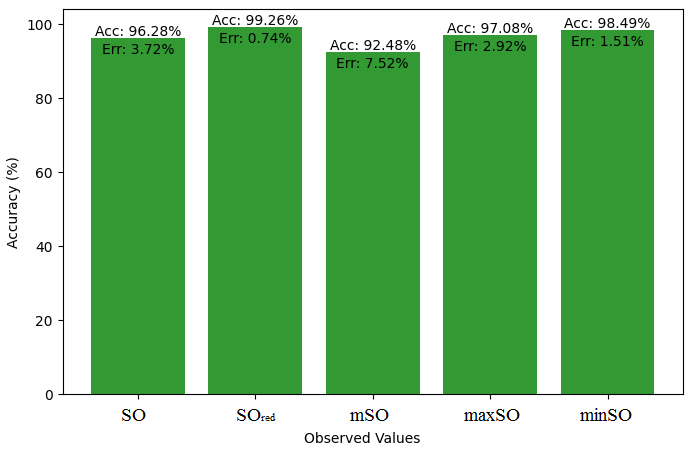
This section presents a comparison study of the exact value of Naproxen Drug and the observable values that come from sombor based linear regression model. A detailed Table 5 that shows the comparison of observed and real values is provided. In addition, Figures 16-21 that explain each value’s accuracy and associated error are included, providing a visual depiction of the measurements’ dependability and consistency.
| Property | Exact Value | Observed values | ||||
| SO |
|
mSO | maxSO | minSO | ||
| B.P | 403.9 | 402.80 | 395.23 | 403.14 | 398.21 | 417.43 |
| Pol | 24.81 | 27.07 | 26.92 | 26.91 | 27.35 | 26.44 |
| C | 277 | 327.66 | 313.04 | 312.51 | 334.11 | 296.26 |
| R | 64.85 | 70.33 | 70.05 | 69.74 | 71.21 | 68.68 |
| MW | 72.1 | 75.24 | 74.29 | 75.15 | 76.165 | 75.38 |
| MV | 195.3 | 209.08 | 206.41 | 215.21 | 211.35 | 202.04 |
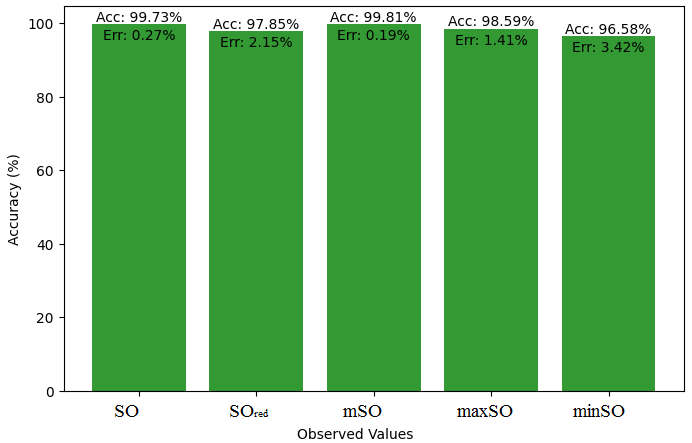
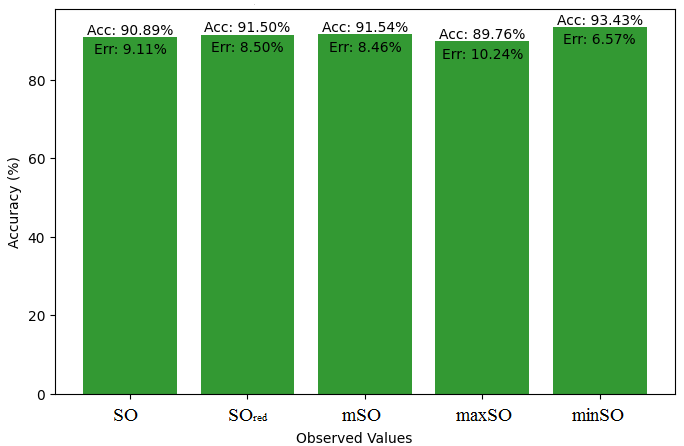
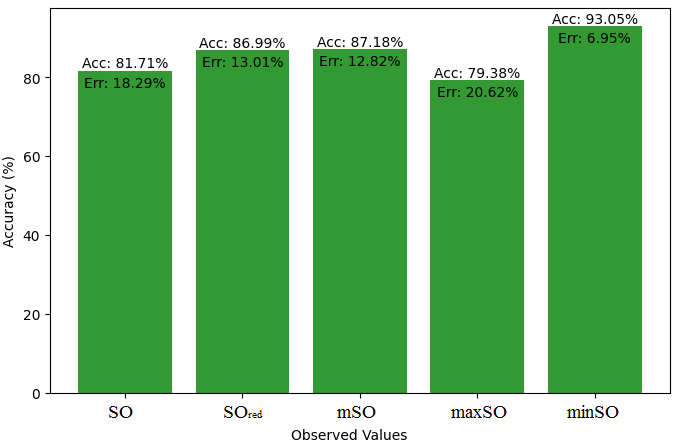
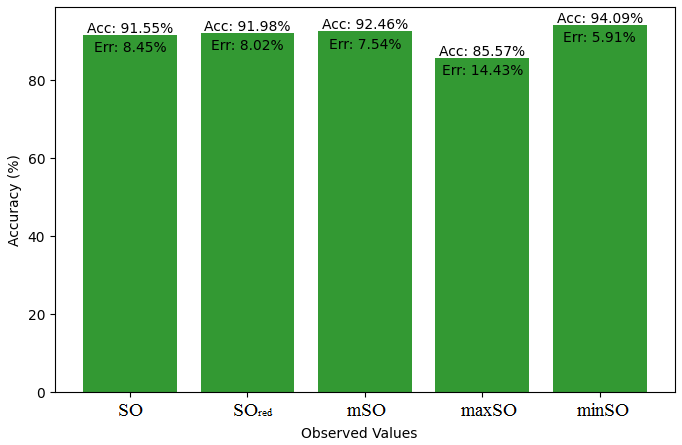
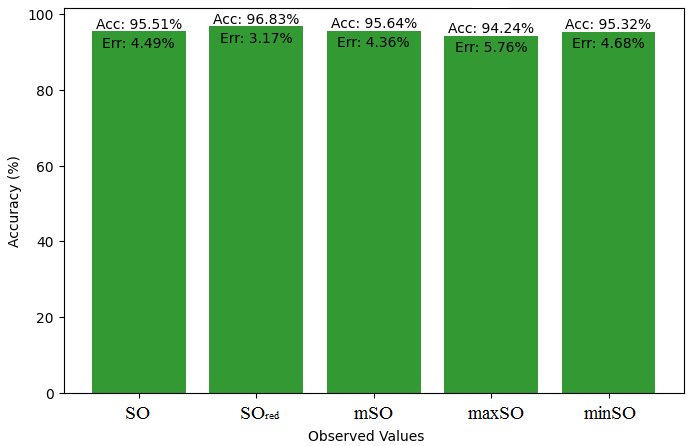
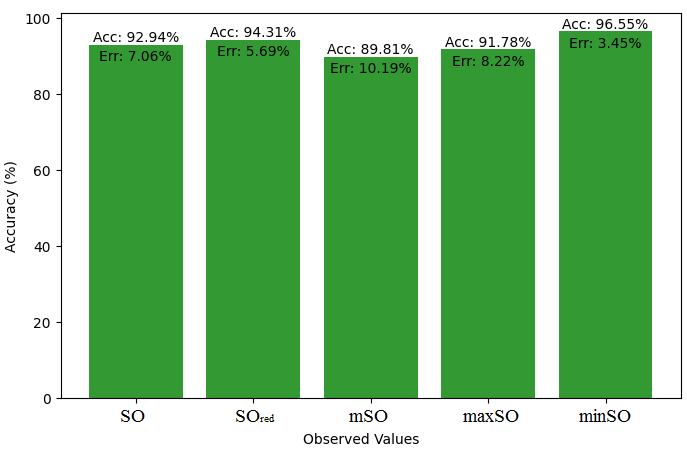
In this subsection, we compare the exact value of the drug Meloxicam with the observed values that were discovered with the help of Smbor indices and linear regression model. Table 6, illustrates the alignment of observed and real data points is created. Furthermore, complimentary graphs 22-27 are supplied to illustrate the precision and accuracy of each result in conjunction with the associated error, allowing for a thorough comprehension of the measures’ dependability and accuracy.
| Property | Exact Value | Observed values | ||||
| SO |
|
mSO | maxSO | minSO | ||
| B.P | 581.3 | 593.48 | 589.20 | 543.30 | 549.82 | 515.38 |
| Pol | 34.25 | 34.79 | 34.31 | 32.89 | 32.321 | 32.80 |
| C | 628 | 557.52 | 562.08 | 517.54 | 489.99 | 513.65 |
| R | 88.62 | 89.94 | 89.40 | 86.21 | 83.43 | 83.45 |
| MW | 83.5 | 89.24 | 89.44 | 85.61 | 84.39 | 84.38 |
| MV | 220.7 | 253.13 | 239.50 | 234.03 | 238.83 | 245.74 |
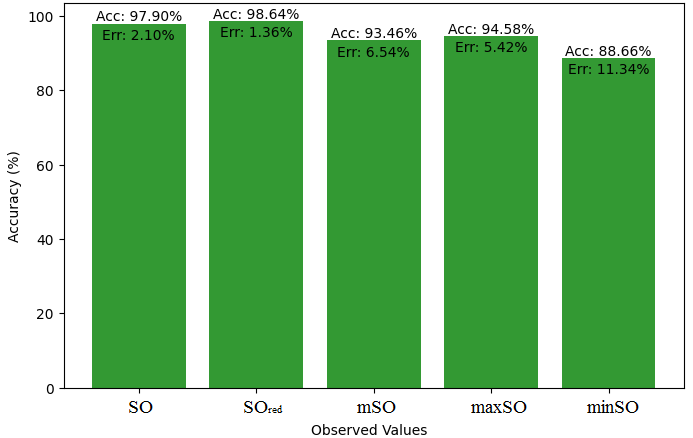
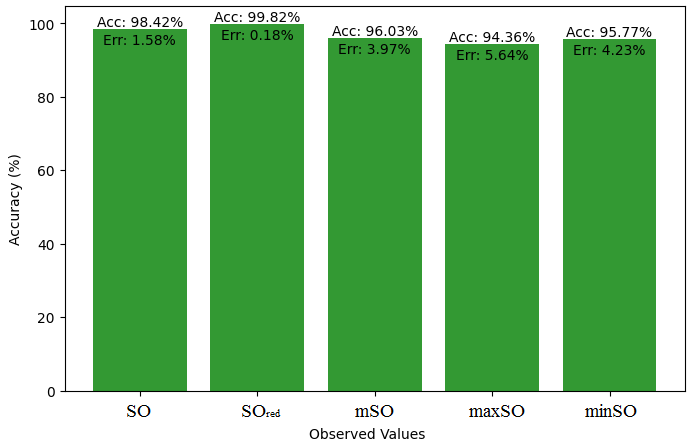
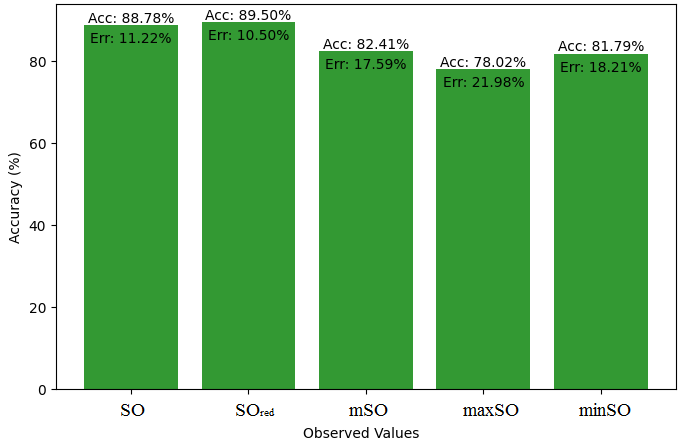
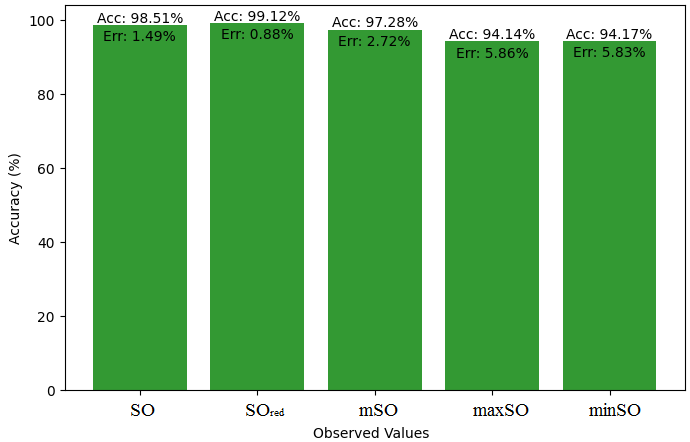
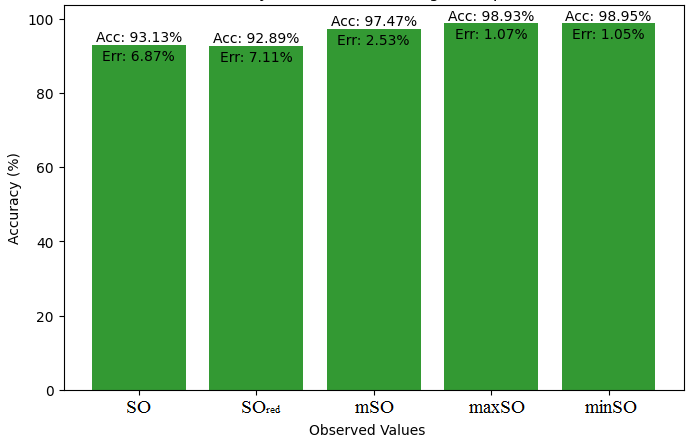
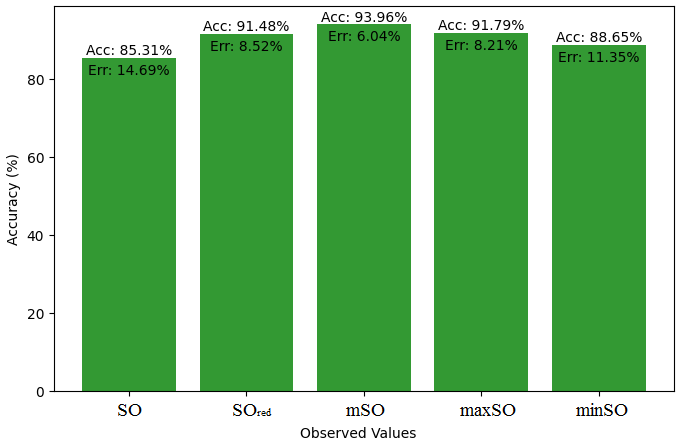
We compare the exact value of the medication naproxenone with the observed values derived from empirical analysis in this subsection. A comprehensive Table 7 is created, showing the agreement between observed and real data points. Furthermore, graphical depictions 28-33 are incorporated to illustrate the precision of every number in conjunction with its associated error, providing valuable perspectives on the dependability and uniformity of the measurements.
| Property | Exact Value | Observed values | ||||
| SO |
|
mSO | maxSO | minSO | ||
| B.P | 372.3 | 361.29 | 342.35 | 404.83 | 360.31 | 405.19 |
| Pol | 26.17 | 25.38 | 24.90 | 26.98 | 27.35 | 25.65 |
| C | 262 | 277.62 | 245.15 | 313.99 | 334.11 | 269.09 |
| R | 68.43 | 66.06 | 64.78 | 69.94 | 71.21 | 66.56 |
| MW | 64.3 | 72.19 | 70.13 | 75.28 | 76.16 | 74.26 |
| MV | 213.5 | 199.49 | 197.25 | 215.44 | 211.35 | 196.58 |


Here, we will compare the exact value of the medication indomethacin with the observed values obtained from empirical research in this subsection. A detailed Table 8 is shown that shows how the observed and real data points line up. In addition, graphs 34-39 that show each value’s accuracy and related error are included, providing a visual depiction of the measures’ dependability and precision.
| Property | Exact Value | Observed values | ||||
| SO |
|
mSO | maxSO | minSO | ||
| B.P | 499.4 | 616.71 | 596.21 | 613.38 | 562.45 | 539.86 |
| Pol | 36.4 | 35.73 | 34.57 | 35.87 | 32.74 | 34.39 |
| C | 506 | 585.51 | 571.08 | 620.56 | 502.98 | 568 |
| R | 94.81 | 125.59 | 90.10 | 94.45 | 85.34 | 90 |
| MW | 83.3 | 90.94 | 90.11 | 90.84 | 85.08 | 86.63 |
| MV | 275.6 | 258.49 | 241.21 | 243.44 | 241.12 | 256,66 |

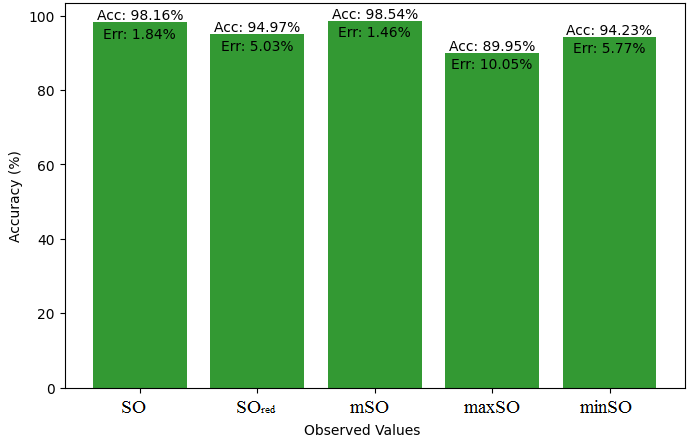
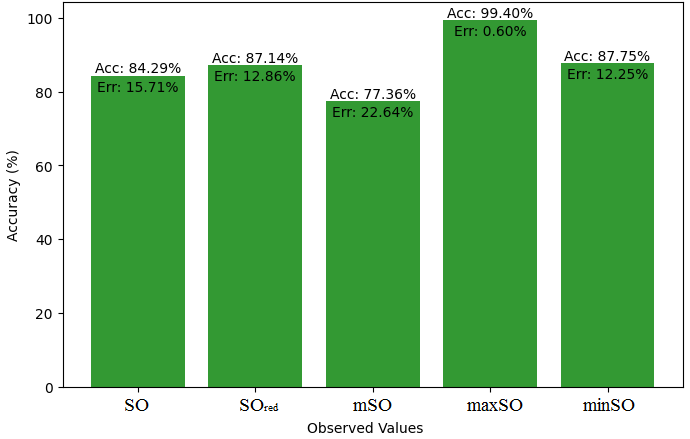
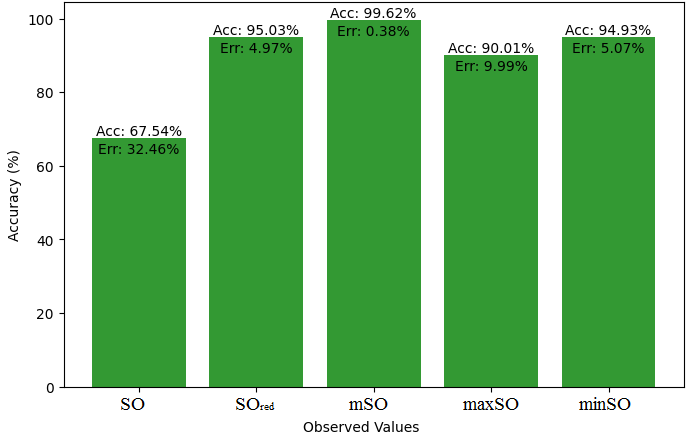

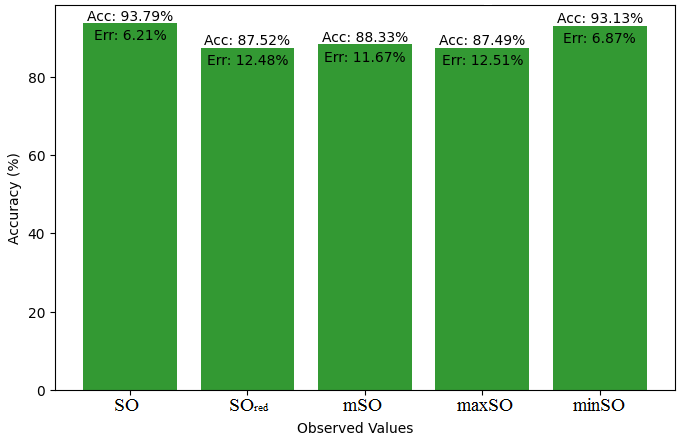
This subsection compares the exact value of the medication famotidine with the observed values with the help of linear regression model. A comprehensive Table 9 is created, showing the alliance between observed and real data points. Moreover, Figures 40-45 are included to demonstrate the precision and accuracy of every result in conjunction with the corresponding error percentage, so enabling a thorough comprehension of the dependability and accuracy of the measurements.
| Property | Exact Value | Observed values | ||||
| SO |
|
mSO | maxSO | minSO | ||
| B.P | 662.4 | 451.18 | 447.44 | 446.20 | 455.06 | 411.31 |
| Pol | 31.66 | 29.03 | 28.91 | 28.75 | 29.22 | 26.04 |
| C | 469 | 385.98 | 380.07 | 374.81 | 392.57 | 282.67 |
| R | 80.46 | 75.30 | 75.26 | 74.80 | 76.17 | 67.62 |
| MW | 100.3 | 78.79 | 78.40 | 78.37 | 79.25 | 74.82 |
| MV | 191.7 | 220.26 | 215.45 | 221 | 221.65 | 199.32 |
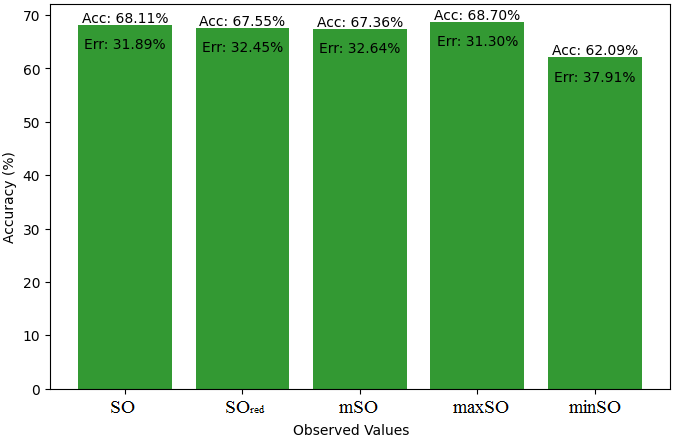

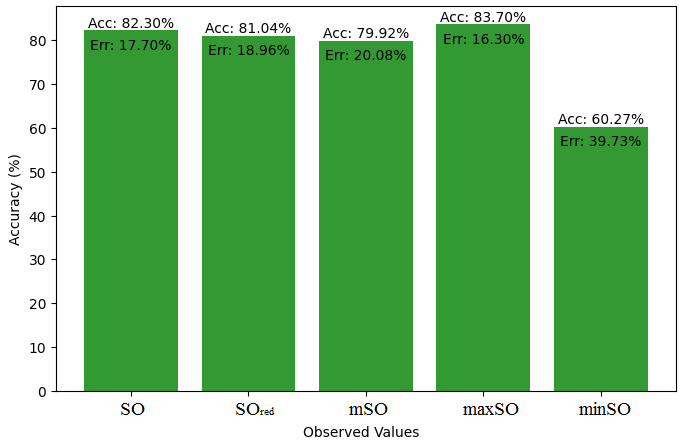
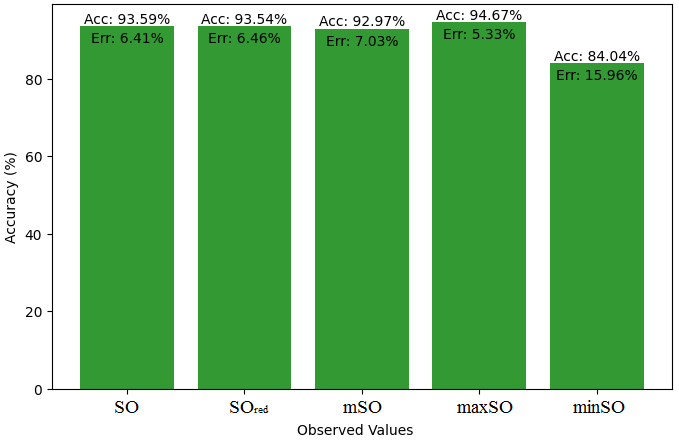
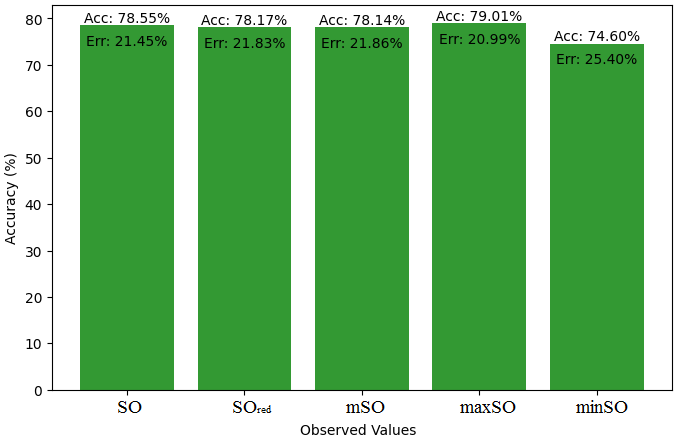
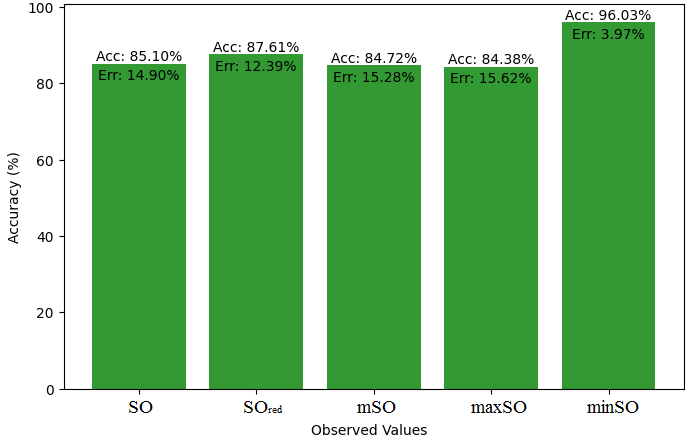
This subsection presents a comparative study between the exact value of the medication etodolac and the observed values derived from empirical research. A detailed table 10 that shows how the observed and real data points line up is provided. Furthermore, Figures 46-51 show each value’s accuracy together with the corresponding error percentage are included, providing information about the consistency and dependability of the measurements.
| Property | Exact Value | Observed values | ||||
| SO |
|
mSO | maxSO | minSO | ||
| B.P | 507.9 | 533.94 | 536.99 | 399.76 | 505.6 | 484.77 |
| Pol | 31.66 | 32.38 | 32.32 | 26.77 | 30.87 | 30.81 |
| C | 400 | 485.74 | 495.04 | 306.54 | 444.53 | 445.72 |
| R | 80.46 | 83.82 | 84.19 | 69.34 | 80.58 | 80.41 |
| MW | 84.9 | 84.86 | 85.45 | 74.90 | 81.99 | 81.57 |
| MV | 248.3 | 239.37 | 230.95 | 214.76 | 230.81 | 232.08 |
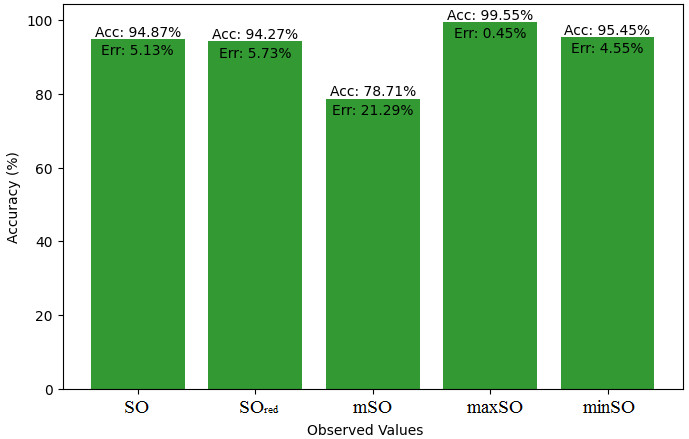
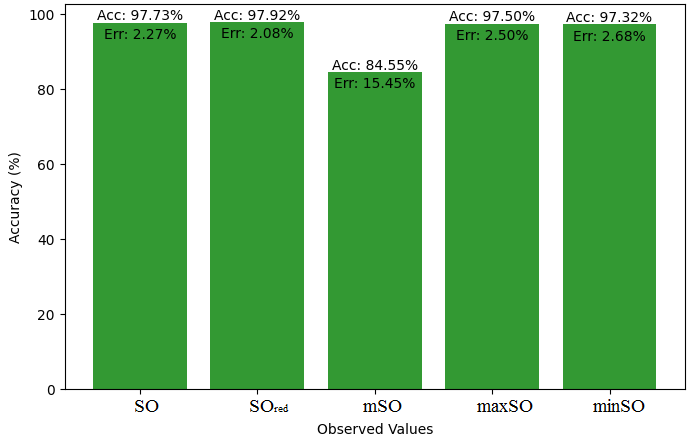
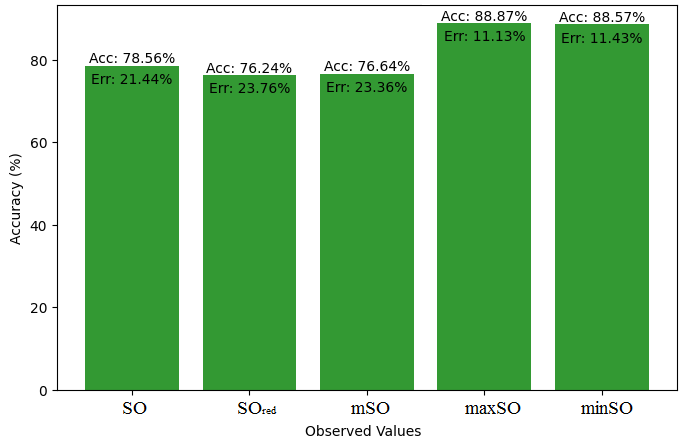
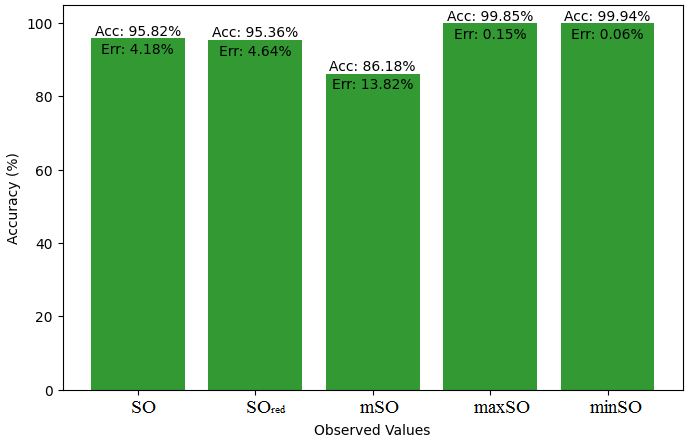
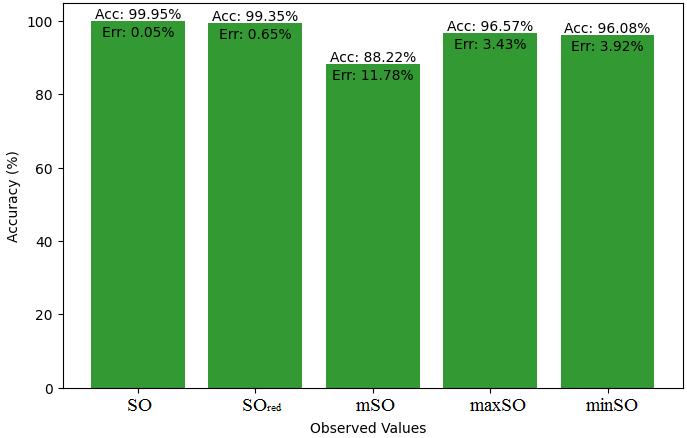
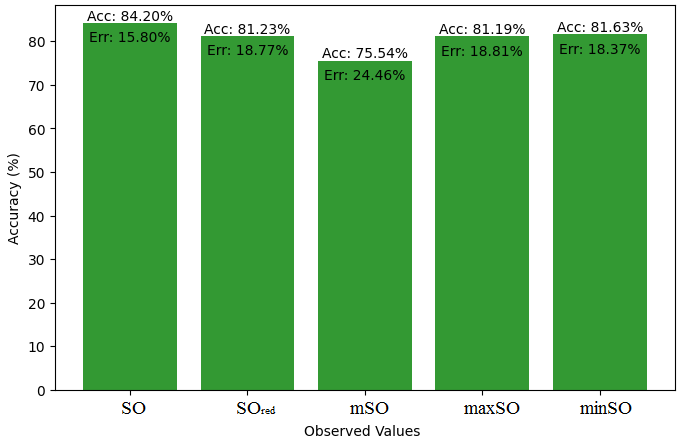
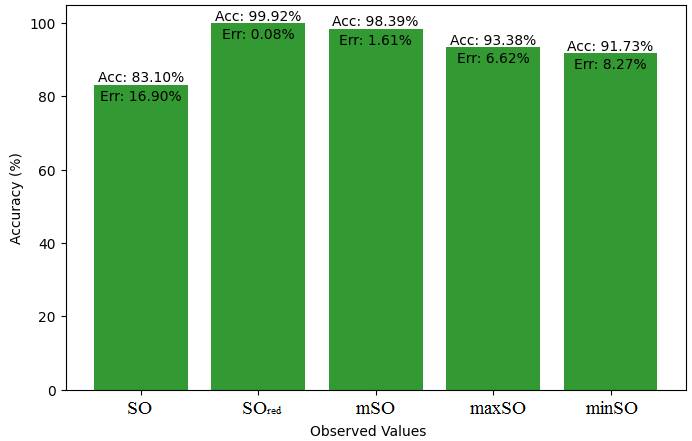
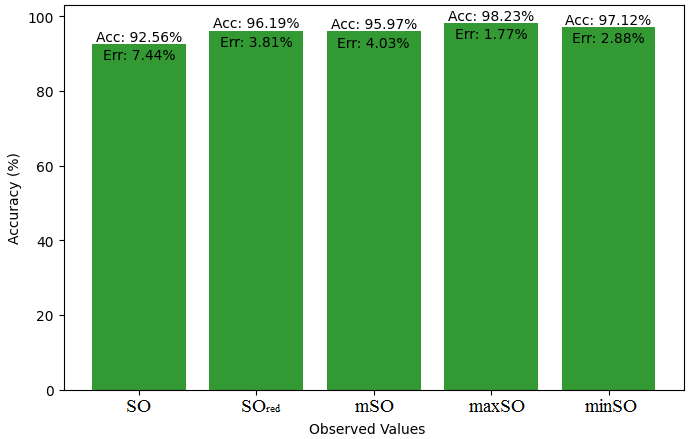
We start a comparative analysis in this sub section between the theoretical value of Piroxicam Drug and the observed values obtained from empirical study. A detailed Table 11 is prepared, which shows the observed and actual data points alignment. Figures 52-57 give the correctness of each value with the corresponding error percentage, thereby giving a detailed assessment of the measures’ reliability and accuracy.
| Property | Exact Value | Observed values | ||||
| SO |
|
mSO | maxSO | minSO | ||
| B.P | 568.5 | 472.41 | 568.07 | 559.34 | 530.87 | 521.50 |
| Pol | 32.27 | 29.89 | 33.50 | 33.57 | 31.7 | 33.20 |
| C | 611 | 411.58 | 534.95 | 541.12 | 470.51 | 527.24 |
| R | 87.04 | 77.49 | 87.29 | 88.10 | 82.78 | 86.81 |
| MW | 91.3 | 80.35 | 87.90 | 86.81 | 83.36 | 84.85 |
| MV | 229.8 | 225.16 | 236.34 | 236.18 | 235.39 | 248.47 |
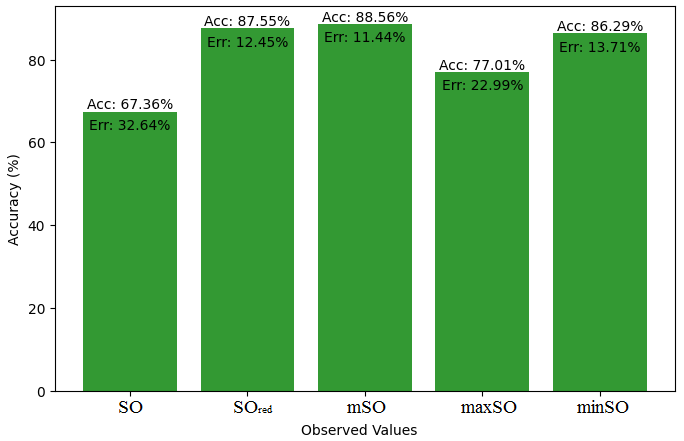
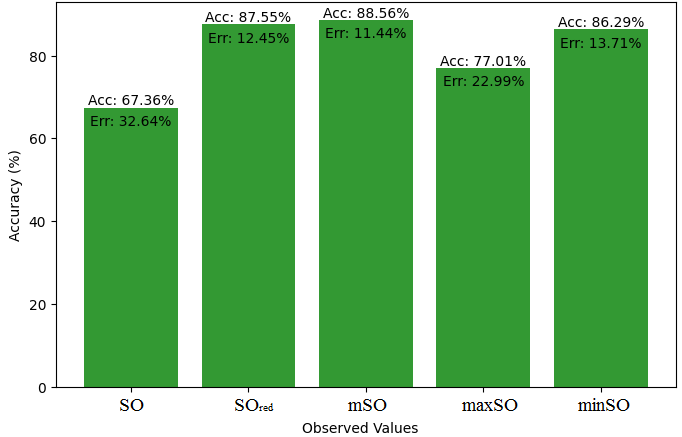
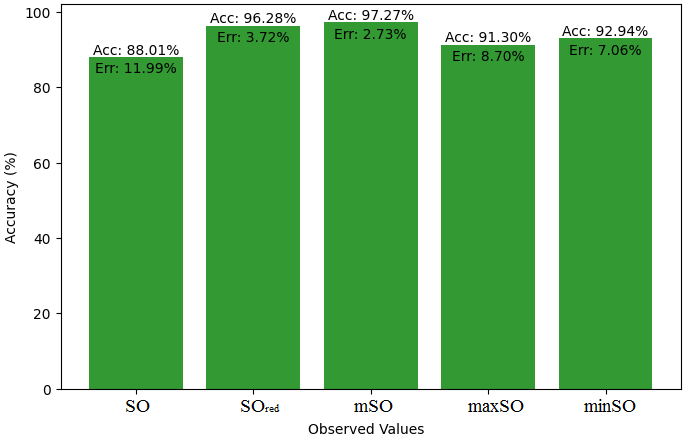
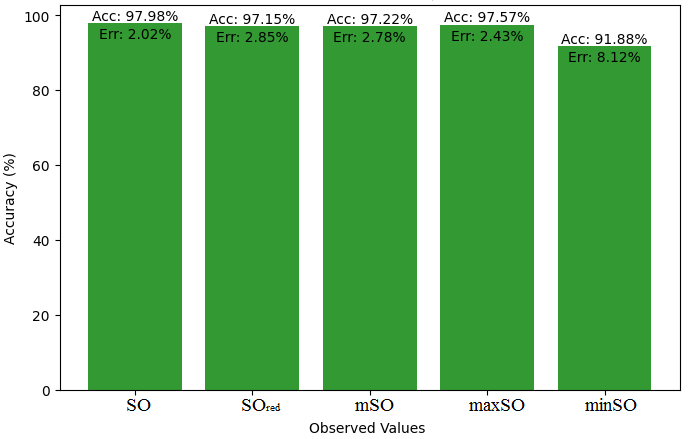
The topological index allows for the assignment of a single number to a structure. To understand the connection between property and quantitative structure activity, topological indices need to be known. Our work shed light on the connections of physicochemical properties of NSAIDs with various Sombor index versions, thereby showing the complex interrelation between these variables. We have ascertained the direction and strength of correlations between specific pharmacological properties and the generated topological indices by using machine learning techniques to compute and analyze the observed values. The following numbers indicate the underlying drugs’ best accuracy rate.
| Drug | Sombor Verson | Property | Accuracy | Error |
| Ketorolac | maxSO | C | 99.22% | 0.78% |
| Diclofenac | minSO | Pol | 99.64% | 0.36% |
| Naproxen | mSO | B.P | 99.81% | 0.19% |
| Meloxicam |
|
R | 99.12% | 0.88% |
| Nabumetone | maxSO | MV | 99.09% | 0.88% |
| Indomethacin | mSO | R | 99.62% | 0.38% |
| Famotidine | minSO | MV | 96.03% | 3.97% |
| Etodolac | minSO | R | 99.94% | 0.05% |
| Piroxicam |
|
B.P | 99.92% | 0.08% |
These results are, therefore, very important in our understanding of how physicochemical properties of drugs play a role in the molecular structure and behavior of drugs in biological systems. The results have very practical applications for optimization purposes, medication development, and pharmacological outcome prediction and are, therefore, very important contributions to the pharmaceutical research field. These results can be expanded upon by additional study to improve drug development techniques and the pharmaceutical industry’s capacity to provide stronger and more effective medications
Physicochemical properties of drugs have been taken from ChemSpider. research data repositories can be found at www.chemspider.com
The authors would like to gratefully acknowledge the critical and constructive comments made by the reviewers which has elevated the standards of the paper significantly. They also acknowledge their co-researcher Ms. Phebe Sarah George for her inputs which refined the content of this paper.
The authors declare no conflict of interest.
1970-2025 CP (Manitoba, Canada) unless otherwise stated.