
Cracks in reinforced concrete are the result of the release of excessive internal deformation energy of the concrete material, the cracks abate the peak value of the tensile stress in the cross-section at that location, so that the deformation energy stored in the structure is below a certain limit, and the reduction of the internal deformation energy of the material through the cracks is an intrinsic property of the concrete material [10,12]. It is quite a common phenomenon that many concrete structures, masonry structures and other building structures show different degrees and forms of cracks during construction and use. The emergence of cracks has become a “common disease” and “frequent disease” of concrete structure, which is a technical problem that has long plagued construction engineers and technicians, and it is difficult to avoid the emergence of cracks in concrete [4,3]. In actual engineering practice, the cracks in the concrete structure is too wide not only affect the beauty of the building structure, but also when the crack width reaches a certain degree, it affects the normal use of the structure and durability, often caused by the user’s uneasiness, but also lead to the corrosion of reinforcing steel in the concrete [14,15]. If it is in a humid environment, it will also accelerate the aging of concrete, greatly reduce the bearing capacity of the building, significantly reduce the durability and safety of the concrete structure, often endangering the safety of the main structure, causing great safety hazards to the building structures, and causing significant economic losses to society [16,26,19]. For a long time, in the detection practice of building cracks, the traditional contact detection method is the main one, in which the inspector carries the equipment and gets close to the crack detection area in order to carry out the crack detection work, but there are great limitations and drawbacks in using the contact detection method for crack detection [7,21,18]. Deep learning based civil engineering crack detection method can solve the practical difficulties of civil engineering practice, it can make the detection cost lower, can effectively reduce the measurement error, greatly improve the work efficiency, and on this basis, realize the real-time online high-precision measurement, multi-dimensional civil engineering structure damage identification and assessment, in order to satisfy the modern society’s requirements for the intelligence of building measurement [1,23,9].
In this paper, an improved crack detection method is proposed in combination with YOLO v8s target detection algorithm, aiming to improve the crack recognition accuracy and realize the high-precision detection and localization of cracks. Full-dimensional dynamic convolution is introduced to improve the visibility of fine cracks. The optimized MA-ECA channel attention module is used to construct the C2f-MA to deepen the texture feature information, highlight the crack’s own characteristics, and suppress the interference of irrelevant background. The WIoU loss function is chosen to increase the model’s attention to important and difficult-to-detect targets to improve its detection ability for cracks. Finally, combined with the damage determination standard, a crack damage degree assessment method based on BP neural network is proposed. The results of the crack detection model in this paper are visualized through experiments and the performance of the proposed method is evaluated.
Detection of cracks on the surface of buildings is a very important part of the engineering construction process. Zawad et al. [28] emphasizes the importance of detecting and repairing cracks in engineering structures, points out the challenges of existing crack detection techniques, and critically analyzes and compares existing image processing based crack detection techniques for civil engineering structures through literature review, and the results show that convolutional neural network based crack detection algorithms based on camera images of general structures have high detection accuracy. Yang et al. [27] proposes a deep convolutional neural network based migration learning method for crack detection in civil engineering infrastructure and verifies the superior performance of the proposed method through experiments, which can efficiently and accurately detect a wide range of cracks and provide technical guarantee for ensuring the safety of bridges, highways and other infrastructure. Kim and Cho [17] proposed an automatic concrete surface crack pattern detection technique based on convolutional neural network (cnn) in field environment, and verified the robustness and applicability of the proposed method through empirical analysis, which can effectively detect and manage a large number of civil engineering structures. Hsieh and Tsai [11] systematically reviews a variety of machine learning-based crack detection methods, highlights the current trend of pixel-level crack segmentation, and points out that the false-positive problem must be solved in order to further improve the machine learning-based crack detection model through the performance comparison of crack segmentation models. Cha et al. [6] proposes a deep learning-based convolutional neural network crack damage detection method, which is verified by image training and testing to have superior performance, and is able to better detect civil infrastructure defects, which helps to replace on-site inspections carried out manually and improve the safety of buildings.
It is of great significance to know how to perform damage assessment, structural safety analysis, and remaining life rating considering uncertainty in engineering analysis. Mohandes et al. [20] developed a multidimensional fuzzy-based five-dimensional safety risk assessment model to improve the reliability and safety of construction projects, using a green building construction project in Hong Kong as an example, and the results confirmed that the developed model provided a comprehensive ranking system for the safety risks present in the project. Qiu and Zhan [24] proposed a civil engineering structural damage identification method based on Benchmark numerical model and parallel convolutional neural network, and the feasibility of the proposed method was confirmed by algorithmic model testing, with good damage identification performance, which is of great significance for the structural inspection of civil engineering projects and the development of related risk prevention programs. Shang et al. [25] proposed a bridge vibration damage detection strategy based on deep convolution denoising self-coder, and evaluated the practicality of the model through numerical simply supported beam model and experimental continuous beam model, which is able to meet the structural damage detection under the exposure environment, and has a certain reference value for the research of civil engineering damage assessment. Huang et al. [13] designed several comparative experiments to verify that the proposed damage identification method for frame structures based on multi-channel data fusion and convolutional neural network performs better than the damage identification method that relies solely on single-channel data, and can effectively improve the accuracy of damage identification for complex frame structures. Anaissi et al. [2] proposed a new algorithm for structural damage detection and assessment of bridges and other structures based on tensor analysis, and the results verified the effectiveness and feasibility of the proposed algorithm through the application of real bridges and laboratory samples to assess the effectiveness and feasibility of the proposed algorithm, and it is a certain reference significance for the prediction of structural health of civil engineering.
Target detection is an important computer vision task whose goal is to accurately identify all the targets contained in a given image or video and achieve precise localization.
Currently, target detection algorithms are mainly categorized into three types: One-Stage, Two-Stage and Anchor-free. These three types have different algorithmic advantages: the One-Stage model has faster training and inference speed, but in terms of target localization and bounding box accuracy, the One-Stage model may be slightly inferior to the Two-Stage model.The Two-Stage algorithm performs well in terms of accuracy, but since the Two-Stage algorithm is generally more complex, the model have more parameters and their training and inference costs are higher. Compared to the One-Stage and Two-Stage models, the Anchor-free model is a bit later in development, but this model also has excellent performance and can better adapt to various shapes of targets because it is not bound by anchor frames.
Unlike classification tasks, target detection requires not only recognizing objects in an image, but also accurately locating the positions of these targets. Therefore, when evaluating a target detection model, both the model’s localization precision and classification accuracy need to be considered. In target detection, accuracy, recall, mean average precision (mAP), billion floating-point operations per second, number of model parameters, and number of frames processed per second are often used to comprehensively evaluate the performance of a model.
Accuracy: Accuracy in target detection is the proportion of positive classes predicted by the model that are true positive classes. In target detection tasks, accuracy is often used in conjunction with target localization, implying the ability of the model to correctly predict the target and localize it correctly. Specifically, the calculation of accuracy involves two key metrics: true positive examples (TP) and false positive examples (FP). True cases are the number of samples that the model correctly predicts as positive classes, while false positive cases are the number of negative class samples that the model incorrectly predicts as positive classes. Accuracy is calculated by the formula: \[\label{GrindEQ__1_} Precision=\frac{TP}{TP+FP} . \tag{1}\]
The value of accuracy ranges from 0 to 1. The closer the value is to 1 means that the model is more accurate in predicting the positive class. In target detection, a high accuracy rate means that the model performs more reliably in identifying and localizing targets.
Recall: recall in target detection is the ratio of positive class samples successfully detected by the model to all actual positive class samples. In a target detection task, recall measures the model’s ability to recognize positive class samples, i.e., whether the model is able to find as many targets in the image as possible and classify them correctly. The calculation of recall involves two key metrics: true cases (TP) and false negative cases (FN). True cases are the number of positive class samples that the model succeeds in correctly detecting, while false negative cases indicate the number of positive class samples that the model fails to successfully detect. Recall is calculated by the formula: \[\label{GrindEQ__2_} Recall=\frac{TP}{TP+FN} . \tag{2}\]
The values of recall also range from 0 to 1, with values closer to 1 indicating that the model is better at detecting positive class samples.
Mean Average Precision Mean (mAP): mAP in target detection is a comprehensive evaluation metric to measure the performance of a target detection model. The mAP is derived by calculating (AP) for each category and then averaging the APs across all categories. First, for each category, Precision-Recall curves were plotted. Precision denotes the proportion of true positive examples among the detected targets, while Recall denotes the proportion of all true positive examples that were detected. The AP value for the category is obtained by calculating the area under the Precision-Recall curve. Finally, the APs of all categories are averaged to obtain mAP. The mAP is an important metric for comprehensively evaluating the performance of a target detection model in multi-category scenarios, and the higher its value, the better the detection performance of the model on each category. The formula for mAP is: \[\label{GrindEQ__3_} AP_{c} =\int _{0}^{1}precision_{c} \left(recall\right)d\left(recall\right), \tag{3}\] \[\label{GrindEQ__4_} mAP=\frac{1}{N} \sum _{c=1}^{N}A P_{c} , \tag{4}\] where \(AP_{c}\) denotes the \(AP\) value of category \(C\), which is obtained by calculating the area under the Precision-Recall curve. In the calculation of \(mAP\) this will be averaged over all categories \(AP\) and \(N\) denotes the total number of categories.
Convolutional neural network based target detection algorithms are mainly categorized into one-stage [8] algorithm based on regression and two-stage algorithm based on candidate region, one-stage algorithm has faster detection speed, while two-stage algorithm possesses higher detection accuracy. yolov8’s is the latest target detection algorithm of the current yolov series, it adopts a new model architecture and uses a new convolutional layer and detection head.
YOLOV uses the CSPDarknet architecture, which combines the advantages of csp and darknet, as its backbone network. CSPDarknet drastically reduces the use of repetitive information, minimizing the number of parameters in the model and the value of GFLOPs while improving the accuracy and inference speed of the model as much as possible. In addition, to further improve the model performance, YOLOV8 introduces an innovative c2f module [22]. It enables the model to obtain gradient information in more dimensions while maintaining the model complexity.
FPN has a bottom-up feature extraction process and a top-down feature fusion process. The bottom-up structure aims at mining hidden features from shallow to deep layers, while the top-down structure realizes the fusion of features at different scales by transferring the high-level semantic information to the bottom feature layer, this fusion can help the model to capture both the details of the target and the global semantic information. In order to achieve both correct determination of the target category and accurate localization of the target location when detecting the input image, YOLOV8 adopts a Decoupled Head similar to YOLOVX, which separates the regression branch from the prediction branch to achieve faster convergence speed and detection results.
In this chapter, 500 images of cracks with complex backgrounds from the inspection reports are screened for the production of the crack target detection dataset, which will be named, and these images have a variety of disturbing factors, such as shadows, artificially drawn lines, weeds, and so on. To ensure the quality and consistency of the dataset, the dataset is preprocessed as follows:
1) Scale the image resolution to 640\(\mathrm{\times}\)640 to ensure that the model can handle uniform size inputs during training.
2) LabelImg image annotation software was applied to accurately label the crack portion of each image to provide the model with accurate label information for supervised learning.
3) In order to increase the number of samples in the dataset and improve the robustness of the model, technical means such as brightness and contrast adjustment, rotation and adding motion blur were used to expand the number of samples in the dataset to 2000, which provided more samples of training data.
4) In order to evaluate the performance of the model, the dataset is divided into a training set and a validation set in the ratio of 8:2, where 80% of the data is used to train the model, and 20% of the data is used to validate the accuracy and generalization ability of the model.
YOLO v8 network adopts the hyper-parameter adjustment mechanism to realize precise control of the depth and width of the network structure by adjusting the key parameters of depth and width, which provides a total of 5 versions such as n, s, m, l, x, etc., each with different network depth and width.
In order to comprehensively consider the factors of detection performance and model size, the s version is chosen as the base model.The YOLO v8 algorithm achieves simultaneous detection and localization of multiple targets in an image by dividing the image into grids and predicting the bounding box and category information of the targets in each grid cell. Its network structure includes convolutional layers, pooling layers, and fully connected layers, etc., and achieves accurate recognition and localization of targets through multi-layer feature extraction and regression operations.
Currently, although YOLOv8s algorithm shows excellent performance in target detection tasks, there are still some bottlenecks and room for improvement when performing crack detection tasks in complex backgrounds:
1) Poor feature extraction capability for problems such as crack minuteness and ambiguity.
2) The aspect ratio increment introduced by the complete intersection and union ratio (CIoU) loss function may have some ambiguity when dealing with crack detection in complex backgrounds. In addition, when there is an error in data labeling, the prediction accuracy of crack location is also reduced.
3) Excessive background noise interference in the image and the presence of a large amount of invalid information lead to the lack of competitiveness of fine cracks in the detection task, thus affecting the effectiveness of crack detection.
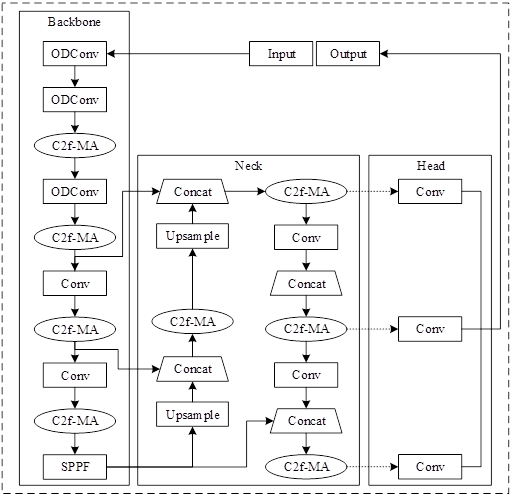
This chapter proposes a concrete crack detection algorithm YOLO v8sWOMA based on improved YOLOv8s, which mainly introduces full-dimensional dynamic convolution, introduces improved MA-ECA into the C2f module (C2f-MA) to enhance the semantic information of the crack features, and adopts a faster computational loss function (WIoU) to solve the problem of recognizing low-quality samples so as to improve the algorithm’s The structure of YOLO v8s-WOMA algorithm is shown in Figure 1.
Full-dimensional dynamic convolution is a convolution operation that introduces a multidimensional attention mechanism through a parallel strategy to enhance the convolution kernel’s ability to learn complementary attentions in the four dimensions of space.ODConv achieves a better handling of the variability between dimensions in the input data by gradually and progressively applying different attention weights to the convolution operation on the dimensions of position, channel, filter, and kernel, and captures more rich contextual information, which further improves the feature extraction capability of convolution and outputs a more expressive crack feature map. For dynamic convolution, the convolution operation is performed by linearly weighting multiple convolution kernels, and these weight values are related to the input, so dynamic convolution is input-dependent, and ODConv continues the definition of dynamic convolution.
\[\label{GrindEQ__5_} y=\left(\alpha _{w1} W_{1} +\cdots +\alpha _{wn} W_{n} \right)x , \tag{5}\] \[\label{GrindEQ__6_} y=\left(\alpha _{w1} \alpha _{f1} \alpha _{c1} \alpha _{s1} W_{1} +\cdots +\alpha _{wn} \alpha _{fn} \alpha _{cn} \alpha _{sn} W_{n} \right)x , \tag{6}\] where \(\left\{W_{1} ,\cdots ,W_{n} \right\}\) is the convolution kernel, \(n\) is the number of convolution kernels, \(\alpha _{wn}\) is the attention scalar of the convolution kernel, and \(\alpha _{fn}\), \(\alpha _{cn}\), and \(\alpha _{sm}\) denote the learnable weights for the output channel, input channel, and spatial dimension, respectively.
Due to the problem of fine blurring of cracks in crack detection, the first three conventional convolutions in the YOLOv8s backbone network are replaced with ODConv in this chapter.The ODConv module can obtain richer contextual information, better enhance the convolutional feature extraction capability, obtain more effective fine crack feature information, and more accurately distinguish cracks from background, thus improving the detection capability of fine cracks. Optimize the problem of difficult fine fuzzy feature extraction under complex background.
The C2f-MA module consists of the C2f module and the improved MA-ECA module in series.The MA-ECA module is a lightweight and efficient channel attention module based on the improved SE module. The module keeps the channel dimensions of the input feature maps unchanged, utilizes a one-dimensional convolution operation to capture inter-channel correlations in a local range, and adaptively adjusts the size of the convolution kernel to fit different contextual information.
Maximum pooling operation is introduced in the ECA module to enhance the sensitivity to texture feature information and better preserve the salient features of the image to reduce the influence of invalid information. The feature maps output from the C2f module are respectively subjected to maximum pooling and average pooling operations, and the pooled feature maps are summed to generate feature maps with richer semantic information, which makes the model pay more attention to the important feature information in the channel while suppressing the irrelevant feature information. It has better effect on extracting fine fuzzy crack features under complex background. For the detection of small fuzzy cracks in complex backgrounds, the C2f-MA module enables the model to focus on more important feature information and reduces the influence of background noise on the model. By enhancing the semantic information of the feature map, the detection accuracy of cracks under complex background is effectively improved.
The loss function of bounding box regression (BBR) is crucial for the target detection task, and the YOLOv8s network adopts the CIoU loss function as the target localization function.The CIoU loss function introduces three geometric factors, namely, the overlap area, the distance from the centroid, and the aspect ratio of the bounding box regression.However, the aspect ratio, as a relative value, does not allow us to determine the size or shape information of the cracks, and this loss function does not consider the balance of difficult and easy samples. Therefore, this chapter introduces the WIoU loss function [5], which proposes a dynamic non-monotonic focusing mechanism to assess the quality of anchor frames by using “outliers” instead of IoU. As there may be some errors in the labeling process of the dataset in this chapter, resulting in low-quality examples, the WIoU loss function provides a sensible gradient gain allocation strategy, which can reduce the competitiveness of high-quality anchor frames, reduce the harmful gradient generated by low-quality examples, and solve the problem of identifying low-quality samples, so that the network can more accurately detect low-quality crack samples. In addition, since WIoU does not involve the computation of aspect ratios, the computational speed of WIoU is better than that of CIoU, so WIoU performs better relative to CIoU, which improves the detection performance of the target detection neural network. The CIoU and WIoU loss functions are shown in Figure 2.

In Figure 2, \(B_{pred}\) is the crack prediction box, \(B_{true}\) is the crack true labeling box, and \(Wg\) and \(Hg\) are the sizes of the minimum closure box.CIoU and WIoU are calculated as follows: \[\label{GrindEQ__7_} CIoU=IoU-\frac{d^{2} }{c^{2} } -\alpha \beta , \tag{7}\] \[\label{GrindEQ__8_} WIoU=\exp \left(\frac{d^{2} }{\left(c^{2} \right)^{*} } \right) , \tag{8}\] where \(IoU\) is one of the most commonly used performance metrics in target detection, denotes the ratio of the overlapping area of the real labeled frame and the predicted frame to the total area, \(d\) is the distance between the centroids of the two frames, \(c\) is the diagonal length of the smallest area that contains both frames, \(\alpha\) denotes the trade-off parameter, and \(\beta\) denotes the consistency of the aspect ratios of the two frames. * indicates that the operation separates \(W_{g}\) and \(H_{g}\) from the computational graph. The IoU is calculated as follows: \[\label{GrindEQ__9_} IoU=\frac{\left|B_{pred} \cap B_{true} \right|}{\left|B_{pred} \cup B_{true} \right|} . \tag{9}\]
The optimal BP neural network model consists of 6 fully connected layers, the first layer and the second layer have the same number of neuron nodes, both are 1024. The second, third and fourth layers have the same number of neuron nodes, all of which are 512. The last layer, the output layer, has a node number of 1. \(J\left(W,b\right)\) is the value of the deviation of the data in the output layer from the real data, i.e., the cost function, whose specific formula is shown in Eq. (10): \[\label{GrindEQ__10_} J\left(W,b\right)=\frac{1}{n} \sum _{i=1}^{n}L (\hat{y}(i),y(i)) , \tag{10}\] where, \(n\) is the amount of data in each batch during the training of the BP neural network, \(\hat{y}(i)\) and \(y(i)\) are the true and predicted values of the \(i\)th sample in the batch training respectively, and \(L(\hat{y}(i),y(i))\) is the method of calculating the loss value used in the BP neural network.
The mean square error (MSE) and Huber loss function are used in the BP neural network, respectively \(\delta\). in the Huber loss function is a hyper-parameter, which can be selected according to the training situation. When the value of \(\delta\) is chosen close to infinity, the Huber loss value is close to MSE and when the value of \(\delta\) is chosen close to 0, the Huber loss value is close to the Mean Absolute Error (MAE). \[\label{GrindEQ__11_} L(\widehat{y}(i),y(i))=(y(i)-\hat{y}(i))^{2} , \tag{11}\] \[\label{GrindEQ__12_} L_{\delta } (\hat{y}(i),y(i))=\left\{\begin{array}{ll} {\frac{1}{2} (y(i)-\hat{y}(i))^{2} }, & {\left|y(i)-\hat{y}(i)\right|\le \delta }, \\ {\delta \left|y(i)-\hat{y}(i)\right|-\frac{1}{2} \delta ^{2} }, & {otherwise} ,\end{array}\right. \tag{12}\] where, \(\frac{\partial J\left(W,b\right)}{\partial b^{\left[L\right]} \left(\partial W^{\left[L\right]} \right)}\) stands for the partial derivatives of the bias and weights of the neurons in layer \(L\), respectively, in order to update the neuron bias and weights during training.BP neural networks iteratively update the bias and weights of neurons in each layer during training in order to bring the value of the cost function close to 0. By using such an approach, the BP neural network is able to accurately simulate the nonlinear characteristics of any data, and thus make the most accurate predictions for the unknown data of the same distribution. The BP neural network is used in the paper to model the nonlinear features of any data accurately to make the most accurate prediction of unknown data with the same distribution.
In this paper, the root mean square error (RMSE) of BP neural network on the validation set is used to evaluate its goodness of fit and prediction accuracy, which is calculated as shown in Eq. (13). \[\label{GrindEQ__13_} RMSE=\sqrt{\frac{1}{n} \sum _{i=1}^{n}\left(\hat{y}(i)-y(i)\right)^{2} } , \tag{13}\] where \(n\) is the number of data in the validation set in the ten-fold cross-validation, and the size is 40. \(y(i)\) and \(\hat{y}(i)\) are the theoretical value of the \(i\)th sample in the validation set and the predicted value of the BP neural network, respectively. Finally, according to the performance of BP neural network on the validation set, three BP neural network models with different structures (different number of layers, number of neurons, activation function, etc.) were selected.
The prediction accuracy and stability of the BP neural network will be determined by its performance on the test set. In the paper, the \(R^{2}\), RMSE, and MAE of the BP neural network prediction results are considered to select the optimal model. The value of \(R^{2}\) reflects the goodness of fit of the BP neural network model to the global data, and its value range is from 0 to 1, the closer to 0 indicates that the BP neural network fits the goodness of fit more poorly, and vice versa, the better.The values of MAE, RMSE reflect the prediction accuracy of the BP neural network in the test set, and its value distribution is from 0 to infinity, and the closer to 0 indicates that the accuracy is more high, and vice versa, the poorer.
In order to further verify the effectiveness of the algorithm in this chapter for the improvement of YOLOv8 network, the algorithm in this paper is compared with the classical networks Faster R-CNN, R-FCN, EfficientDet, RetinaNet, SSD, YOLOv4, YOLOv7 for the comparison experiments on the CBP dataset. Among them, Faster R-CNN and R-FCN are classical two-stage detection algorithms, which have advantages in robustness and accuracy. EfficientDet, RetinaNet, SSD, YOLOv4, YOLOv7 are the mainstream one-stage detection algorithms in recent years, with smaller number of parameters and faster detection speed.
Eight networks are trained and tested on the CBP dataset. Figure 3 shows the comparison of P-R curves of different networks in the CBP dataset, the mAP values are EfficientDet, SSD, YOLOv4, R-FCN, RetinaNet, YOLOv7, FasterR-CNN, and the algorithm in this paper in order from low to high. The F1 values in descending order are EfficientDet, SSD, YOLOv4, RetinaNet, R-FCN, YOLOv7, Faster R-CNN, and the algorithm in this paper.

Table 1 shows the performance comparison between this network and other classical networks in CBP dataset, the mAP and F1 values of this algorithm and Faster R-CNN are the highest, but the detection speed of this algorithm is much better than the latter. YOLOv7 has the best detection speed, which is 1.76f/s higher than the FPS of this algorithm, but the detection accuracy is slightly inferior to this algorithm. FPS is the number of frames per second, the larger the value, the faster the algorithm.
| Model | P/% | R/% | m AP/% | F1/% | FPS/(f/s) |
| Faster R-CNN | 92 | 87.9 | 90.2 | 89.8 | 16.74 |
| R-FCN | 87.2 | 83.4 | 84.7 | 85.6 | 25.8 |
| EfficientDet | 78.4 | 76.1 | 77 | 77.4 | 41.65 |
| RetinaNet | 84.9 | 81.8 | 83.8 | 83.7 | 37.93 |
| SSD | 76.5 | 80.2 | 79.5 | 78 | 40.14 |
| YOLOv4 | 82.9 | 84.4 | 83.2 | 83.6 | 38.87 |
| YOLOv7 | 88.3 | 84.5 | 88 | 86.3 | 50.11 |
| This method | 89.3 | 91.3 | 90.3 | 90 | 48.35 |
To verify the superiority of the algorithms in this chapter in deep learning crack detection algorithms, the algorithms in this paper are compared with GT-CNN-1, Improved YOLOv5.1, ST-YOLO, and Improved YOLOv5.2 algorithms on CBP datasets.The GT-CNN-1 algorithm, a CNN-based bridge crack recognition algorithm, uses VGG structures and residual blocks instead of Alexnet structure, which allows the network accuracy to be increased while the false alarm rate is reduced.
The improved YOLOv5.1 algorithm uses a lightweight module combining ShuffleNetv2 and stemblock as the backbone detection network, introduces the CA attention module, and uses a mixture of LogSoftmax and NLLLoss as the bounding-box regression loss function, which provides a better detection effect with a faster operation rate.
ST-YOLO algorithm is a crack intelligent detection algorithm based on YOLOv5 network framework, integrating Swin Transformer and convolutional neural network, which has higher recognition accuracy and better environmental adaptability, and is suitable for actual engineering crack disease detection tasks.
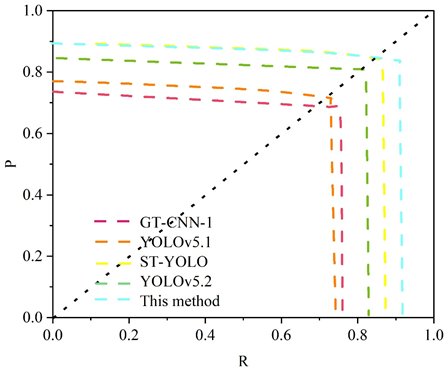
The improved YOLOv5.2 algorithm is a bridge crack detection algorithm based on YOLOv5 and combined with the C3-B (C3-Bottleneck) module, the path aggregation network PAN, and the loss function SIOU-Loss, which has better detection accuracy and detection speed.
Figure 4 shows the comparison results of different algorithms of the same type, the mAP values are GT-CNN-1, Improved YOLOv5.1, Improved YOLOv5 Algorithm.2, ST-YOLO, and the algorithm of this paper in order from low to high. The F1 values in descending order are GT-CNN-1, Improved YOLOv5 algorithm.1, Improved YOLOv5 algorithm.2, ST-YOLO, and the algorithm in this paper. Table 2 shows the performance comparison of this paper’s algorithm with other excellent networks, and this paper’s algorithm performs the best with an accuracy value of 89.6%, which reflects the superiority in deep learning crack detection algorithms.
| Model | P/% | R/% | mAP/% | F1/% |
| GT-CNN-1 | 72.6 | 76 | 73.9 | 74.8 |
| YOLOv5.1 | 76.5 | 74.3 | 75.9 | 75.5 |
| ST-YOLO | 89.4 | 87.4 | 88.7 | 88.4 |
| YOLOv5.2 | 84.8 | 83 | 83.5 | 83.8 |
| This method | 89.6 | 91.1 | 90.5 | 90.3 |
In order to verify the practicality of the detection system, a bridge on the mainline of a city highway was collected, with a total length of 190.0 m and a total width of 26 m. The cracks of the bridge were photographed, and the bridge cracks were measured and the measured values were recorded. When shooting, the crack position is always fixed in the viewfinder frame, and as the distance gets farther, the image is enlarged so that the crack position remains unchanged in the viewfinder frame. The object distance corresponding to the captured image was also recorded in conjunction with a laser rangefinder. Then, the image is inputted into the crack parameter calculation system to calculate the pixel statistics of the cracks and convert them into physical values. The physical values obtained from the calculation are recorded as measured values and compared with the measured values from the detection system in this paper to evaluate the measurement accuracy of this system in real situations.
The cracks are detected and categorized to obtain the crack parameter values in terms of actual length. In order to verify the practicality of the system built in this chapter, the detection results of 10 crack images are randomly selected in this subsection, and their detection results are compared with the actual values respectively, and the comparison results are shown in Table 3. Among them, the crack numbered 1 has the longest length and the crack numbered 9 has the widest maximum width of 1.249 mm.
In order to describe more intuitively the error between the detection value and the actual value obtained by using the above method, the absolute difference between the maximum width, the average width and the length of the cracks is calculated and plotted as a graph, and the absolute difference comparison results are shown in Figure 5, and the fluctuation amplitude of the calculation error of crack length is bigger than that of the maximum width and the average width, but the error of the crack width is not more than 0.1mm, and that of the crack length is not more than 20mm. 20mm, the detection comparison results show that the visualization system built in this chapter can meet the practical application of bridge crack detection.
| Fracture number | Crack maximum width | Fracture mean width | Fracture length | |||
| Detection value/mm | Measured value/mm | Detection value/mm | Measured value/mm | Detection value/mm | Measured value/mm | |
| 1 | 0.545 | 0.538 | 0.522 | 0.506 | 681.301 | 674.798 |
| 2 | 0.836 | 0.793 | 0.822 | 0.801 | 429.301 | 438.501 |
| 3 | 1.042 | 0.99 | 0.982 | 0.945 | 112.601 | 108.398 |
| 4 | 0.796 | 0.759 | 0.755 | 0.741 | 207.497 | 203.901 |
| 5 | 0.315 | 0.331 | 0.27 | 5.145 | 672.201 | 658.011 |
| 6 | 0.25 | 0.236 | 0.205 | 0.199 | 342.502 | 361.301 |
| 7 | 0.71 | 0.719 | 0.683 | 0.702 | 268.401 | 284.898 |
| 8 | 0.905 | 0.881 | 0.858 | 0.823 | 194.703 | 185.998 |
| 9 | 1.249 | 1.195 | 0.974 | 0.996 | 326.901 | 319.197 |
| 10 | 0.264 | 0.243 | 0.241 | 0.229 | 574.803 | 561.805 |

This paper applies the proposed crack detection method for bridge crack damage assessment to check the performance and utility of the method. This paper adopts the quantitative assessment criteria for bridge crack cracking in the Technical Specification for Detection and Assessment of Urban Bridges issued by the Ministry of Housing and Urban-Rural Development of the People’s Republic of China, and divides the bridge crack damage into four grades, which takes into account the length and width of the cracks, as well as the development of the cracks and other factors. The four grades are intact, slight, serious and dangerous, and the quantitative criteria for their assessment are crack width less than or equal to 1.0mm respectively. Crack width greater than 1.0mm and less than 2.0mm. Crack width greater than 2.0mm. Crack width greater than 2.0mm.
Specifically, cracks 1, 2, 4, 5, 6, 7, 8, and 10 were rated as minor damage levels. Although these cracks show some degree of deterioration, they are currently in a relatively stable condition according to the assessment and pose a minor impact on the traffic safety of the bridge. Regular monitoring and inspection is recommended for these slightly damaged cracks to ensure that the cracks do not extend further. When cracks are found to have a tendency to expand or reach a certain level, the necessary maintenance and repair works should be carried out in a timely manner. On the other hand, the technical condition of Cracks 3 and 9 is assessed to be at a severe level of damage, with detection values for the maximum width of the cracks of 1.042 mm and 1.249 mm, respectively.These cracks have a deeper level of damage, and although the damage develops at a slower rate, if left unchecked, they may pose a greater risk to pedestrian safety and vehicular traffic. Therefore, key monitoring measures need to be taken for these severely damaged cracks to keep a close watch on their development. Targeted repairs to these cracks are recommended in the short term to prevent further deterioration of the damage and to ensure the structural safety and service life of the bridge.
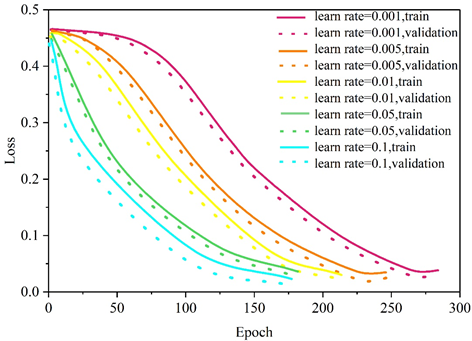
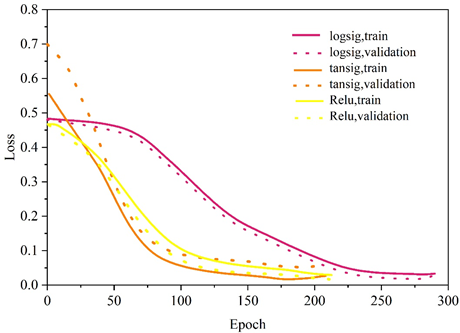
The results of the distribution of the error rates show that there is not a simple linear relationship between the neural network structure and the error rates, which further illustrates the necessity of extensively exhausting their combined datasets when making hyperparameter selections. Of all the hyperparameter combinations, the neural network with the lowest error rate is the one with the number of neurons of 8 and 9 for Layer1 and Layer2, respectively. With this determination of the parameters of the neural network, there are still training-related hyperparameters that need to be optimized so that the prediction performance of the neural network can be further improved on this basis. The hyperparameters in this part include: learning rate, activation function, and training algorithm.
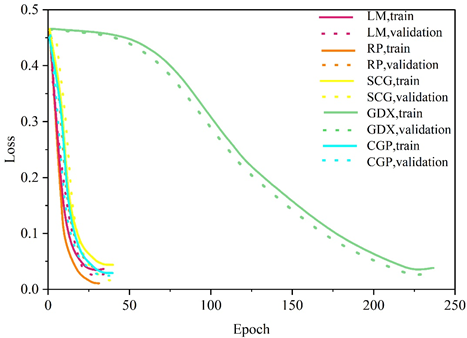
Since the loss function is directly related to the performance of the final model, the lower value of the loss function indicates the better performance of the neural network. The performance of the neural network on the training set and validation set during the training process is shown respectively, and it should be noted that the termination condition is to reach 1000 Epochs or the loss function of the neural network has reached the minimum value in 10 adjacent Epochs.
Figures 6-8 correspond to the history of the loss function values with the number of iterations for different learning rates, activation functions, and training algorithms, respectively. According to the traversal results of different parameters, the optimal combination of hyperparameters is finally selected, with 0.01 for the learning rate, Sigmoid function for the activation function and GDX algorithm for the training algorithm.
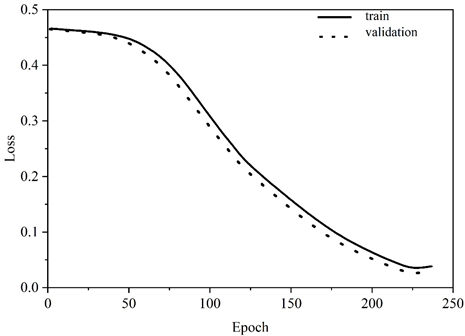
The neural network with the optimal combination of hyperparameters obtained is trained and the variation of the loss function is shown in Figure 9. During the training process, the performance of the neural network is close on the training set as well as the validation set, indicating that the generalization ability of the model is good. The results of the calculation of the indicators of the BP neural network are shown in Eqs (14) to (17).
\[\label{GrindEQ__14_} accuracy=\frac{6+3+3+4+8}{26} =92.3\% , \tag{14}\] \[\label{GrindEQ__15_} precision=\frac{85.7\% +100\% +75\% +100\% +100\% }{5} =92.1\% , \tag{15}\] \[\label{GrindEQ__16_} recall=\frac{100\% +75\% +100\% +80\% +100\% }{5} =91.0\% , \tag{16}\] \[\label{GrindEQ__17_} F1-score=\frac{2\times 92.1\% \times 91.0\% }{(92.1\% +91.0\% )} =91.5\% . \tag{17}\]
Comparing the calculation results of Random Forest, Adaboost and BP neural network as shown in Table 4, it can be found that the method based on BP neural network performs optimally in various performance indexes, in which the accuracy rate reaches 92.6%, and the multidimensional damage assessment of civil engineering can be realized by using BP neural network.
| Accuracy/% | Precision/% | Recall/% | F1/% | |
| Random forest algorithm | 84.3 | 84.5 | 86.3 | 86.1 |
| Adaboost algorithm | 91.3 | 87.9 | 83.2 | 85.3 |
| Bp neural network | 92.6 | 93.6 | 91.7 | 93.2 |
This paper applies deep learning vision technology to civil engineering crack detection. Aiming at the needs of crack detection on the surface of wood engineering, the crack detection model based on YOLOv8 is designed, and the damage degree of the crack is evaluated using BP neural network.
The recognition network of this paper’s crack detection method is compared with similar algorithms and different classes of algorithms in the CBP dataset, and the performance of this paper’s algorithm is the most excellent, and among the same type of algorithms, this paper’s algorithm has the highest mAP value and F1 value scores of 90.5% and 90.3%, respectively, and its accuracy value reaches 89.6%, which reflects the superiority of this paper’s algorithm in crack detection algorithms.
The absolute difference between the maximum width, average width and length of the cracks shows that the error of the width of the cracks is not more than 0.1mm, and the error of the length is not more than 20mm, and the comparison of the absolute difference shows that the model in this paper is able to effectively deal with the interference of the complex background, accurately detect the bridge cracks, and meet the practical application of the crack detection in civil engineering.
The optimal parameter combination of BP neural network is determined through experiments, the learning rate is 0.01, the activation function and training algorithm are Sigmoid function and GDX algorithm, respectively.The method of BP neural network is compared with Random Forest and Adaboost on various performance indexes, and the three indexes are all optimal, in which the accuracy rate reaches 92.6%.