
With the development of the national economy, electric power, communication network coverage area is more and more extensive, electric power transmission lines and communication lines in a large number of towers, such as high-voltage transmission line towers, communication base station towers and so on. Towers play an important role in the coverage of power transmission lines and communication networks [17,4,15,12]. However, due to some natural disasters and coal mining, engineering construction, man-made damage, etc., tower tilting occurs from time to time. Tower tilting often causes interruption of transmission lines and communication networks, and serious collapse events [3,14,7,1]. These will be a great threat to the safe operation of the transmission network and the normal work of the communication network. It will bring losses to people’s lives and properties. Therefore, real-time monitoring of the condition of the pole tower is particularly important [18,10].
The online monitoring system for transmission towers relates to the field of online monitoring of transmission towers. It is designed to solve the problem that the existing transmission pole tower monitoring setups using wired methods are susceptible to interference from strong electrical signals on the line and have a low degree of intelligence [2,19,20]. It is through the N tower monitoring unit for multi-point data acquisition, data including tower monitoring node tilt value, microwave value, wire tension value and vibration value and then sent to the tower monitoring main unit in a wireless way [11,5,9], the tower monitoring main unit monitors the temperature and humidity of the N tower monitoring unit and the area where the tower monitoring main unit is located, the wind speed, the wind direction, the rainfall, the barometric pressure and the insolation, and comprehensively conducts data processing, and finally transmitted to the monitoring center and mobile terminals that can communicate with the monitoring center through GPRS wireless communication [13,6,16,8].
Based on the above content, it can be concluded that the existing risk assessment and warning methods for transmission line operation still face problems such as difficulty in data collection, high computational complexity, and poor real-time performance. Therefore, a research proposes an online monitoring system for transmission towers based on computer video algorithms. The system collects data in a diversified manner by installing sensors and image processing on transmission towers. Finally, it is applied to deep learning models for prediction, achieving high-precision monitoring and warning effects.
Before conducting monitoring and early warning, high-resolution cameras need to be installed on transmission towers to collect information such as line sag and distribution. The video data captured by the camera is transmitted to the central monitoring center through high-speed wireless network. The study found that there are many environmental factors that affect the transmission line. In order to ensure the accuracy of monitoring, these environmental factors were also collected and the data was corrected. A sensing and monitoring circuit is proposed during the data collection process to collect the required dataset. The specific electrical composition is shown in Figure 1.
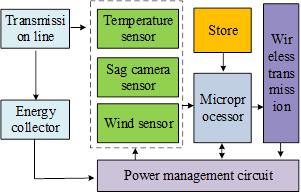
In Figure 1, the proposed sensing and monitoring circuit includes camera sag sensing, wind sensing, and temperature sensing. Under different wind speeds, the stress on transmission lines is not the same, and errors may occur in sag prediction due to the influence of wind speed. Therefore, the study incorporates wind factors into the construction of the computational model. First is to adjust the horizontal stress of the conductor based on the ground wind speed. The corrected horizontal stress is shown in Eq. (1). \[\label{GrindEQ__1_} f_{x} =\frac{h}{l} x-\frac{\theta \sigma _{0} h}{\gamma L_{h=0} } \left[sh\frac{\gamma ^{l} }{2\theta \sigma _{0} } +sh\frac{\left(2x-l\right)}{2\theta \sigma _{0} } \right]+\left[\frac{2\theta \sigma _{0} }{\gamma } sh\frac{\gamma ^{x} }{2\theta \sigma _{0} } sh\frac{\left(l-x\right)}{2\theta \sigma _{0} } \right]\sqrt{1+\left(\frac{h}{L_{h=0} } \right)} . \tag{1}\]
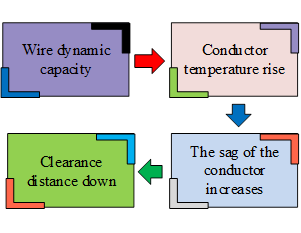
In Eq. (1), \(l\) is the span and \(\theta\) is the multiplicative correction factor, which is set to 0.45 and \(L_{h=0} =\frac{2\theta \sigma _{0} }{\gamma } sh\frac{\gamma ^{l} }{2\theta \sigma _{0} }\) in the study. In daily operation, the temperature of the conductor can cause changes in the sag of the conductor. The thermoelectric coupling relationship between temperature and wire sag is shown in Figure 2.
To reduce the impact of temperature uncertainty, the study classified all collected operating conditions according to temperature sensitivity. The study adopts relative entropy as the classification standard, and the specific process is shown in Eq. (2). \[\label{GrindEQ__2_} KL\left(X\left\| Y\right. \right)=H\left(X,Y\right)-H\left(Y\right)=\sum _{a=1}^{n}\sum _{b=1}^{m}P\left(x_{a} \right)\log \frac{P\left(x_{a} \right)}{P\left(x_{b} \right)} . \tag{2}\]
In Eq. (2), \(KL\left(X\left\| Y\right. \right)\) is the relative entropy of environmental temperature and sag relative error, \(P\left(x_{b} \right)\) is the probability distribution of error, \(n\) and \(m\) are the sizes of two datasets, \(Y\) is the relative error and \(H\left(X,Y\right)\) is cross entropy, \(P\left(x_{a} \right)\) is the probability distribution of temperature, \(X\) is the temperature variable, and \(H\left(Y\right)\) is the encoding of the true distribution. Based on the calculated relative entropy and fuzzy membership function, a predictive classification of operating conditions based on environmental temperature has been achieved. The specific process of dividing working conditions is shown in Figure 3.
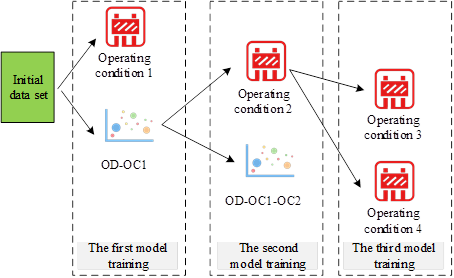
In Figure 3, the study further classified the operating conditions after multiple model trainings. After classification, the study predicts the sag situation under different working conditions.
Sensors are installed on transmission towers to receive corresponding transmission line video data, and after data correction, the computer video algorithms are used to analyze the operation status of transmission lines. Computer video algorithms collect and process data in the form of videos, and then identify and predict abnormal situations in the videos. BPNN is applied to pattern recognition and function approximation, which is trained through multi-layer feedforward networks and backpropagation algorithms, and can effectively learn and simulate complex nonlinear relationships. This study considers applying it to the construction of computer video algorithms. The study takes the sag value of the transmission line as the input of the model. In the collected information, the sag value cannot be directly obtained. Therefore, the study uses the catenary formula to calculate the sag data of the conductor. The equation of the catenary curve is shown in Eq. (3). \[\label{GrindEQ__3_} y=\frac{\sigma _{0} }{\gamma } \left(ch\frac{\gamma x^{2} }{\sigma _{0} } -1\right) . \tag{3}\]
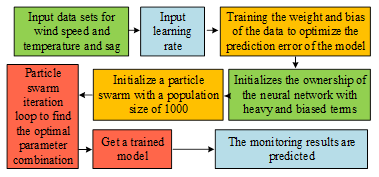
In Eq. (3), \(\gamma\) is the specific load of the conductor, \(x\) is the horizontal distance of the point to be calculated, \(c\) is a positive coefficient, \(h\) is the height difference between the suspension points of the two towers, and \(\sigma _{0}\) is the horizontal stress at the initial temperature. After inputting sag data into BPNN, more accurate prediction and analysis of the operation status of transmission lines can be made. In the forward propagation stage of BPNN, the input sag values are processed by weighted summation and activation functions of neurons in each layer to produce output results. If there is an error between the output result and the expected value, the system will enter the backpropagation stage, where the error gradient is calculated and the weights and biases are adjusted layer by layer to reduce the error. After multiple iterations of training, BPNN can gradually improve its prediction accuracy. However, due to the large number of hyperparameters in BPNN, it needs to be pre-trained in advance, and the training accuracy is not ideal. Therefore, PSO algorithm is used to optimize the training process and improve the global search ability of the neural network. PSO algorithm is an optimization technique based on swarm intelligence, which simulates the foraging behavior of bird flocks to find the optimal solution. Combining PSO algorithm with BPNN can optimize the weights and biases of neural networks, improving the accuracy and efficiency of predictions. The flowchart of the sag prediction method based on PSO-BP is shown in Figure 4.
In Figure 4, the study first initializes a three-layer BPNN and optimizes its parameters using the PSO algorithm. Finally, it is applied to sag prediction through measurement error compensation, realizing sag prediction. Based on the above content, the study adopts a computer video algorithm based on PSO algorithm and BPNN to establish an online monitoring system. By establishing a computer video algorithm to predict the sag of transmission towers, early warning of line operation obstacles can be achieved. To further revise the prediction model results, the GWO algorithm is utilized to further adjust the parameters of sag stress and specific load to ensure more accurate prediction results. The specific process of GWO algorithm is denoted in Figure 5.
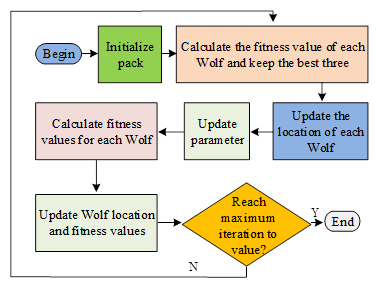
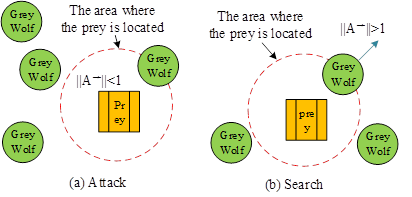
In Figure 5, the GWO algorithm searches for the optimal solution by simulating the social hierarchy and hunting strategy of grey wolves. In the study, the GWO algorithm is utilized to adjust the parameters of sag stress and specific load to optimize the performance of the prediction model. Through this approach, research can more accurately simulate the actual operating status of transmission lines under different environmental and load conditions, thereby improving the reliability of early warning systems. The specific schematic of attack behavior and search behavior is shown in Figure 6.
In Figure 6, the attacking behavior includes three stages: surrounding prey, approaching prey, and ultimately capturing prey. During the encirclement phase, the gray wolf pack forms a encirclement circle, gradually narrowing the range of their encirclement of prey. During the approach phase, the position and speed are adjusted based on the prey’s reaction and environmental conditions to approach the prey in the most effective way. During the capture phase, grey wolves utilize the power and speed advantage of their group to launch fast and precise attacks on their prey, ensuring successful capture. The search behavior is that when the prey moves, the gray wolf needs to constantly evaluate the position and speed of the prey, predict its possible movement trajectory, in order to adjust the search strategy in a timely manner and maintain tracking of the prey. The objective of the optimization process is to minimize the covariance between the true values and predicted results. Online monitoring and real-time warning of wire safety on transmission towers is realized through the above operations.
To validate the effectiveness of the proposed online monitoring system for transmission towers based on computer video algorithms, a series of experiments were designed and analyzed. The experimental environment included simulation environment and field environment. Simulation experiment was organized on MATLAB software. The simulation environment was used to simulate the operating conditions of various transmission towers, to test the accuracy and robustness of algorithms without actual physical equipment. The on-site environmental experiment was conducted on a real transmission tower in location A.
To further reduce the impact of wind speed on sag prediction, the study introduced a wind speed stress correction mechanism. To verify the rationality of the application of this mechanism, a comparison would be made between the prediction errors before and after correction using this mechanism. The result is shown in Figure 7.
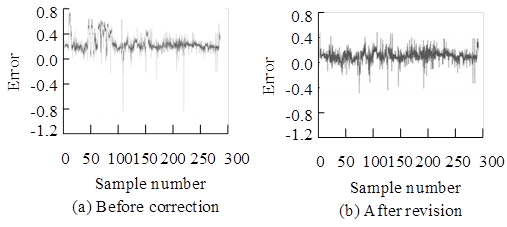
In Figure 7(a), before stress correction, the error fluctuation range of the model was between -0.8 and 0.8. In Figure 7(b), after stress correction, the error fluctuation range of the model was reduced to between -0.5 and 0.4. This indicated that the correction factor proposed in the study could effectively eliminate prediction errors caused by changes in wire stress due to external wind speed.
To further alleviate the impact of temperature environment on the accuracy of line sag prediction, the study used fuzzy logic and relative entropy methods to divide the operating conditions, and predicted the sag of the wires on the transmission tower in a targeted manner based on the division results. To verify the rationality of this method, a comparison was made between the prediction error values before and after the optimization of the applied operating condition division. The comparison results are shown in Figure 8.
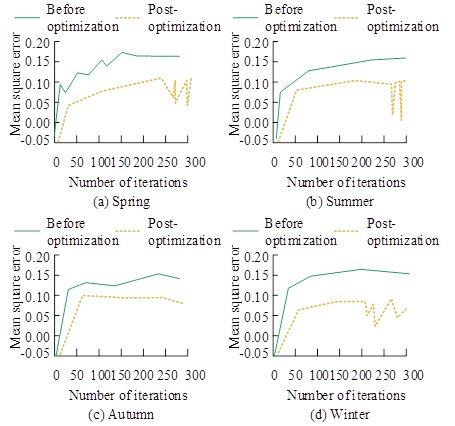
In Figure 8(a), under spring climate conditions, the mean square error of both models increased with the increase of iteration times. The average mean square error of the improved model was only 0.05, which was significantly better than the original model. In Figure 8(b), in summer, the performance of the improved model was also superior to that of the original model. In Figure 8(c), in the autumn season, which is usually windless and has moderate temperatures, the error values of both models were relatively low. The error value of the improved model was significantly lower, with an average of only 0.04. In Figure 8(d), the mean square error of the model after introducing optimized operating condition classification was significantly lower than before. This indicated that the proposed working condition classification method could effectively avoid prediction errors caused by temperature effects.
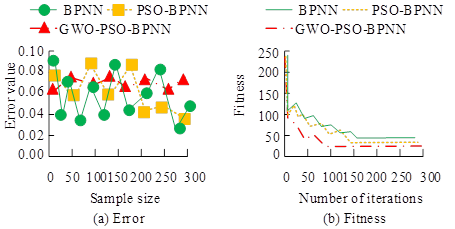
To improve the training accuracy of BPNN and further ensure the accuracy of sag prediction results obtained during the monitoring process, GWO and PSO algorithms were studied and applied for optimization and improvement. To test the improvement effect, the study compared the error values and fitness curves of a single BPNN with PSO-BPNN, GWO-PSO-BPNN models. The results are shown in Figure 9.
In Figure 9(a), the optimized GWO-PSO-BPNN model exhibited significant advantages in prediction error. Compared with a single BPNN model, the error value of the GWO-PSO-BPNN model was significantly reduced. In Figure 9(b), the fitness curve of the GWO-PSO-BPNN model became smoother during the iteration process and ultimately converged to a lower fitness value. This indicated that the model could more effectively find the global optimal solution during the optimization process, thereby improving the accuracy of prediction.
In addition, the study also conducted a comparative analysis of sag predictions proposed by research under different weather conditions. Comparative indicators included prediction error, prediction accuracy, response time, and area under the receiver’s operating curve (AUC). The specific results are shown in Table 1.
| Project | Prediction error (%) | Prediction accuracy (%) | Response time (s) | AUC | |
| Rainy day | BPNN | 12.5 | 82.3 | 1.5 | 0.78 |
| PSO-BPNN | 8.7 | 89.5 | 1.2 | 0.85 | |
| GWO-PSO-BPNN | 5.3 | 93.6 | 0.9 | 0.92 | |
| Snow | BPNN | 15.2 | 79.6 | 1.8 | 0.72 |
| PSO-BPNN | 10.4 | 86.7 | 1.4 | 0.81 | |
| GWO-PSO-BPNN | 6.8 | 91.2 | 1.1 | 0.89 | |
| Clear weather | BPNN | 7.6 | 90.1 | 0.8 | 0.88 |
| PSO-BPNN | 4.1 | 94.8 | 0.6 | 0.94 | |
| GWO-PSO-BPNN | 2..2 | 97.3 | 0.4 | 0.97 | |
From Table 1, under rainy conditions, the GWO-PSO-BPNN model had the smallest prediction error of only 5.3%, the highest prediction accuracy of 93.6%, the shortest response time of 0.9 seconds, and the highest AUC value of 0.92. Under snowy conditions, the GWO-PSO-BPNN model also performed the best, with a prediction error of 6.8%, a prediction accuracy of 91.2%, a response time of 1.1 seconds, and an AUC value of 0.89. Under clear weather conditions, the prediction error of the GWO-PSO-BPNN model was further reduced to 2.2%, the prediction accuracy was as high as 97.3%, the response time was shortened to 0.4 seconds, and the AUC value reached 0.97.
To further prove the application effectiveness of the proposed online monitoring system (System 1), a comparative experiment was conducted with the currently popular transmission line online monitoring system. The comparative methods included the monitoring system (System 2) in reference, the monitoring system (System 3) in reference, and the monitoring system (System 4) in reference. The study applied these four systems together to the elevated transmission system of A site, and installed them on different transmission towers for testing. The experiment lasted for 4 months, and the results of warning frequency and accuracy within 4 months are shown in Figure 10.
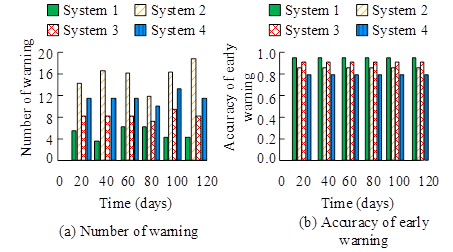
In Figure 10(a), System 1 was significantly better than the other three systems in terms of warning frequency, with an average of 12 warnings in four months, while System 2, System 3, and System 4 had an average of 8, 7, and 6 warnings, respectively. In Figure 10(b), the warning accuracy of System 1 reached over 98.57%, which was higher than other systems.
To further assess the performance of the proposed system, the response time, warning accuracy, false negative rate, and false positive rate of four systems were recorded during the experimental period. The specific results are shown in Table 2.
| Project | Response time (s) | Warning accuracy rate (%) | False positive rate (%) | False negative rate (%) |
| System 1 | 0.5 | 98.15 | 2.0 | 0.5 |
| System 2 | 0.8 | 95.22 | 3.0 | 1.6 |
| System 3 | 0.6 | 97.12 | 2.5 | 1.0 |
| System 4 | 0.7 | 94.32 | 3.6 | 1.7 |
From Table 2, System 1 performed the best in response time, with an average response time of 0.5 seconds. At the same time, it also achieved a warning accuracy of 98%, with a false positive rate of 2% and a false negative rate of 0.5%, demonstrating high performance. Compared to other systems, its performance was relatively better.
To further ensure the safe operation of elevated transmission lines and provide users with reliable and stable electrical energy, a transmission tower online monitoring system based on computer video algorithm was proposed. This system achieved intelligent warning by predicting the sag of the line. Through experimental analysis, it can be concluded that the introduction of wind speed stress correction and temperature factor classification mechanism significantly reduced the prediction error of the model, by about 20%. In addition, the prediction accuracy of the model was further improved through the PSO algorithm and GWO algorithm improvement. In adverse weather conditions, the prediction accuracy of GWO-PSO-BPNN remained at 91.2%. During the field testing process, the warning accuracy of the system reached over 98.57%, and the response time was only 0.5 seconds. The false positive and negative rates were both below 2%. From this, it can be seen that the proposed online monitoring system for transmission towers based on computer video algorithms can maintain high monitoring accuracy and help staff maintain the safety of the transmission network in a timely manner. In future research, the impact of humidity and regional specificity on transmission lines can be further considered to raise the accuracy of the monitoring system.
This work was sponsored in part by the Science and Technology Project of State Grid Shanxi Electric Power Company (Grant No. 5205K0240002).